. 2022 Jun 1;135(11):jeb258608.
doi: 10.1242/jcs.258608. Epub 2022 Jun 8.

The developmental stage of the medulloblastoma cell-of-origin restricts Sonic hedgehog pathway usage and drug sensitivity

Affiliations

The developmental stage of the medulloblastoma cell-of-origin restricts Sonic hedgehog pathway usage and drug sensitivity

Marlinde J Smit et al. J Cell Sci. .

Abstract

Sonic hedgehog (SHH) medulloblastoma originates from the cerebellar granule neuron progenitor (CGNP) lineage, which depends on Hedgehog signaling for its perinatal expansion. Whereas SHH tumors exhibit overall deregulation of this pathway, they also show patient age-specific aberrations. To investigate whether the developmental stage of the CGNP can account for these age-specific lesions, we analyzed developing murine CGNP transcriptomes and observed highly dynamic gene expression as a function of age. Cross-species comparison with human SHH medulloblastoma showed partial maintenance of these expression patterns, and highlighted low primary cilium expression as hallmark of infant medulloblastoma and early embryonic CGNPs. This coincided with reduced responsiveness to upstream SHH pathway component Smoothened, whereas sensitivity to downstream components SUFU and GLI family proteins was retained. Together, these findings can explain the preference for SUFU mutations in infant medulloblastoma and suggest that drugs targeting the downstream SHH pathway will be most appropriate for infant patients.

Keywords: Cerebellar development; Cerebellar granule neuron progenitors; Medulloblastoma; Primary cilia; Sonic hedgehog signaling; Tumor cell-of-origin.


Conflict of interest statement

Competing interests The authors declare no competing or financial interests.

Figures
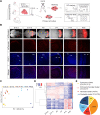
Fig. 1.
Fig. 1.
Developing CGNPs exhibit age-specific gene expression. (A) Schematic overview of the experimental workflow. To perform transcriptome analysis on developing CGNPs, embryonic E13.5 CGNPs are labeled with tdTomato in vivo following a single tamoxifen pulse administered to pregnant females. Fluorescent cerebella are subsequently dissected at different time points between E15.5 and P30, and tdTomato+ cells are sorted by FACS. For cell culture experiments, unsorted CGNPs isolated from dissected cerebella are treated with 4-hydroxytamoxifen in vitro (E, embryonic day; P, postnatal day; FACS, fluorescence-activated cell sorting). (B) Stereoscopic (top panels) or confocal images (middle and bottom panels) showing native tdTomato fluorescence in whole-mount cerebella and sagittal sections, respectively (RL, rhombic lip; EGL, external granular layer; IGL, internal granular layer; ML, molecular layer). Counterstaining by DAPI. Scale bars: 2 mm (stereoscopic images), 50 μm (confocal images). Images representative of n=3 experimental repeats. (C) Principal component analysis of E15.5, E17.5, P0, P7, P14 and P30 CGNP transcriptomes. n=3 biological replicates per developmental time point. For embryonic time points, CGNPs from n=4 embryos were pooled per sample; for postnatal time points, individual mice were analyzed. See also Table S1. (D) Heatmap showing differentially expressed CGNP genes as a function of developmental time point (unsupervised hierarchical clustering analysis). Genes are clustered according to the branching of the clustering tree into five major clusters: yellow cluster (E15.5–E17.5); orange cluster (E15.5–P7); red cluster (P0–P7); light blue and dark blue clusters (P14–P30). See also Table S2. (E) Pie chart summarizing five major clusters of differentially expressed genes. Yellow cluster (E15.5–E17.5, n=471 genes); orange cluster (E15.5–P7, n=1541 genes); red cluster (P0–P7, n=619 genes); light blue cluster (P14–P30, n=763); and dark blue cluster (P14–P30, n=943).
Fig. 2.
Fig. 2.
Specific biological processes are enriched during CGNP development. Gene ontological analysis shows enriched biological processes in the different CGNP age-specific gene clusters. Each node represents a biological process. Related biological processes are grouped and labeled by biological theme (curved dashed lines). Individual biological processes are assembled in rectangular boxes (dashed lines). Biological processes connected by edges have genes in common. Enriched biological processes were determined with the Database of Annotation, Visualization and Integrated Discovery (DAVID), v.6.8 (Benjamini-corrected q=0.1, P=0.01) and visualized with the Enrichment Map app in Cytoscape. Yellow nodes, E15.5–E17.5 cluster; orange nodes, E15.5–P7 cluster; red nodes, P0–P7 cluster; light blue nodes, P14–P30 cluster; dark blue nodes, P14–P30 cluster. See also Fig. S1 and Table S3.
Fig. 3.
Fig. 3.
Cell cycle regulation and primary cilia biogenesis are age-dependent processes in CGNPs and medulloblastoma. (A) Gene expression profiles of CGNP genes commonly mutated in medulloblastoma, extracted from the RNA-seq data set. Curves represent the average expression level from n=3 biological replicates, error bars indicate s.d. (FPM=fragments per million, E, embryonic day; P, postnatal day). See also Fig. S2. (B) Cross-species comparison. Heatmap showing unsupervised hierarchical clustering of differentially expressed human medulloblastoma genes (patient-age groups, 0–3 years, 4–11 years, 12 years and older) and CGNP orthologous genes. Blue dots represent patient samples, red dots represent CGNP samples. Lowest gene cluster indicated by red bar. (C) Gene expression profiles of CGNP genes associated with the SHH signaling pathway, extracted from the RNA-seq data set presented as in A. See also Table S1. (D) Enrichment map representing biological processes enriched in the lower (red) gene cluster of the cross-species comparison heatmap in B. No enriched processes were found in the upper gene clusters. Each node represents a biological process. Related biological processes are grouped and labeled by biological theme (curved dashed lines). Biological processes connected by edges have genes in common. Enriched biological processes were determined with the Database of Annotation, Visualization and Integrated Discovery (DAVID), v.6.8 (Benjamini-corrected q=0.1, P=0.01) and visualized with the Enrichment Map app in Cytoscape. (E) Confocal images showing ARL13B protein expression (primary cilium marker) in human fetal cerebellum (upper left panel) and in SHH medulloblastoma samples of 3–4-year-old patients (upper right and lower panels). Counterstaining by DAPI. Images representative of n=2 experimental repeats. Insets showing higher magnification (2.25×). Scale bars: 20 µm.
Fig. 4.
Fig. 4.
Primary cilium expression and length in the developing murine cerebellum. (A) Confocal images showing Arl13b expression in developing mouse cerebellum (E12.5 and E13.5) (RL, rhombic lip; E, embryonic day). Counterstaining by DAPI. Insets showing higher magnification (3.5×). Scale bars: 25 µm. (B) Confocal images showing Arl13b and tdTomato expression in the developing mouse cerebellum (E15.5 RL, E15.5 EGL, P0, P7) (P, postnatal day; RL, rhombic lip; EGL, external granular layer; IGL, internal granular layer). Insets showing higher magnification (5×) . Scale bars: 25 µm. Images in A and B representative of n=3 experimental repeats. (C) Plot showing the average ratio of ciliated CGNPs (i.e. Arl13b+/tdTomato+ cells) per location and developmental timepoint. Results represent median and complete range. n=3 biological replicates. (D) Box-and-whisker plot showing the average CGNP primary cilium length per location and developmental timepoint. n=3 biological replicates. The box represents the 25–75th percentiles, and the median is indicated. The whiskers show the minimum to maximum. *P<0.05; ***P<0.001 (ordinary one-way ANOVA with Tukey's post-hoc test).
Fig. 5.
Fig. 5.
SUFU and SMO expression and activity in developing CGNPs. (A,B) Confocal images showing (A) SUFU and (B) Smoothened (SMO) protein expression in the E15.5 RL, E15.5 EGL, P0 and P7 cerebellum. Counterstaining by DAPI (RL, rhombic lip; EGL, external granular layer; IGL, internal granular layer; E, embryonic day; P, postnatal day). Insets showing higher magnification (4×). Scale bars: 25 µm. See also Fig. S3A. (C) Confocal images showing representative examples of Arl13b and tdTomato protein expression in E15.5 (upper panel) and P7 (lower panel) primary CGNP cultures. Counterstaining by DAPI. Scale bar: 10 µm. Images in A–C are representative of n=3 experimental repeats. (D,E) Box-and-whisker plots showing primary cilium ratio (D) and length (E) in cultured E15.5 and P7 CGNPs. n=4 biological replicates. **P<0.01 (unpaired, two-sided t-tests). (F) Plots showing the average ratio of PCNA+/DAPI+ E15 and P7 cerebellar cells after SmoM2 (left chart) or Sufu-i shRNA (right chart), or empty vector (EV) control retroviral transduction. Results represent median and complete range; n=3 biological replicates, except for P7 EV (SmoM2), which was n=2. *P<0.05 (for SmoM2, unpaired, two-sided t-test; for Sufu-i, paired, two-sided t-test). See also Fig. S3B,C. For the box-and-whisker plots, the box represents the 25–75th percentiles, and the median is indicated. The whiskers show the minimum to maximum.
Fig. 6.
Fig. 6.
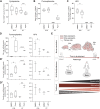
Embryonic CGNPs are partially insensitive to Smoothened manipulation. (A) Box-and-whisker plot showing the relative cell counts of tdTomato+ (Tom+) CGNPs after 48 h of treatment with DMSO (control) or cyclopamine (5 µM) in E15.5 or P7 CGNP primary cultures. n=8 biological replicates. (B) Box-and-whisker plot showing the average ratio of PCNA+/tdTomato+ cells after 48 h of treatment with DMSO (control) or purmorphamine (250 nM) in E15.5 or P7 CGNP primary cultures. E15, n=12; and P7, n=5 biological replicates. See also Fig. S3D. (C) Box-and-whisker plot showing the average ratio of PCNA+/tdTomato+ cells after 48 h of treatment with DMSO (control) or HPI1 (2.5 µM) in E15.5 or P7 CGNP primary cultures. E15, n=9; and P7, n=5 biological replicates. (D–D″) Results are given in box-and-whisker plots (purmorphamine) or represent median and complete range (HPI1). Plots show relative Gli1 (D), Cyclin D1 (Ccnd1) (D′), or Cyclin D2 (Ccnd2) (D″) mRNA expression levels compared to Gapdh in purmorphamine- (left graphs, 250 nM) or HPI1- (right graphs, 2.5 µM) treated E15.5 and P7 CGNPs, as determined by qRT-PCR. E15 purmorphamine, n=5; P7 purmorphamine, n=3; E15 HPI1, n=3; and P7 HPI1, n=3 biological replicates. See also Fig. S3E,F. *P<0.05, **P<0.01, ***P<0.001 (paired, two-sided t-test). For the box-and-whisker plots, the box represents the 25–75th percentiles, and the median is indicated. The whiskers show the minimum to maximum. (E) Proposed model. SHH medulloblastoma derives from the CGNP population. CGNPs are specified in the rhombic lip (RL) of the early embryonic cerebellum, from where they migrate across the cerebellar surface to form the external granular layer (EGL). Upon terminal differentiation, CGNPs migrate inwards to form the definitive internal granular layer (IGL). Expression and length of primary cilia, which are important components of upstream SHH signaling, increases as CGNP development progresses. Thus, if oncogenic transformation takes place at late stages of CGNP development, SMO may be preferentially mutated as the primary cilia enhance oncogenic SMO activity. However, if CGNP oncogenic transformation occurs at an early embryonic stage, SUFU may be preferentially mutated, which controls downstream SHH signaling independently from the primary cilium. This implies that targeted therapy for infant SHH medulloblastoma should be directed towards downstream tumor-driving mechanisms.

Similar articles

Cited by

References

    1. Angley, C., Kumar, M., Dinsio, K. J., Hall, A. K. and Siegel, R. E. (2003). Signaling by bone morphogenetic proteins and smad1 modulates the postnatal differentiation of cerebellar cells. J. Neurosci. 23, 260-268. 10.1523/JNEUROSCI.23-01-00260.2003 - DOI - PMC - PubMed
    1. Anne, S. L., Govek, E.-E., Ayrault, O., Kim, J. H., Zhu, X., Murphy, D. A., Van Aelst, L., Roussel, M. F. and Hatten, M. E. (2013). WNT3 inhibits cerebellar granule neuron progenitor proliferation and medulloblastoma formation via MAPK activation. PLoS One 8, e81769. 10.1371/journal.pone.0081769 - DOI - PMC - PubMed
    1. Bangs, F. K., Schrode, N., Hadjantonakis, A. K. and Anderson, K. V. (2015). Lineage specificity of primary cilia in the mouse embryo. Nat. Cell Biol. 17, 113-122. 10.1038/ncb3091 - DOI - PMC - PubMed
    1. Blaess, S. (2006). Sonic hedgehog regulates Gli activator and repressor functions with spatial and temporal precision in the mid/hindbrain region. Development 133, 1799-1809. 10.1242/dev.02339 - DOI - PubMed
    1. Carter, R. A., Bihannic, L., Rosencrance, C., Hadley, J. L., Tong, Y., Phoenix, T. N., Natarajan, S., Easton, J., Northcott, P. A. and Gawad, C. (2018). A single-cell transcriptional atlas of the developing murine cerebellum. Curr. Biol. 28, 2910-2920.e2. 10.1016/j.cub.2018.07.062 - DOI - PubMed

Publication types

Substances