. 2022 May 17;11(10):e025181.
doi: 10.1161/JAHA.121.025181. Epub 2022 May 10.

Myeloid Poldip2 Contributes to the Development of Pulmonary Inflammation by Regulating Neutrophil Adhesion in a Murine Model of Acute Respiratory Distress Syndrome

Affiliations

Myeloid Poldip2 Contributes to the Development of Pulmonary Inflammation by Regulating Neutrophil Adhesion in a Murine Model of Acute Respiratory Distress Syndrome

Ziwei Ou et al. J Am Heart Assoc. .

Abstract

Background Lung injury, a severe adverse outcome of lipopolysaccharide-induced acute respiratory distress syndrome, is attributed to excessive neutrophil recruitment and effector response. Poldip2 (polymerase δ-interacting protein 2) plays a critical role in regulating endothelial permeability and leukocyte recruitment in acute inflammation. Thus, we hypothesized that myeloid Poldip2 is involved in neutrophil recruitment to inflamed lungs. Methods and Results After characterizing myeloid-specific Poldip2 knockout mice, we showed that at 18 hours post-lipopolysaccharide injection, bronchoalveolar lavage from myeloid Poldip2-deficient mice contained fewer inflammatory cells (8 [4-16] versus 29 [12-57]×104/mL in wild-type mice) and a smaller percentage of neutrophils (30% [28%-34%] versus 38% [33%-41%] in wild-type mice), while the main chemoattractants for neutrophils remained unaffected. In vitro, Poldip2-deficient neutrophils responded as well as wild-type neutrophils to inflammatory stimuli with respect to neutrophil extracellular trap formation, reactive oxygen species production, and induction of cytokines. However, neutrophil adherence to a tumor necrosis factor-α stimulated endothelial monolayer was inhibited by Poldip2 depletion (225 [115-272] wild-type [myePoldip2+/+] versus 133 [62-178] myeloid-specific Poldip2 knockout [myePoldip2-/-] neutrophils) as was transmigration (1.7 [1.3-2.1] versus 1.1 [1.0-1.4] relative to baseline transmigration). To determine the underlying mechanism, we examined the surface expression of β2-integrin, its binding to soluble intercellular adhesion molecule 1, and Pyk2 phosphorylation. Surface expression of β2-integrins was not affected by Poldip2 deletion, whereas β2-integrins and Pyk2 were less activated in Poldip2-deficient neutrophils. Conclusions These results suggest that myeloid Poldip2 is involved in β2-integrin activation during the inflammatory response, which in turn mediates neutrophil-to-endothelium adhesion in lipopolysaccharide-induced acute respiratory distress syndrome.

Keywords: ARDS; Poldip2; adhesion; integrin; neutrophil.


Figures

Figure 1
Figure 1. Characterization of myeloid‐specific Poldip2 (polymerase [DNA‐directed] δ‐interacting protein 2) knockout mice.
A, Poldip2 mRNA expression (relative to myePoldip2+/+, normalized with RPL and HPRT) in purified bone marrow neutrophils, perfused hearts and lungs, measured by quantitative reverse transcription polymerase chain reaction. Data represent medians with 95% CIs (n=5); **P<0.01 (Mann‐Whitney test). B, Poldip2 protein expression (relative to wild‐type and normalized with vinculin) in myePoldip2+/+ and myePoldip2‐/‐ neutrophils. Data represent medians with 95% CIs (n=8); **P<0.01 (Mann‐Whitney test). C, Differential counts of circulating leukocytes. Blood collected from myePoldip2+/+ and myePoldip2‐/‐ mice was analyzed for absolute number of white blood cells, lymphocytes, monocytes, and granulocytes. Data represent medians with 95% CIs (n=5). No difference was observed between genotypes. GRAN indicates granulocytes; HPRT, hypoxanthine guanine phosphoribosyl transferase; LYM, lymphocytes; MONO, monocytes; myePoldip2+/+, wild type; myePoldip2‐/‐, myeloid‐specific Poldip2 knockout; Poldip2, polymerase (DNA‐directed) δ‐interacting protein 2; RPL, ribosomal protein L13A; and WBC, white blood cells.
Figure 2
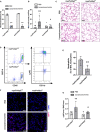
Figure 2. Myeloid‐specific Poldip2 (polymerase [DNA‐directed] δ‐interacting protein 2) knockdown reduces neutrophil pulmonary infiltration in lipopolysaccharide‐induced acute respiratory distress syndrome.
A, Core body temperature measured 18 hours after injection of PBS or lipopolysaccharide (18 mg/kg). Similar drops in temperature show that both genotypes responded equally to lipopolysaccharide. Data represent medians with 95% CIs (n=5); **P<0.01 compared with PBS of the same genotype (Mann Whitney tests). B, Total cell counts were measured in bronchoalveolar lavage collected 18 hours after PBS or lipopolysaccharide injection. Data represent medians with 95% CIs (n=10); ***P<0.001 compared with myePoldip2+/+ PBS group, # P<0.05 compared with myePoldip2+/+ lipopolysaccharide group (Kruskal‐Wallis with Dunn multiple comparisons test). C, MyePoldip2+/+ and myePoldip2‐/‐ mice were given intraperitoneal PBS or lipopolysaccharide as described above, and lungs were harvested for hematoxylin and eosin staining. Representative pictures show decreased interstitial edema and cell infiltration in lungs after lipopolysaccharide administration in myePoldip2‐/‐ compared with myePoldip2+/+ (n=5). D and E, Following administration of lipopolysaccharide as above, bronchoalveolar lavage cells were labeled with CD45, CD11b, and Ly6G antibodies for neutrophil identification by flow cytometry. Panel D shows the gating strategy in which leukocytes were first gated as CD45+ (left) and neutrophils were further gated as CD11b+Ly6G+ (right). The percentages of neutrophils in bronchoalveolar lavage leukocytes after lipopolysaccharide injection were quantified (E). Data represent medians with 95% CIs (n=6 in myePoldip2+/+ and n=5 in myePoldip2‐/‐); **P<0.01 (Mann‐Whitney test). F and G. Lungs were harvested 18 hours post PBS or lipopolysaccharide injection for immunofluorescence staining. Panel F shows neutrophil pulmonary infiltration after staining with the neutrophil‐specific marker Ly6G, which was quantified in panel G. Data represent medians with 95% CIs (n=5); **P<0.01 compared with myePoldip2+/+ PBS group, # P<0.05 compared with myePoldip2+/+ lipopolysaccharide group (Mann‐Whitney tests). BAL indicates bronchoalveolar lavage; CD11b, integrin alpha M; CD45, leukocyte common antigen; DAPI, 4′,6‐diamidino‐2‐phenylindole; Ly6G; lymphocyte antigen 6 complex, locus G; myePoldip2+/+, wild type; myePoldip2‐/‐, myeloid‐specific Poldip2 knockout; Poldip2, polymerase (DNA‐directed) δ‐interacting protein 2; and SSC‐H, side scatter‐height.
Figure 3
Figure 3. Poldip2 (polymerase [DNA‐directed] δ‐interacting protein 2) knockdown has little effect on neutrophil effector function.
A through D. Isolated bone marrow neutrophils were stimulated with 1 μg/mL lipopolysaccharide for 2 hours, and mRNA expression of inflammatory markers was measured by quantitative reverse transcription polymerase chain reaction. Lipopolysaccharide induced a significant increase of TNF‐α, IL‐1β, IL‐6 and CXCL‐2 mRNA in both Poldip2+/+ and Poldip2+/‐ neutrophils. No significant difference between genotypes was noted, except that IL‐6 was slightly less upregulated in Poldip2+/‐ compared with Poldip2+/+ neutrophils. Bars represent medians with 95% CIs (n=4 for TNF‐α, IL‐1β, and xIL‐6 and n=5 for CXCL‐2); *P<0.05, **P<0.01, compared with respective PBS group; # P<0.05, compared with Poldip2+/+ lipopolysaccharide (Mann‐Whitney tests). E, Isolated bone marrow neutrophils were stimulated with either PMA (324 nM) or lipopolysaccharide (50 μg/mL) before measuring neutrophil extracellular trap formation with the SYTOX green assay. Lipopolysaccharide induced a significant increase of neutrophil extracellular trap (NET) formation in both genotypes. Bars represent final fluorescence intensity at 90 minutes relative to control as medians with 95% CIs (n=3); *P<0.05, **P<0.01, compared with respective control groups (Kruskal‐Wallis with Dunn multiple comparisons test). No significant difference of NETs formation was observed between Poldip2+/+ and Poldip2+/‐ neutrophils. F, Time course of superoxide production. Neutrophils were stimulated with PMA (324 nM) and absorbance was measured every minute for 2 hours. The concentration of superoxide was calculated as described in Methods. Data represent mean ± SEM (n=3). No significant difference in superoxide formation was observed at any time point between Poldip2+/+ and Poldip2+/‐ neutrophils. CXCL‐2 indicates chemokine (C‐X‐C motif) ligand 2; IL‐1β interleukin‐1β; IL‐6, interleukin‐6; NETosis, NET formation; PMA, phorbol 12‐myristate 13‐acetate; Poldip2 polymerase (DNA‐directed) δ‐interacting protein 2; and TNF‐α, tumor necrosis factor‐α.
Figure 4
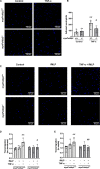
Figure 4. Reduced adhesion and transendothelial migration in myePoldip2‐/‐ neutrophils.
A through B, Adhesion of Hoechst‐labeled neutrophils to a TNF‐α‒stimulated mouse lung microvascular endothelial cell monolayer. TNF‐α‐induced adhesion was abrogated in neutrophils isolated from bone marrow of myePoldip2‐/‐, compared with myePoldip2+/+ mice. Bars represent medians with 95% CIs (n=5); **P<0.01 compared with myePoldip2+/+ control; # P<0.05 compared with myePoldip2+/+ TNF‐α (Mann‐Whitney tests, 1‐tailed). C, Representative images of neutrophils at the bottom of transwell inserts membrane following transmigration assays. D and E, Quantification of transmigrated neutrophils on the bottom of membrane (D) and in the lower chamber media (E). MyePoldip2+/+ neutrophils showed enhanced transmigration when the endothelial monolayer was stimulated with TNF‐α and 100nM fMLP was added in the lower chamber, which was not observed in myePoldip2‐/‐ neutrophils. Data are presented as fold change relative to myePoldip2+/+ baseline transmigration and bars represent medians with 95% CIs (n=5); **P<0.01 compared with myePoldip2+/+ without TNF‐α and fMLP, # P<0.05, ## P<0.01 compared with myePoldip2+/+ with TNF‐α and fMLP (Mann‐Whitney tests, 1‐tailed). fMLP indicates N‐formylmethionyl‐leucyl‐phenylalanine; MLMEC, mouse lung microvascular endothelial cell; myePoldip2+/+, wild type; myePoldip2‐/‐, myeloid‐specific Poldip2 knockout; Poldip2, polymerase (DNA‐directed) δ‐interacting protein 2; and TNF‐α, tumor necrosis factor α.
Figure 5
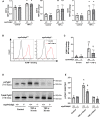
Figure 5. Poldip2 (polymerase [DNA‐directed] δ‐interacting protein 2) deficiency impairs β2‐integrin activation and Pyk2 phosphorylation in neutrophils.
A, Surface expression of β2 integrin αL subunit (left), αM subunit (middle) and β subunit (right) in bone marrow neutrophils isolated from myePoldip2+/+ and myePoldip2‐/‐ mice. Data represent mean fluorescence intensity fold change relative to control as medians with 95% CIs (n=5), *P<0.05, **P<0.01, compared with respective control group (Mann‐Whitney tests). No significant difference was noted between genotypes. B and C, Assessment of β2 integrin activation using the soluble intercellular adhesion molecule‐1 binding assay. Isolated bone marrow neutrophils were stimulated using 20 ng/mL TNF‐α for 10 minutes and incubated with soluble intercellular adhesion molecule‐1‐Fc in the presence of 5mM Mn2+. Data represent fluorescence intensity fold change as medians with 95% CIs (n=5); **P<0.01 compared with myePoldip2+/+ control group, # P<0.05 compared with myePoldip2+/+ Mn2+ + TNF‐α group (Mann‐Whitney tests). D and E, Pyk2 phosphorylation of adhered neutrophils. Isolated bone marrow neutrophils were added to intercellular adhesion molecule‐1 coated plates and either left unstimulated or stimulated with 20 ng/mL TNF‐α for 10 or 30 minutes. Data represent the ratio of phosphorylated Pyk2 (p‐Pyk2) to total Pyk2 as medians with 95% CIs (n=4 for all groups except for myePoldip2‐/‐ control, in which n=3), *P<0.05 compared with myePoldip2+/+ control group, # P<0.05 compared with myePoldip2+/+ TNF‐α 10 minute group (Mann‐Whitney tests). ICAM‐1 indicates intercellular adhesion molecule 1; MFI, mean fluorescence intensity; myePoldip2+/+, wild type; myePoldip2‐/‐, myeloid‐specific Poldip2 knockout; Poldip2, polymerase (DNA‐directed) δ‐interacting protein 2; Pyk2, protein tyrosine kinase 2 beta; and TNF‐α, tumor necrosis factor α.

Similar articles

Cited by

References

    1. Matthay MA, Zemans RL, Zimmerman GA, Arabi YM, Beitler JR, Mercat A, Herridge M, Randolph AG, Calfee CS. Acute respiratory distress syndrome. Nat Rev Dis Primers. 2019;5:18. doi: 10.1038/s41572-019-0069-0 - DOI - PMC - PubMed
    1. Ragaller M, Richter T. Acute lung injury and acute respiratory distress syndrome. J Emerg Trauma Shock. 2010;3:43–51. doi: 10.4103/0974-2700.58663 - DOI - PMC - PubMed
    1. Fan E, Brodie D, Slutsky AS. Acute respiratory distress syndrome: advances in diagnosis and treatment. JAMA. 2018;319:698–710. doi: 10.1001/jama.2017.21907 - DOI - PubMed
    1. Thompson BT, Chambers RC, Liu KD. Acute respiratory distress syndrome. N Engl J Med. 2017;377:1904–1905. doi: 10.1056/NEJMra1608077 - DOI - PubMed
    1. Herrero R, Sanchez G, Lorente JA. New insights into the mechanisms of pulmonary edema in acute lung injury. Ann Transl Med. 2018;6:32. doi: 10.21037/atm.2017.12.18 - DOI - PMC - PubMed

Publication types

MeSH terms