

Evaluation of thresholding methods for activation likelihood estimation meta-analysis via large-scale simulations
- PMID: 35535616
- PMCID: PMC9374884
- DOI: 10.1002/hbm.25898
Evaluation of thresholding methods for activation likelihood estimation meta-analysis via large-scale simulations
Abstract
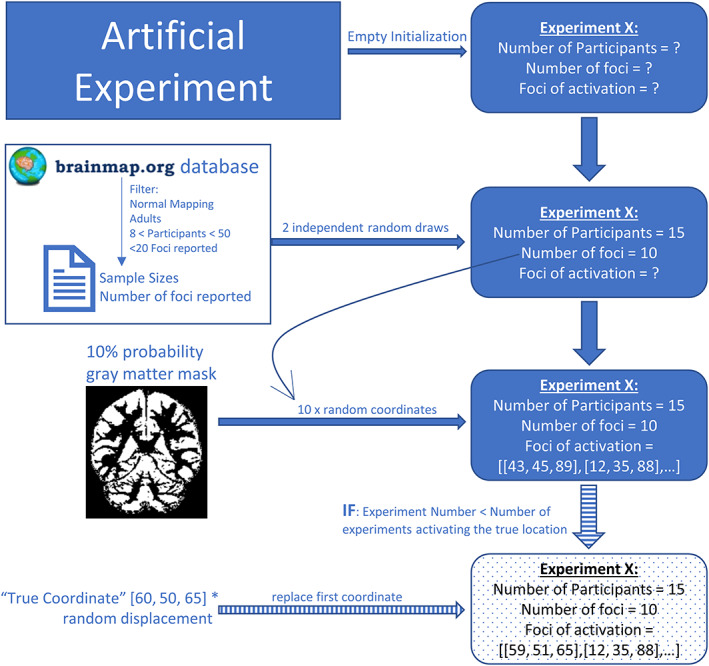
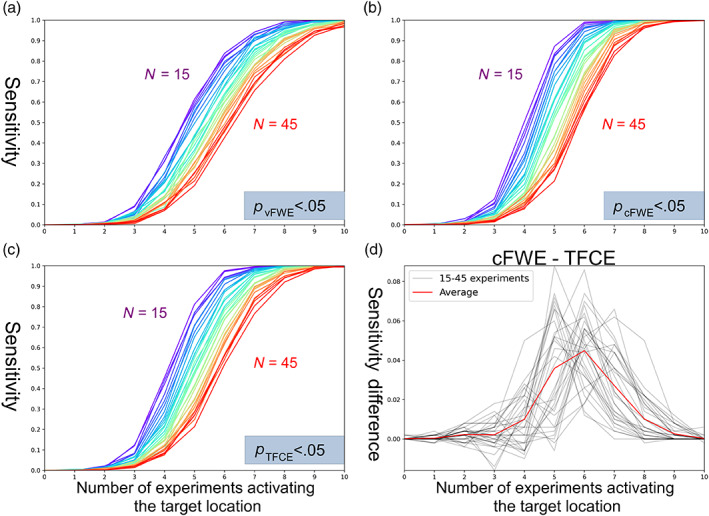
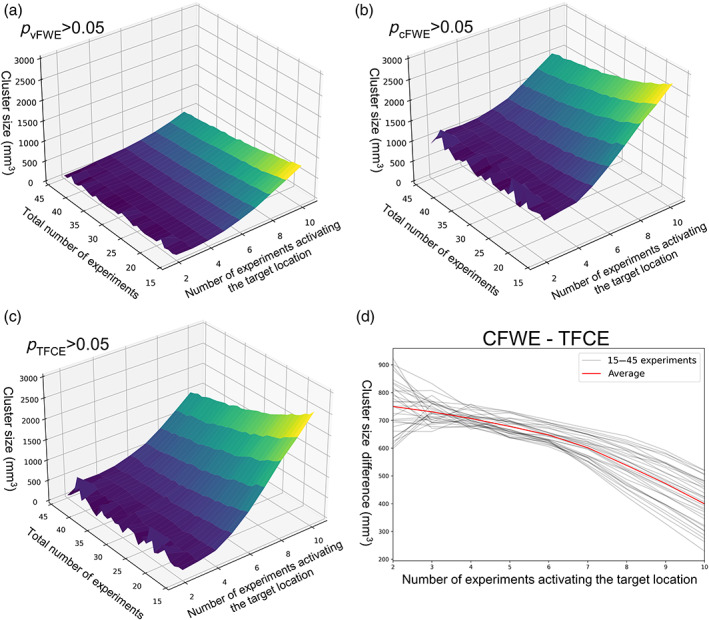
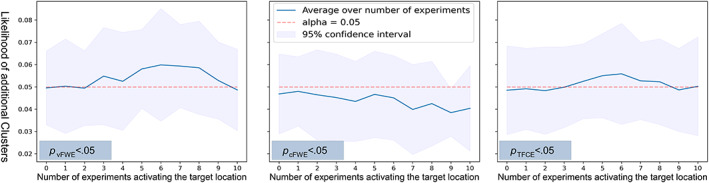
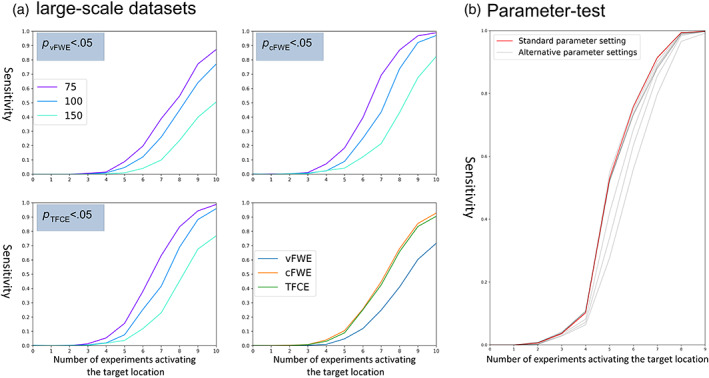
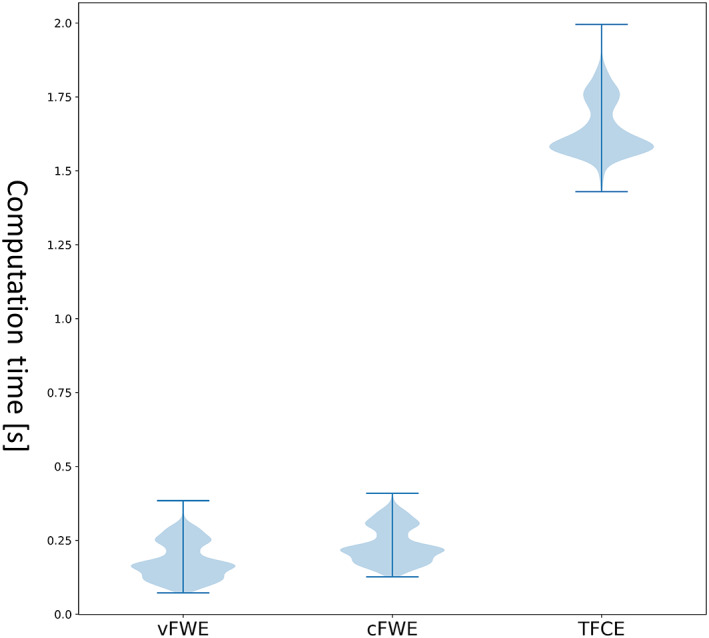
In recent neuroimaging studies, threshold-free cluster enhancement (TFCE) gained popularity as a sophisticated thresholding method for statistical inference. It was shown to feature higher sensitivity than the frequently used approach of controlling the cluster-level family-wise error (cFWE) and it does not require setting a cluster-forming threshold at voxel level. Here, we examined the applicability of TFCE to a widely used method for coordinate-based neuroimaging meta-analysis, Activation Likelihood Estimation (ALE), by means of large-scale simulations. We created over 200,000 artificial meta-analysis datasets by independently varying the total number of experiments included and the amount of spatial convergence across experiments. Next, we applied ALE to all datasets and compared the performance of TFCE to both voxel-level and cluster-level FWE correction approaches. All three multiple-comparison correction methods yielded valid results, with only about 5% of the significant clusters being based on spurious convergence, which corresponds to the nominal level the methods were controlling for. On average, TFCE's sensitivity was comparable to that of cFWE correction, but it was slightly worse for a subset of parameter combinations, even after TFCE parameter optimization. cFWE yielded the largest significant clusters, closely followed by TFCE, while voxel-level FWE correction yielded substantially smaller clusters, showcasing its high spatial specificity. Given that TFCE does not outperform the standard cFWE correction but is computationally much more expensive, we conclude that employing TFCE for ALE cannot be recommended to the general user.
Keywords: FWE; family-wise error; multiple comparison correction; neuroimaging meta-analysis; significance thresholding; threshold-free cluster enhancement cluster extent.
© 2022 The Authors. Human Brain Mapping published by Wiley Periodicals LLC.
Conflict of interest statement
The authors declare no potential conflict of interest.
Figures

Similar articles
-
Behavior, sensitivity, and power of activation likelihood estimation characterized by massive empirical simulation.Neuroimage. 2016 Aug 15;137:70-85. doi: 10.1016/j.neuroimage.2016.04.072. Epub 2016 May 11. Neuroimage. 2016. PMID: 27179606 Free PMC article.
-
Threshold-free cluster enhancement: addressing problems of smoothing, threshold dependence and localisation in cluster inference.Neuroimage. 2009 Jan 1;44(1):83-98. doi: 10.1016/j.neuroimage.2008.03.061. Epub 2008 Apr 11. Neuroimage. 2009. PMID: 18501637
-
Probabilistic TFCE: A generalized combination of cluster size and voxel intensity to increase statistical power.Neuroimage. 2019 Jan 15;185:12-26. doi: 10.1016/j.neuroimage.2018.09.078. Epub 2018 Oct 6. Neuroimage. 2019. PMID: 30296561 Free PMC article.
-
Trends in the sample size, statistics, and contributions to the BrainMap database of activation likelihood estimation meta-analyses: An empirical study of 10-year data.Hum Brain Mapp. 2023 Apr 1;44(5):1876-1887. doi: 10.1002/hbm.26177. Epub 2022 Dec 8. Hum Brain Mapp. 2023. PMID: 36479854 Free PMC article. Review.
-
A quantitative meta-analysis of fMRI studies investigating emotional processing in excessive worriers: Application of activation likelihood estimation analysis.J Affect Disord. 2019 Jan 15;243:348-359. doi: 10.1016/j.jad.2018.09.049. Epub 2018 Sep 17. J Affect Disord. 2019. PMID: 30266026 Review.
Cited by
-
Consistent activation differences versus differences in consistent activation: Evaluating meta-analytic contrasts.Imaging Neurosci (Camb). 2024 Nov 8;2:imag-2-00358. doi: 10.1162/imag_a_00358. eCollection 2024. Imaging Neurosci (Camb). 2024. PMID: 40800475 Free PMC article.
-
Predictive modeling of significance thresholding in activation likelihood estimation meta-analysis.Imaging Neurosci (Camb). 2025 Jan 10;3:imag_a_00423. doi: 10.1162/imag_a_00423. eCollection 2025. Imaging Neurosci (Camb). 2025. PMID: 40800822 Free PMC article.
-
Distinct neural networks of task engagement and choice response in moral, risky, and ambiguous decision-making: An ALE meta-analysis.Imaging Neurosci (Camb). 2024 Aug 30;2:imag-2-00277. doi: 10.1162/imag_a_00277. eCollection 2024. Imaging Neurosci (Camb). 2024. PMID: 40800307 Free PMC article.
-
Exploration of brain imaging biomarkers in subthreshold depression patients across different ages: an ALE meta-analysis based on MRI studies.BMC Psychiatry. 2025 Mar 3;25(1):191. doi: 10.1186/s12888-025-06495-y. BMC Psychiatry. 2025. PMID: 40033236 Free PMC article.
-
Convergent abnormality in the subgenual anterior cingulate cortex in insomnia disorder: A revisited neuroimaging meta-analysis of 39 studies.Sleep Med Rev. 2023 Oct;71:101821. doi: 10.1016/j.smrv.2023.101821. Epub 2023 Jul 15. Sleep Med Rev. 2023. PMID: 37481961 Free PMC article. Review.
References
-
- Baker, M. (2016). 1,500 scientists lift the lid on reproducibility. Nature News, 533(7604), 452–454. - PubMed
-
- Bossier, H. , Roels, S. P. , Seurinck, R. , Banaschewski, T. , Barker, G. J. , Bokde, A. L. , Quinlan, E. B. , Desrivières, S. , Flor, H. , & Grigis, A. (2020). The empirical replicability of task‐based fMRI as a function of sample size. NeuroImage, 212, 116601. - PubMed
-
- Botvinik‐Nezer, R. , Holzmeister, F. , Camerer, C. F. , Dreber, A. , Huber, J. , Johannesson, M. , Kirchler, M. , Iwanir, R. , Mumford, J. A. , Adcock, R. A. , Avesani, P. , Baczkowski, B. M. , Bajracharya, A. , Bakst, L. , Ball, S. , Barilari, M. , Bault, N. , Beaton, D. , Beitner, J. , … Schonberg, T. (2020). Variability in the analysis of a single neuroimaging dataset by many teams. Nature, 582(7810), 84–88. - PMC - PubMed
Publication types
MeSH terms
Grants and funding
LinkOut - more resources
Full Text Sources
