

Rainfall anomalies and typhoid fever in Blantyre, Malawi
- PMID: 35535751
- PMCID: PMC9254155
- DOI: 10.1017/S0950268822000759
Rainfall anomalies and typhoid fever in Blantyre, Malawi
Abstract
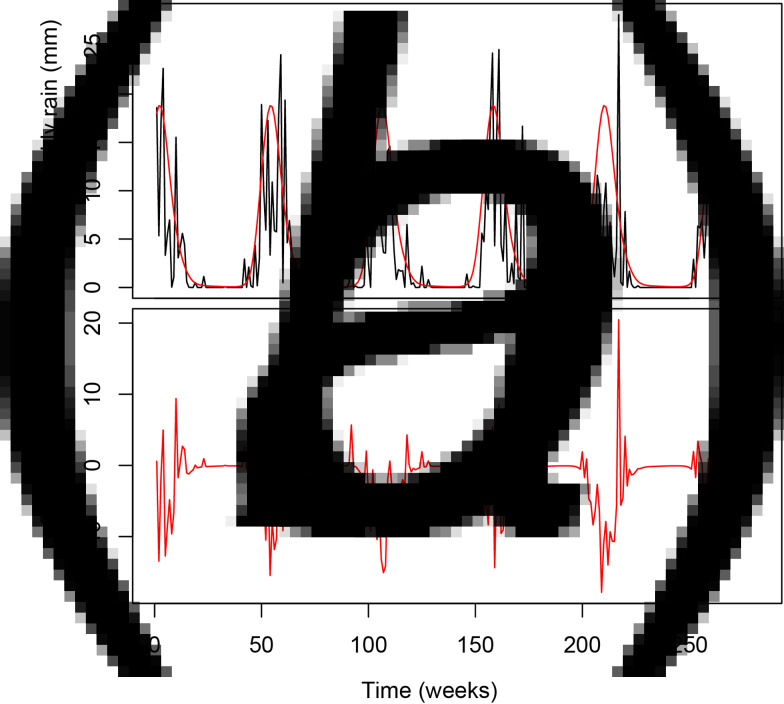
Typhoid fever is a major cause of illness and mortality in low- and middle-income settings. We investigated the association of typhoid fever and rainfall in Blantyre, Malawi, where multi-drug-resistant typhoid has been transmitting since 2011. Peak rainfall preceded the peak in typhoid fever by approximately 15 weeks [95% confidence interval (CI) 13.3, 17.7], indicating no direct biological link. A quasi-Poisson generalised linear modelling framework was used to explore the relationship between rainfall and typhoid incidence at biologically plausible lags of 1-4 weeks. We found a protective effect of rainfall anomalies on typhoid fever, at a two-week lag (P = 0.006), where a 10 mm lower-than-expected rainfall anomaly was associated with up to a 16% reduction in cases (95% CI 7.6, 26.5). Extreme flooding events may cleanse the environment of S. Typhi, while unusually low rainfall may reduce exposure from sewage overflow. These results add to evidence that rainfall anomalies may play a role in the transmission of enteric pathogens, and can help direct future water and sanitation intervention strategies for the control of typhoid fever.
Keywords: Typhoid fever; rainfall; statistical analysis; weather.
Conflict of interest statement
The authors have no commercial interests and declare no conflicts of interest.
Figures


References
-
- Moore B (1951) The detection of enteric carriers in towns by means of sewage examination. Journal Royal Sanitary Institute (Great Britain) 71, 57–60. - PubMed
-
- Shuval HI (1993) Investigation of typhoid fever and cholera transmission by raw wastewater irrigation in Santiago, Chile. Water Science and Technology 27, 167–174.
Publication types
MeSH terms
Grants and funding
LinkOut - more resources
Full Text Sources
