

Machine Learning on DNA-Encoded Library Count Data Using an Uncertainty-Aware Probabilistic Loss Function
- PMID: 35535861
- PMCID: PMC10830332
- DOI: 10.1021/acs.jcim.2c00041
Machine Learning on DNA-Encoded Library Count Data Using an Uncertainty-Aware Probabilistic Loss Function
Abstract
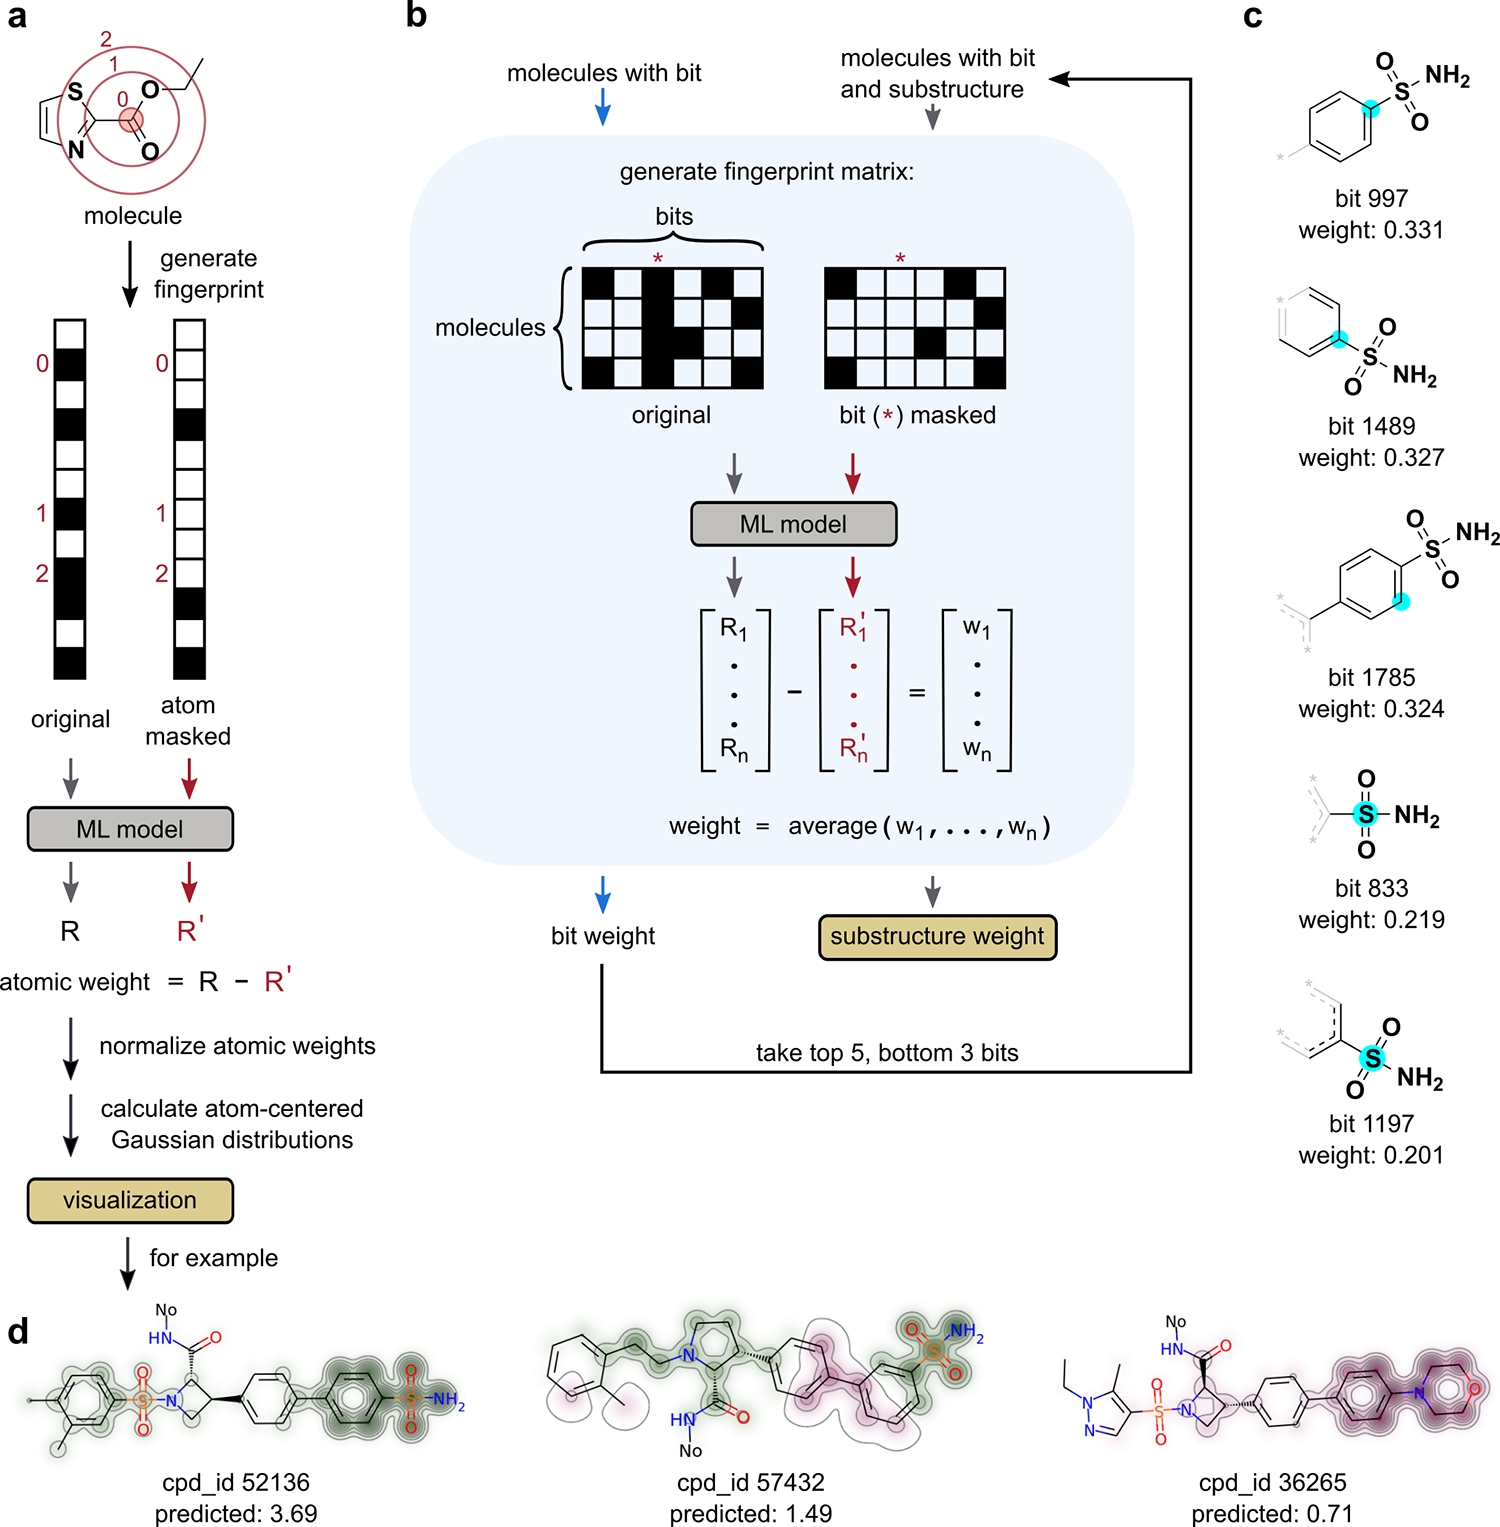
DNA-encoded library (DEL) screening and quantitative structure-activity relationship (QSAR) modeling are two techniques used in drug discovery to find novel small molecules that bind a protein target. Applying QSAR modeling to DEL selection data can facilitate the selection of compounds for off-DNA synthesis and evaluation. Such a combined approach has been done recently by training binary classifiers to learn DEL enrichments of aggregated "disynthons" in order to accommodate the sparse and noisy nature of DEL data. However, a binary classification model cannot distinguish between different levels of enrichment, and information is potentially lost during disynthon aggregation. Here, we demonstrate a regression approach to learning DEL enrichments of individual molecules, using a custom negative-log-likelihood loss function that effectively denoises DEL data and introduces opportunities for visualization of learned structure-activity relationships. Our approach explicitly models the Poisson statistics of the sequencing process used in the DEL experimental workflow under a frequentist view. We illustrate this approach on a DEL dataset of 108,528 compounds screened against carbonic anhydrase (CAIX), and a dataset of 5,655,000 compounds screened against soluble epoxide hydrolase (sEH) and SIRT2. Due to the treatment of uncertainty in the data through the negative-log-likelihood loss used during training, the models can ignore low-confidence outliers. While our approach does not demonstrate a benefit for extrapolation to novel structures, we expect our denoising and visualization pipeline to be useful in identifying structure-activity trends and highly enriched pharmacophores in DEL data. Further, this approach to uncertainty-aware regression modeling is applicable to other sparse or noisy datasets where the nature of stochasticity is known or can be modeled; in particular, the Poisson enrichment ratio metric we use can apply to other settings that compare sequencing count data between two experimental conditions.
Figures


Similar articles
-
Building Block-Based Binding Predictions for DNA-Encoded Libraries.J Chem Inf Model. 2023 Aug 28;63(16):5120-5132. doi: 10.1021/acs.jcim.3c00588. Epub 2023 Aug 14. J Chem Inf Model. 2023. PMID: 37578123 Free PMC article.
-
Machine-Learning-Based Data Analysis Method for Cell-Based Selection of DNA-Encoded Libraries.ACS Omega. 2023 May 15;8(21):19057-19071. doi: 10.1021/acsomega.3c02152. eCollection 2023 May 30. ACS Omega. 2023. PMID: 37273617 Free PMC article.
-
Machine Learning on DNA-Encoded Libraries: A New Paradigm for Hit Finding.J Med Chem. 2020 Aug 27;63(16):8857-8866. doi: 10.1021/acs.jmedchem.0c00452. Epub 2020 Jun 11. J Med Chem. 2020. PMID: 32525674
-
Challenges and Prospects of DNA-Encoded Library Data Interpretation.Chem Rev. 2024 Nov 27;124(22):12551-12572. doi: 10.1021/acs.chemrev.4c00284. Epub 2024 Nov 7. Chem Rev. 2024. PMID: 39508428 Review.
-
Small-molecule discovery through DNA-encoded libraries.Nat Rev Drug Discov. 2023 Sep;22(9):699-722. doi: 10.1038/s41573-023-00713-6. Epub 2023 Jun 16. Nat Rev Drug Discov. 2023. PMID: 37328653 Free PMC article. Review.
Cited by
-
Deep Learning Approach for the Discovery of Tumor-Targeting Small Organic Ligands from DNA-Encoded Chemical Libraries.ACS Omega. 2023 Jul 6;8(28):25090-25100. doi: 10.1021/acsomega.3c01775. eCollection 2023 Jul 18. ACS Omega. 2023. PMID: 37483198 Free PMC article.
-
DNA-encoded library-enabled discovery of proximity-inducing small molecules.Nat Chem Biol. 2024 Feb;20(2):170-179. doi: 10.1038/s41589-023-01458-4. Epub 2023 Nov 2. Nat Chem Biol. 2024. PMID: 37919549 Free PMC article.
-
Translating the Genome into Drugs.Acc Chem Res. 2023 Feb 21;56(4):489-499. doi: 10.1021/acs.accounts.2c00791. Epub 2023 Feb 9. Acc Chem Res. 2023. PMID: 36757774 Free PMC article.
-
Rational Screening for Cooperativity in Small-Molecule Inducers of Protein-Protein Associations.J Am Chem Soc. 2023 Oct 25;145(42):23281-23291. doi: 10.1021/jacs.3c08307. Epub 2023 Oct 10. J Am Chem Soc. 2023. PMID: 37816014 Free PMC article.
-
Machine learning in preclinical drug discovery.Nat Chem Biol. 2024 Aug;20(8):960-973. doi: 10.1038/s41589-024-01679-1. Epub 2024 Jul 19. Nat Chem Biol. 2024. PMID: 39030362 Review.
References
-
- Imming P; Sinning C; Meyer A Drugs, their targets and the nature and number of drug targets. Nat. Rev. Drug Discovery 2006, 5, 821–834. - PubMed
-
- Clark MA; Acharya RA; Arico-Muendel CC; Belyanskaya SL; Benjamin DR; Carlson NR; Centrella PA; Chiu CH; Creaser SP; Cuozzo JW; Davie CP; Ding Y; Franklin GJ; Franzen KD; Gefter ML; Hale SP; Hansen NJV; Israel DI; Jiang J; Kavarana MJ; Kelley MS; Kollmann CS; Li F; Lind K; Mataruse S; Medeiros PF; Messer JA; Myers P; O’Keefe H; Oliff MC; Rise CE; Satz AL; Skinner SR; Svendsen JL; Tang L; van Vloten K; Wagner RW; Yao G; Zhao B; Morgan BA Design, synthesis and selection of DNA-encoded small-molecule libraries. Nat. Chem. Biol. 2009, 5, 647–654. - PubMed
-
- Goodnow RA; Dumelin CE; Keefe AD DNA-encoded chemistry: enabling the deeper sampling of chemical space. Nat. Rev. Drug Discovery 2017, 16, 131–147. - PubMed
Publication types
MeSH terms
Substances
Grants and funding
LinkOut - more resources
Full Text Sources
Other Literature Sources
