. 2022 May 10:11:e75636.
doi: 10.7554/eLife.75636.

Repressing PTBP1 fails to convert reactive astrocytes to dopaminergic neurons in a 6-hydroxydopamine mouse model of Parkinson's disease

Affiliations

Repressing PTBP1 fails to convert reactive astrocytes to dopaminergic neurons in a 6-hydroxydopamine mouse model of Parkinson's disease

Weizhao Chen et al. Elife. .

Abstract

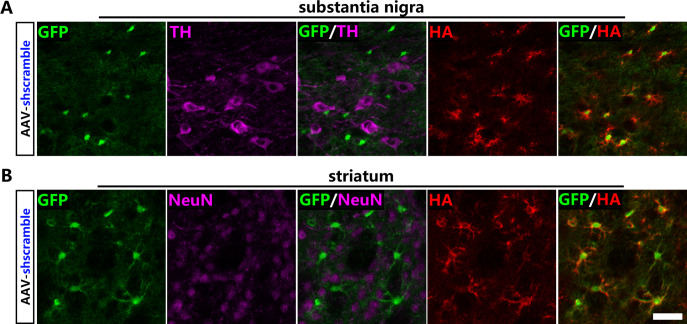
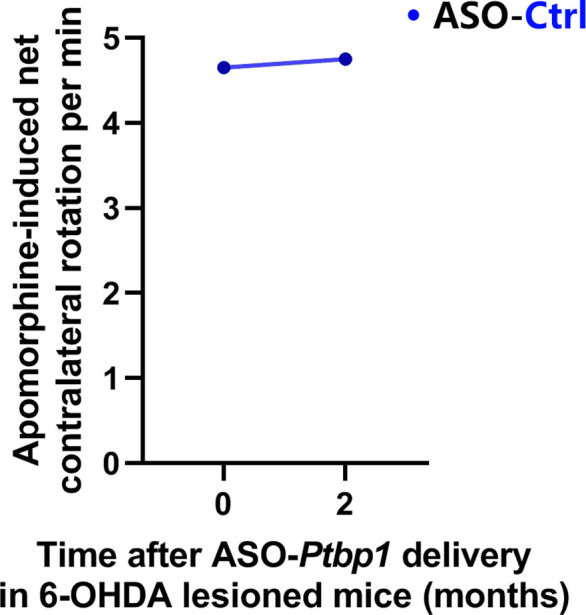
Lineage reprogramming of resident glial cells to dopaminergic neurons (DAns) is an attractive prospect of the cell-replacement therapy for Parkinson's disease (PD). However, it is unclear whether repressing polypyrimidine tract binding protein 1 (PTBP1) could efficiently convert astrocyte to DAns in the substantia nigra and striatum. Although reporter-positive DAns were observed in both groups after delivering the adeno-associated virus (AAV) expressing a reporter with shRNA or CRISPR-CasRx to repress astroglial PTBP1, the possibility of AAV leaking into endogenous DAns could not be excluded without using a reliable lineage-tracing method. By adopting stringent lineage-tracing strategy, two other studies show that either knockdown or genetic deletion of quiescent astroglial PTBP1 fails to obtain induced DAns under physiological condition. However, the role of reactive astrocytes might be underestimated because upon brain injury, reactive astrocyte can acquire certain stem cell hallmarks that may facilitate the lineage conversion process. Therefore, whether reactive astrocytes could be genuinely converted to DAns after PTBP1 repression in a PD model needs further validation. In this study, we used Aldh1l1-CreERT2-mediated specific astrocyte-lineage-tracing method to investigate whether reactive astrocytes could be converted to DAns in a 6-hydroxydopamine (6-OHDA) mouse model of PD. However, we found that no astrocyte-originated DAn was generated after effective and persistent knockdown of astroglial PTBP1 either in the substantia nigra or in striatum, while AAV 'leakage' to nearby neurons was easily observed. Our results confirm that repressing PTBP1 does not convert astrocytes to DAns, regardless of physiological or PD-related pathological conditions.

Keywords: 6-OHDA model; PTBP1; Parkinson's disease; astrocyte; astrocyte-to-neuron conversion; lineage reprogramming; mouse; neuroscience; regenerative medicine; stem cells.


Conflict of interest statement

WC, QZ, QH, SM, ML No competing interests declared

Figures

Figure 1.
Figure 1.. Viral-reporter-labeled neurons including dopaminergic neurons are induced in the substantia nigra and striatum after adeno-associated virus (AAV)-shPtbp1 delivery.
(A) Schematic of AAV-shPtbp1 and AAV-shscramble vector design and the experimental design. (B) Representative images of brain slices co-stained with polypyrimidine tract binding protein 1 (PTBP1) (red) and GFP (green) at indicated timepoints after AAV-shPtbp1 or AAV-shscramble delivery in the substantia nigra. Scale bar, 50 μm. (C) Quantitative data of GFP+PTBP1+ cells ratio from (B) are shown. Representative images of brain slices co-stained GFP (green) with tyrosine hydroxylase (TH; purple) or NeuN (red) at indicated timepoints after AAV-shPtbp1 or AAV-shscramble delivery in the substantia nigra (D) and striatum (F), the enlarged 3D reconstruction of boxed individual neurons are shown in the lower panel (counterstained with Hoechst–blue). Scale bars: low magnification, 75 μm; high magnification, 10 μm. Quantitative data of GFP+NeuN+ or GFP+NeuN+ cells ratio from the substantia nigra (D) and striatum (F) are shown in (E) and (G). n = 3 biological repeats per group. Data are presented as mean ± SEM. * indicates a significant difference between AAV-shPtbp1 and AAV-shscramble (p<0.05). Two-way ANOVA followed by Tukey’s multiple comparisons test is used. (C) F(2,12) = 5.297, 1 M: p<0.0001; 2 M: p<0.0001; 3 M: p<0.0001. (E) F(2,12) = 5.321, 1 M: p=0.5220; 2 M: p=0.0016; 3 M: p=0.0007. (G) F(2,12) = 1.132, 1 M: p=0.0004; 2 M: p=0.0006; 3 M: p=0.0085.
Figure 1—figure supplement 1.
Figure 1—figure supplement 1.. Adeno-associated virus (AAV)-shPtbp1 and AAV-shscramble predominantly infected astrocyte at early timepoint (7dpi).
(A) Representative images of brain slices co-stained with GFP (green) and AldoC (purple), NeuN (red), NG2(purple), or Iba-1(red) 7 days after AAV-shPtbp1 or AAV-shscramble delivery in the substantia nigra or striatum. Scale bar, 75 μm. (B) Ratio of GFP+ cells in the substantia nigra and striatum that shows positive staining for AldoC, NeuN, NG2, or Iba-1. n = 3 biological repeats per group. Data are presented as mean ± SEM. * indicates a significant difference (p<0.05). Two-way ANOVA (Turkey’s) is used. In the substantia nigra, F(3, 16) = 6.285. AAV-shscramble: AldoC vs NeuN, p<0.0001; AldoC vs NG2, p<0.0001; AldoC vs Iba-1, p<0.0001; AAV-shPtbp1: AldoC vs NeuN, p<0.0001; AldoC vs NG2, p<0.0001; AldoC vs Iba-1, p<0.0001. In the striatum, F(3, 16) = 0.000. AAV-shscramble: AldoC vs NeuN, p<0.0001; AldoC vs NG2, p<0.0001; AldoC vs Iba-1, p<0.0001; AAV-shPtbp1: AldoC vs NeuN, p<0.0001; AldoC vs NG2, p<0.0001; AldoC vs Iba-1, p<0.0001.
Figure 2.
Figure 2.. No viral-reporter-labeled neuron including dopaminergic neuron is derived from quiescent astrocytes AAV-shPtbp1 delivery.
(A) Schematic of breeding strategy of Aldh1l1-CreERT2;Rpl22lsl-HA lineage-tracing mice. (B) Experimental design of Tamoxifen (TAM) induction and representative images of the substantia nigra or striatum of Aldh1l1-CreERT2;Rpl22lsl-HA mice co-stained hemagglutinin (HA) (red) with pan-astrocyte marker AldoC (green) and tyrosine hydroxylase (TH) (purple) 2 weeks after TAM administration. Scale bar, 100 μm. (C) Schematic of experimental design. Representative images of brain slices co-stained GFP (green), HA (red) with TH (purple) in the substantia nigra (D) or with NeuN (purple) in striatum (E) 3 months after AAV-shPtbp1 delivery. n = 3 biological repeats per group. Arrows indicate GFP/TH (D) or GFP/NeuN (E) double positive neurons that are HA negative. Scale bar, 75 μm.
Figure 2—figure supplement 1.
Figure 2—figure supplement 1.. Representative images of brain slices co-stained GFP (green), hemagglutinin (HA; red) with tyrosine hydroxylase (TH; purple) in the substantia nigra (A) or with NeuN (purple) in striatum (B) 3 months after adeno-associated virus (AAV)-shscramble delivery.
n = 2 biological repeats per group. Scale bar, 75 μm.
Figure 3.
Figure 3.. No neuron including dopaminergic neuron (DAn) is derived from reactive astrocytes in 6-hydroxydopamine (6-OHDA) model after polypyrimidine tract binding protein 1 (PTBP1) repression.
(A) Schematic of experimental design. (B) Representative images of the substantia nigra or striatum after 6-OHDA lesion co-stained with tyrosine hydroxylase (TH; green) and GFAP (red). Scale bar, 200 μm for the substantia nigra and 50 μm for the striatum. (C) Representative images of brain slices of Aldh1l1-CreERT2;Rpl22lsl-HA mice subjected to 6-OHDA lesion and adeno-associated virus (AAV)-shPtbp1 or AAV-shscramble injection in substantia (upper panel) and striatum (lower panel), co-stained with GFP (cyan), hemagglutinin (HA; red) and NeuN (green) or TH(green). Scale bar, 50 μm. Number of NeuN+ neurons (D) and TH+ DAns (E) in the substantia nigra 3 months after treatment with AAV-shPtbp1 or AAV-shscramble on 6-OHDA lesioned mice. n = 5 mice for AAV-shscramble group; n = 8 mice for AAV-shPtbp1 group. (F) Apomorphine-induced rotation test before and 3 months after AAV-shPtbp1 or AAV-shscramble delivery on 6-OHDA lesioned mice. n = 8 mice for AAV-shPtbp1 group; n = 5 mice for AAV-shscramble group. Data are presented as mean ± SEM. Unpaired t test is used in (D) F(4, 7) = 3.266, p=0.4627 and (E) F(4, 7) = 3.856 p=0.5534. Unpaired t test is used in (F) 0 M AAV-shPtbp1 vs AAV-shscramble F(7, 4) = 3.59, p=0.3669; 3 M AAV-shPtbp1 vs AAV-shscramble F(7, 4) = 2.157, p=0.7915. Paired t test is used in (F), AAV-shscramble 3 M vs 0 M: p=0.0489, df = 4; AAV-shPtbp1 3 M vs 0 M: p=0.068, df = 7.
Figure 4.
Figure 4.. No neuron including dopaminergic neuron is derived from astrocytes with or without 6-hydroxydopamine (6-OHDA) lesion after antisense oligonucleotide (ASO)-mediated polypyrimidine tract binding protein 1 (PTBP1) repression.
(A) Schematic of experimental design. (B) Representative images of the brain slices of Aldh1l1-CreERT2;Rosa26lsl-YFP mice co-stained with YFP (green) and NeuN (red) or tyrosine hydroxylase (TH; purple) after ASO-Ptbp1 or ASO-Ctrl delivery in the substantia nigra. Scale bar, 75 μm. n = 6 mice for ASO-Ctrl group; n = 5 mice for ASO-Ptbp1 group. (C) Schematic of experimental design. (D) Representative images of brain slices of 6-OHDA lesioned Aldh1l1-CreERT2;Rpl22lsl-HA mice after ASO-Ptbp1 delivery in substantia nigra, co-stained with hemagglutinin (HA; green) and NeuN (red) or TH (purple). Scale bar, 75 μm. n = 2 mice for ASO-Ctrl group; n = 3 mice for ASO-Ptbp1 group. (E) Apomorphine-induced rotation test before and 2 months after ASO-Ptbp1 delivery in substantia nigra on 6-OHDA lesioned mice (n = 3 biological repeats). Data are presented as mean ± SEM. Paired t test is used in (E), p=0.1435, df = 2.
Figure 4—figure supplement 1.
Figure 4—figure supplement 1.. Knockdown efficiency of PTBP1 by ASO.
(A) In vivo knockdown efficiency of antisense oligonucleotide (ASO) by immunofluorescence. Representative images of the brain slices of Aldh1l1-CreERT2;Rosa26lsl-YFP mice co-stained with polypyrimidine tract binding protein 1 (PTBP1; purple), YFP (green), and Cy3 (red) after ASO-Ptbp1 or ASO-Ctrl delivery in the substantia nigra. n = 3 mice for ASO-Ctrl group; n = 5 mice for ASO-Ptbp1 group. Scale bar, 75 μm. (B) Quantitative data of relative PTBP1 intensity from (A) are shown. Unpaired t test is used. p<0.0001, F(2, 4) = 2.868. (C) In vivo knockdown efficiency of ASO by western blot, normalized against β-actin in mouse midbrain delivered with ASO-Ptbp1 or ASO-Ctrl (n = 3 biological repeats, respectively). (D) Quantitative data of relative PTBP1/β-actin ratio from (C) are shown. Unpaired t test is used. p=0.016, F(2, 2) = 6.268.
Figure 4—figure supplement 2.
Figure 4—figure supplement 2.. Apomorphine-induced rotation test before and 2 months after antisense oligonucleotide (ASO)-Ctrl delivery in substantia nigra on 6-hydroxydopamine lesioned mice (n = 1 biological repeat).

Comment in

  • doi: 10.7554/eLife.80232

References

    1. Arenas E. Method to combat Parkinson’s disease by astrocyte-to-neuron conversion. Nature. 2020;582:489–490. doi: 10.1038/d41586-020-01817-4. - DOI - PubMed
    1. Belenguer G, Duart-Abadia P, Jordán-Pla A, Domingo-Muelas A, Blasco-Chamarro L, Ferrón SR, Morante-Redolat JM, Fariñas I. Adult Neural Stem Cells Are Alerted by Systemic Inflammation through TNF-α Receptor Signaling. Cell Stem Cell. 2021;28:285–299. doi: 10.1016/j.stem.2020.10.016. - DOI - PubMed
    1. Blackshaw S, Hoang T, Kim DW, Appel H, Pannullo N, Ozawa M, Zheng S, Yu M, Peachey N, Kim J. Ptbp1 Deletion Does Not Induce Glia-to-Neuron Conversion in Adult Mouse Retina and Brain. bioRxiv. 2021 doi: 10.1101/2021.10.04.462784. - DOI - PubMed
    1. Brulet R, Matsuda T, Zhang L, Miranda C, Giacca M, Kaspar BK, Nakashima K, Hsieh J. NEUROD1 Instructs Neuronal Conversion in Non-Reactive Astrocytes. Stem Cell Reports. 2017;8:1506–1515. doi: 10.1016/j.stemcr.2017.04.013. - DOI - PMC - PubMed
    1. Buffo A, Vosko MR, Ertürk D, Hamann GF, Jucker M, Rowitch D, Götz M. Expression pattern of the transcription factor Olig2 in response to brain injuries: implications for neuronal repair. PNAS. 2005;102:18183–18188. doi: 10.1073/pnas.0506535102. - DOI - PMC - PubMed

Publication types

MeSH terms

Substances

LinkOut - more resources