. 2022 Jun 28;13(3):e0103422.
doi: 10.1128/mbio.01034-22. Epub 2022 May 10.

Activities and Structure-Function Analysis of Fission Yeast Inositol Pyrophosphate (IPP) Kinase-Pyrophosphatase Asp1 and Its Impact on Regulation of pho1 Gene Expression

Affiliations

Activities and Structure-Function Analysis of Fission Yeast Inositol Pyrophosphate (IPP) Kinase-Pyrophosphatase Asp1 and Its Impact on Regulation of pho1 Gene Expression

Bradley Benjamin et al. mBio. .

Abstract

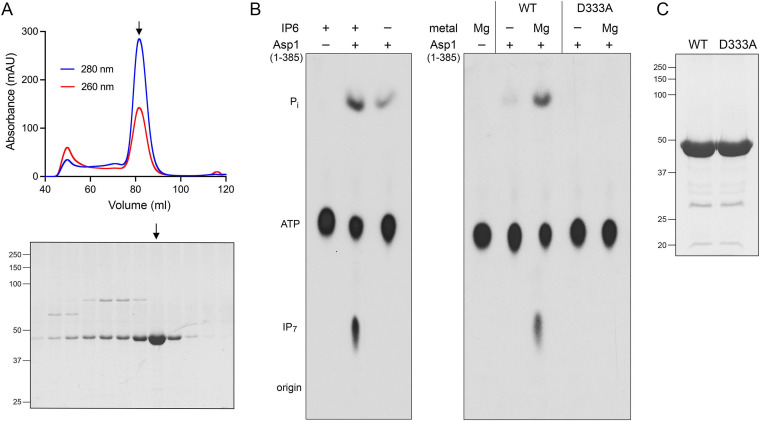
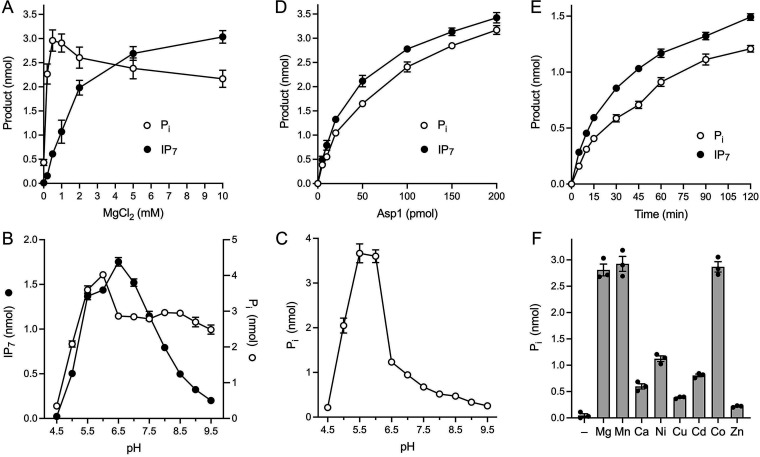
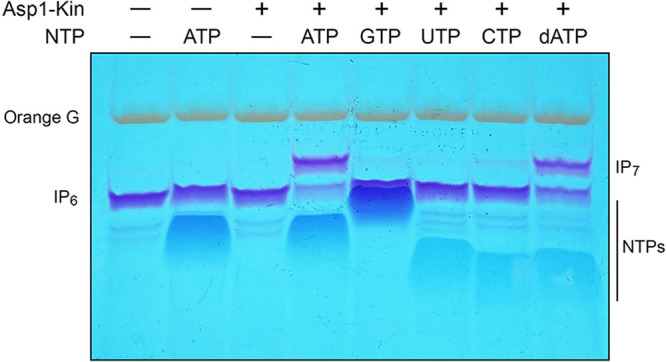
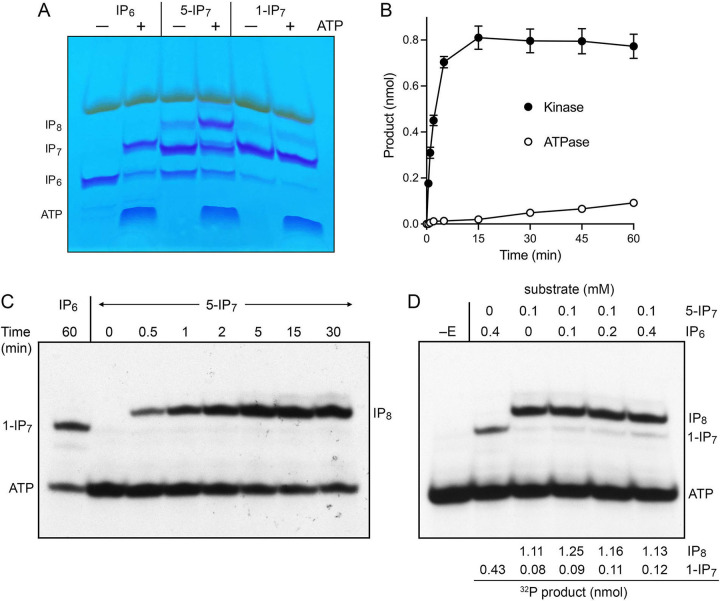
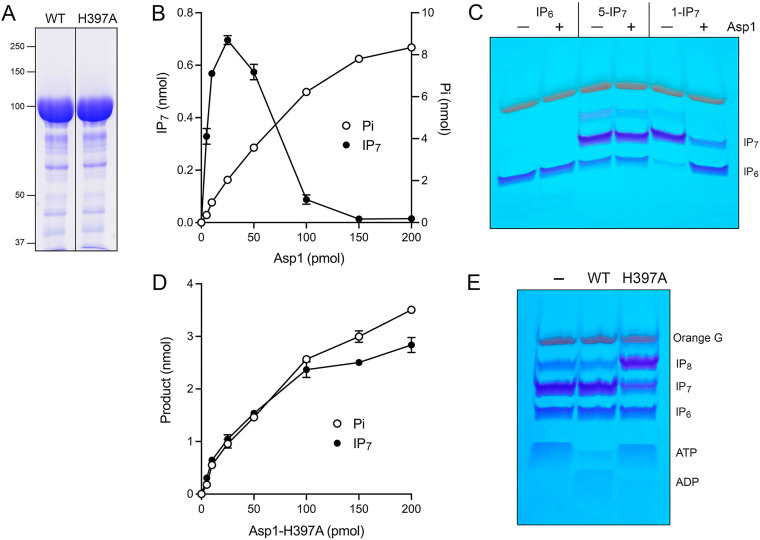
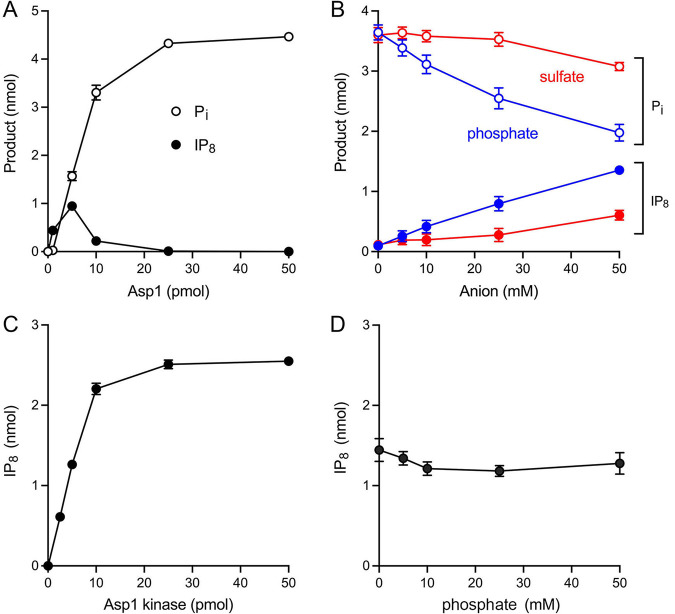
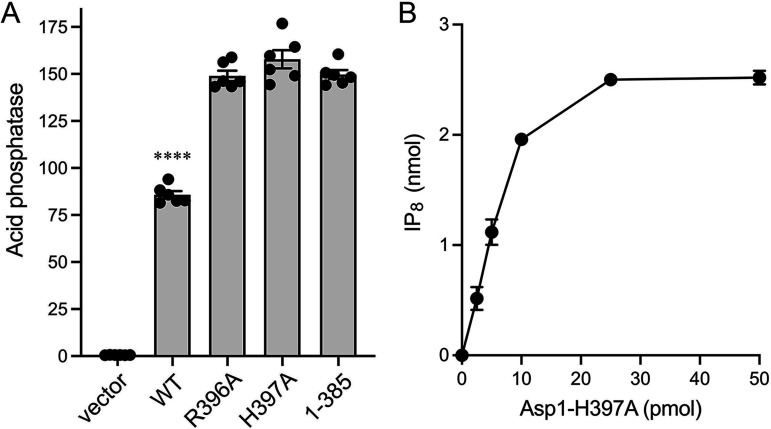
Inositol pyrophosphates (IPPs) are signaling molecules that regulate cellular phosphate homeostasis in diverse eukaryal taxa. In fission yeast, mutations that increase 1,5-IP8 derepress the PHO regulon while mutations that ablate IP8 synthesis are PHO hyper-repressive. Fission yeast Asp1, the principal agent of 1,5-IP8 dynamics, is a bifunctional enzyme composed of an N-terminal IPP kinase domain and a C-terminal IPP pyrophosphatase domain. Here we conducted a biochemical characterization and mutational analysis of the autonomous Asp1 kinase domain (aa 1-385). Reaction of Asp1 kinase with IP6 and ATP resulted in both IP6 phosphorylation to 1-IP7 and hydrolysis of the ATP γ-phosphate, with near-equal partitioning between productive 1-IP7 synthesis and unproductive ATP hydrolysis under optimal kinase conditions. By contrast, reaction of Asp1 kinase with 5-IP7 is 22-fold faster than with IP6 and is strongly biased in favor of IP8 synthesis versus ATP hydrolysis. Alanine scanning identified essential constituents of the active site. We deployed the Ala mutants to show that derepression of pho1 expression correlated with Asp1's kinase activity. In the case of full-length Asp1, the activity of the C-terminal pyrophosphatase domain stifled net phosphorylation of the 1-position during reaction of Asp1 with ATP and either IP6 or 5-IP7. We report that inorganic phosphate is a concentration-dependent enabler of net IP8 synthesis by full-length Asp1 in vitro, by virtue of its antagonism of IP8 turnover. IMPORTANCE Expression of the fission yeast phosphate regulon is sensitive to the intracellular level of the inositol pyrophosphate (IPP) signaling molecule 1,5-IP8. IP8 dynamics are determined by Asp1, a bifunctional enzyme comprising N-terminal IPP 1-kinase and C-terminal IPP 1-pyrophosphatase domains that catalyze IP8 synthesis and catabolism, respectively. Here, we interrogated the activities and specificities of the Asp1 kinase domain and full length Asp1. We find that reaction of Asp1 kinase with 5-IP7 is 22-fold faster than with IP6 and is strongly biased in favor of IP8 synthesis versus the significant unproductive ATP hydrolysis seen during its reaction with IP6. We report that full-length Asp1 catalyzes futile cycles of 1-phosphate phosphorylation by its kinase component and 1-pyrophosphate hydrolysis by its pyrophosphatase component that result in unproductive net consumption of the ATP substrate. Net synthesis of 1,5-IP8 is enabled by physiological concentrations of inorganic phosphate that selectively antagonize IP8 turnover.

Keywords: Asp1; fission yeast; inositol polyphosphate kinase; inositol pyrophosphates.


Conflict of interest statement

The authors declare no conflict of interest.

Figures

FIG 1
FIG 1
IP6 kinase and ATP phosphohydrolase activity of recombinant Asp1-(1-385). (A) Elution profile of wild-type Asp1-(1-385) during Superdex-200 gel filtration. The top panel shows the absorbance at 280 nm (blue trace) and 260 nm (red trace) as a function of elution volume. The A260 > A280 peak at 50 mL demarcates the void volume. Aliquots (5 μL) of the fractions spanning and flanking the A280 peak were analyzed by SDS-PAGE. The Coomassie blue-stained gel is shown. The positions and sizes (kDa) of marker proteins are indicated on the left. The fraction corresponding to the A280 peak containing purified Asp1-(1-385) is indicated by the vertical arrow. (B) Reaction mixtures (20 μL) containing 30 mM HEPES-NaOH (pH 6.8), 50 mM NaCl, 10 mM MgCl2, 0.5 mM [γ32P]ATP, 1 mM IP6, and 2.5 μM Asp1 kinase were incubated at 37°C for 90 min. Individual reaction components were omitted where indicated by –. The products were resolved by PEI cellulose TLC and visualized by autoradiography. The chromatographic origin and the 32P-labeled species corresponding to ATP, IP7, and Pi are indicated on the left. (C) Aliquots (10 μg) of the peak Superdex-200 fractions of wild-type and D333A mutant Asp1 kinase preparations were analyzed by SDS-PAGE. The Coomassie blue-stained gel is shown with the positions and sizes (kDa) of marker proteins indicated on the left.
FIG 2
FIG 2
Characterization of the Asp1 IP6 kinase and ATPase activities. (A) Magnesium titration. Reaction mixtures (20 μL) containing 30 mM Bis-Tris (pH 6.2), 50 mM NaCl, 0.5 mM (10 nmol) [γ32P]ATP, 1 mM (20 nmol) IP6, 5 μM (100 pmol) Asp1-(1-385), and magnesium as specified were incubated at 37°C for 90 min. The extents of IP7 and Pi formation are plotted as a function of magnesium concentration. (B) pH profile. Reaction mixtures (20 μL) containing 30 mM Tris buffer (either Tris-acetate at pH 4.5, 5.0, 5.5, or 6.0; Tris-HCl at pH 6.5, 7.0, 7.5, 8.0, 8.5, 9.0, or 9.5), 50 mM NaCl, 2 mM MgCl2, 0.5 mM (10 nmol) [γ32P]ATP, 1 mM (20 nmol) IP6, and 5 μM (100 pmol) Asp1-(1-385) were incubated at 37°C for 90 min. The extents of IP7 and Pi formation are plotted as a function of pH. (C) pH profile of ATP hydrolysis in the absence of IP6. Reaction mixtures (20 μL) containing 30 mM Tris buffer (either Tris-acetate at pH 4.5, 5.0, 5.5, or 6.0; Tris-HCl at pH 6.5, 7.0, 7.5, 8.0, 8.5, 9.0, or 9.5), 50 mM NaCl, 2 mM MgCl2, 0.5 mM (10 nmol) [γ32P]ATP, and 5 μM (100 pmol) Asp1-(1-385) were incubated at 37°C for 90 min. The extents of Pi formation are plotted as a function of pH. (D) Enzyme titration. Reaction mixtures (20 μL) containing 30 mM Bis-Tris (pH 6.2), 50 mM NaCl, 10 mM MgCl2, 0.5 mM (10 nmol) [γ32P]ATP, 1 mM (20 nmol) IP6, and Asp1-(1-385) as specified were incubated at 37°C for 90 min. The extents of IP7 and Pi formation are plotted as a function of input enzyme. (E) Kinetic profile. A reaction mixture (90 μL) containing 30 mM Bis-Tris (pH 6.2), 50 mM NaCl, 10 mM MgCl2, 0.5 mM [γ32P]ATP, 1 mM IP6, and 5 μM Asp1-(1-385) was incubated at 37°C. At times specified, aliquots (10 μL; containing 5 nmol ATP, 10 nmol IP6, and 50 pmol enzyme) were withdrawn and quenched immediately by adjustment to 45 mM EDTA. The extents of IP7 and Pi formation are plotted as a function of time. (F) Divalent cation specificity for ATP hydrolysis. Reaction mixtures (20 μL) containing 30 mM Tris-acetate (pH 6.0), 50 mM NaCl, 0.5 mM (10 nmol) [γ32P]ATP, 5 μM (100 pmol) Asp1-(1-385), and either no metal (–) or 2 mM the indicated divalent cation (as the chloride salt, except for CdSO4) were incubated for 90 min at 37°C. The extents of Pi formation are plotted in bar graph format. All data in the graphs in panels A–F are the averages of three independent experiments ± SEM.
FIG 3
FIG 3
NTP donor specificity of Asp1 kinase. Reaction mixtures (20 μL) containing 30 mM Bis-Tris (pH 6.2), 50 mM NaCl, 10 mM MgCl2, 1 mM IP6, 5 μM Asp1-(1-385) (lanes +), and either no added NTP (–) or 5 mM ATP, GTP, UTP, CTP, or dATP as specified were incubated at 37°C for 90 min. Reaction products were analyzed by PAGE and detected by toluidine blue staining.
FIG 4
FIG 4
5-IP7 kinase activity. (A) Reaction mixtures (20 μL) containing 30 mM Bis-Tris (pH 6.2), 50 mM NaCl, 5 mM MgCl2, 2 mM ATP (in lanes labeled +), 0.5 mM IP6, 5-IP7, or 1-IP7 as specified, and 5 μM Asp1-(1-385) were incubated at 37°C for 90 min. Reaction products were analyzed by PAGE and detected by toluidine blue staining. (B) Kinetic profile. A reaction mixture (50 μL) containing 30 mM Bis-Tris (pH 6.2), 50 mM NaCl, 5 mM MgCl2, 0.25 mM [γ32P]ATP, 0.5 mM 5-IP7, and 2.5 μM Asp1-(1-385) was incubated at 37°C. At times specified, aliquots (5 μL; containing 1.25 nmol ATP, 2.5 nmol input 5-IP7, and 12.5 pmol enzyme) were withdrawn and quenched immediately with EDTA. The products were analyzed by TLC. The extents of IP8 formation (kinase) and Pi formation (ATPase) are plotted as a function of time. The data are averages of three independent experiments ± SEM. (C) A 5-IP7 kinase reaction was performed as in panel B. Aliquots quenched at the times specified were analyzed by PAGE and the 32P-labeled species were visualized by autoradiography. A control Asp1 kinase reaction with IP6 as substrate was incubated for 60 min and analyzed in parallel. The positions of 32P-labeled ATP substrate and the 1-IP7 and IP8 kinase products are indicated at left and right. (32Pi runs off the bottom of the gel and is not visualized.) (D) Reaction mixtures (20 μL) containing 30 mM Bis-Tris (pH 6.2), 50 mM NaCl, 5 mM MgCl2, 0.25 mM (5 nmol) [γ32P]ATP, IP6 and 5-IP7 at the concentrations specified, and 2.5 μM (50 pmol) Asp1 kinase were incubated at 37°C for 15 min. Asp1 kinase was omitted from a control reaction (lane –E). Products were analyzed by PAGE; an autoradiograph of the gel is shown. The gel was scanned with a Typhoon FLA7000 imager and radioactivity was quantified with ImageQuant-TL. Yields of 32P-labeled IP8 and 1-IP7 were calculated by normalizing their signal intensities to that of ATP in the no enzyme control.
FIG 5
FIG 5
Structural homology of fission yeast Asp1 and human PPIP5K2 kinase domains. (A) The amino acid sequence of the S. pombe (Spo) Asp1 kinase domain is aligned to that of the Homo sapiens (Hsa) PPIP5K2 kinase domain. Positions of amino acid side chain identity/similarity are denoted by dots above the alignment. Gaps in the alignment are indicated by dashes. Amino acids in PPIP5K2 are highlighted in colored shading according to their contacts in the active site structure depicted in panel B. PPIPK2 residues that coordinate the two magnesium cofactors are highlighted in magenta. Residues that engage the adenosine nucleoside and the ADP β-phosphate are shaded in gray and green, respectively. Residues that coordinate the MgF3 mimetic of the γ-phosphate transition state or the 1-phosphate of 5-IP7 are shaded in cyan. Residues that contact the other phosphates of 5-IP7 are highlighted in yellow. (B) Stereo view of the active site of PPIPK2 (from PDB 3T9E) as the ADP•MgF3 transition state mimetic (MgF3 rendered as atomic spheres with magnesium colored magenta and fluorines colored pale blue) in complex with 5-IP7 (stick model with gray carbons) and two magnesium cofactors (green spheres). The ADP β-phosphorus and 5-IP7 1-phosphorus atoms are colored yellow. Waters are depicted as red spheres. Amino acids are rendered as stick models with beige carbons. Amino acids are numbered according to their conserved counterparts in Asp1.
FIG 6
FIG 6
Amino acids targeted for mutagenesis in Asp1 kinase and their conserved counterparts in human PPIP5K2.
FIG 7
FIG 7
Structure-guided alanine scanning mutagenesis of Asp1 kinase. (A) Aliquots (8 μg) of wild-type Asp1 kinase domain and the indicated alanine mutants were analyzed by SDS–PAGE. The Coomassie-blue stained gel is shown. The positions and sizes (kDa) of marker polypeptides (leftmost lane) are indicated. (B) Kinase reaction mixtures (20 μL) containing 30 mM Bis-Tris (pH 6.2), 50 mM NaCl, 5 mM MgCl2, 0.25 mM (5 nmol) [γ32P]ATP, 0.5 mM (10 nmol) 5-IP7, and 2.5 μM (50 pmol) of wild-type Asp1 kinase domain or the indicated alanine mutants were incubated at 37°C for 15 min. The products were analyzed by TLC. The extents of IP8 formation are plotted for each enzyme. The data in the bar graph are the averages of three independent experiments ± SEM.
FIG 8
FIG 8
Asp1 kinase activity derepresses pho1 expression in vivo. (A) Single colonies (≥20) of asp1Δ cells bearing either pTIN plasmids encoding wild-type or mutant Asp1 kinase domains or the empty pTIN vector were pooled and grown in Leu ePMG with 15 μM thiamine. Aliquots of exponentially growing cultures were assayed for acid phosphatase activity. The data are averages (±SEM) of at least three independent biological replicates. (B) Western blots of whole-cell extracts prepared from asp1Δ cells bearing the indicated pTIN plasmids. The blots were probed with affinity-purified rabbit polyclonal antibodies recognizing Asp1 or Spt5 (as a loading control), as specified. The positions and sizes (kDa) of protein markers are indicated on the left.
FIG 9
FIG 9
Recombinant full-length Asp1. Elution profile of wild-type Asp1 during Superdex-200 gel filtration. The top panel shows the absorbance at 280 nm (blue trace) and 260 nm (red trace) as a function of elution volume. The A260=A280 peak at 50 mL demarcates the void volume. Aliquots (5 μL) of the fractions spanning and flanking the A280 peak were analyzed by SDS-PAGE. The Coomassie blue-stained gel is shown. The positions and sizes (kDa) of marker proteins are indicated on the left. The fraction corresponding to the A280 peak containing purified Asp1 is indicated by the vertical arrow.
FIG 10
FIG 10
Biochemical activities of full-length Asp1 and active site mutant. (A) Aliquots (15 μg) of full-length wild-type Asp1 and H397A mutant were analyzed by SDS–PAGE. The Coomassie-blue stained gel is shown. The positions and sizes (kDa) of marker polypeptides are indicated on the left. (B) Reaction mixtures (20 μL) containing 30 mM Bis-Tris (pH 6.2), 50 mM NaCl, 10 mM MgCl2, 0.5 mM (10 nmol) [γ32P]ATP, 1 mM IP6, and Asp1 as specified were incubated at 37°C for 90 min. Products were analyzed by TLC. The extents of IP7 and Pi formation are plotted as a function of input enzyme. (C) Phosphatase reaction mixtures (20 μL) containing 30 mM Bis-Tris (pH 6.2), 50 mM NaCl, 2 mM MgCl2, 0.5 mM IP6, 5-IP7 or 1-IP7, and 5 μM wild-type Asp1 (lanes +) were incubated at 37°C for 30 min. Reaction products were analyzed by PAGE and detected by toluidine blue staining. (D) Kinase reaction mixtures (20 μL) containing 30 mM Bis-Tris (pH 6.2), 50 mM NaCl, 10 mM MgCl2, 0.5 mM (10 nmol) [γ32P]ATP, 1 mM IP6, and Asp1-(H397A) as specified were incubated at 37°C for 90 min. The extents of IP7 and Pi formation are plotted as a function of input enzyme. The data in panels B and D are averages of three independent experiments ± SEM. (E) IP7 kinase reaction mixtures (20 μL) containing 30 mM Bis-Tris (pH 6.2), 50 mM NaCl, 5 mM MgCl2, 0.5 mM 5-IP7, 2 mM ATP, and 5 μM Asp1 WT or Asp1-(H397A) were incubated at 37°C for 30 min. Reaction products were analyzed by PAGE and detected by toluidine blue staining.
FIG 11
FIG 11
Effect of inorganic phosphate on activity of full-length Asp1. (A) Asp1 titration. Reaction mixtures (20 μL) containing 30 mM Bis-Tris (pH 6.2), 50 mM NaCl, 5 mM MgCl2, 0.25 mM (5 nmol) [γ32P]ATP, 0.5 mM 5-IP7, and full-length Asp1 as specified were incubated at 37°C for 30 min. Products were analyzed by TLC. The extents of 32P-IP8 and 32Pi formation are plotted as a function of input enzyme. (B) Effect of phosphate. Reaction mixtures (20 μL) containing 30 mM Bis-Tris (pH 6.2), 50 mM NaCl, 5 mM MgCl2, 0.25 mM (5 nmol) [γ32P]ATP, 0.5 mM 5-IP7, 10 pmol full-length Asp1, and sodium phosphate (pH 6.4) or sodium sulfate (pH 6.4) as specified were incubated at 37°C for 30 min. Products were analyzed by TLC. The extents of 32P-IP8 formation (closed circles) and 32Pi formation (open circles) are plotted as a function of phosphate or sulfate concentration. (C) Asp1 kinase titration. Reaction mixtures (20 μL) containing 30 mM Bis-Tris (pH 6.2), 50 mM NaCl, 5 mM MgCl2, 0.25 mM (5 nmol) [γ32P]ATP, 0.5 mM 5-IP7, and Asp1 kinase as specified were incubated at 37°C for 15 min. Products were analyzed by TLC. The extent of 32P-IP8 formation is plotted as a function of input enzyme. The data in panels A, B, and C are averages of three independent experiments ± SEM. (D) Effect of phosphate on Asp1 kinase domain. Reaction mixtures (20 μL) containing 30 mM Bis-Tris (pH 6.2), 50 mM NaCl, 5 mM MgCl2, 0.25 mM (5 nmol) [γ32P]ATP, 0.5 mM 5-IP7, 5 pmol Asp1 kinase domain, and sodium phosphate (pH 6.4) as specified were incubated at 37°C for 15 min. Products were analyzed by TLC. The extent of 32P-IP8 formation is plotted as a function of phosphate concentration. The data are the average of two independent experiments; error bars indicate the range of values.
FIG 12
FIG 12
Effect of full-length Asp1 on pho1 expression. (A) Single colonies (≥20) of asp1Δ cells bearing either the pTIN plasmids encoding full-length wild-type or mutant Asp1, the wild-type kinase domain (aa 1-385), or the empty pTIN vector were pooled and grown in Leu ePMG with 15 μM thiamine. Aliquots of exponentially growing cultures were assayed for acid phosphatase activity. The data are averages (± SEM) of six independent biological replicates. Whereas unpaired Welch’s t tests of the full-length Asp1 data versus that of the kinase domain showed no significant differences between kinase domain and Asp1-H397A (P value 0.173) or Asp1-R396A (P value 0.846), the full-length wild-type Asp1 differed significantly (P value < 0.0001, denoted by ****). (B) 5-IP7 kinase activity of Asp1-H397A. Reaction mixtures (20 μL) containing 30 mM Bis-Tris (pH 6.2), 50 mM NaCl, 5 mM MgCl2, 0.25 mM (5 nmol) [γ32P]ATP, 0.5 mM (10 nmol) 5-IP7, and Asp1-H397A as specified were incubated at 37°C for 15 min. Products were analyzed by TLC. The extent of 32P-IP8 formation is plotted as a function of input enzyme. The data are averages of three independent experiments ± SEM.

Similar articles

Cited by

References

    1. Shears SB. 2018. Intimate connections: inositol pyrophosphates at the interface of metabolic regulation and cell signaling. J Cell Physiol 233:1897–1912. doi:10.1002/jcp.26017. - DOI - PMC - PubMed
    1. Azevedo C, Saiardi A. 2017. Eukaryotic phosphate homeostasis: the inositol pyrophosphate perspective. Trends Biochem Sci 42:219–231. doi:10.1016/j.tibs.2016.10.008. - DOI - PubMed
    1. Wild R, Gerasimaite R, Jung J-Y, Truffault V, Pavlovic I, Schmidt A, Saiardi A, Jessen HJ, Poirier Y, Hothorn M, Mayer A. 2016. Control of eukaryotic phosphate homeostasis by inositol polyphosphate sensor domains. Science 352:986–990. doi:10.1126/science.aad9858. - DOI - PubMed
    1. Dong J, Ma G, Sui L, Wei M, Satheesh V, Zhang R, Ge S, Li J, Zhang TE, Wittwer C, Jessen HJ, Zhang H, An GY, Chao DY, Liu D, Lei M. 2019. Inositol pyrophosphate InsP8 acts as an intracellular phosphate signal in Arabidopsis. Mol Plant 12:1463–1473. doi:10.1016/j.molp.2019.08.002. - DOI - PubMed
    1. Zhu J, Lau K, Puschmann R, Harmel RK, Zhang Y, Pries V, Gaugler P, Broger L, Dutta AK, Jessen HJ, Schaaf G, Fernie AR, Hothorn LA, Fiedler D, Hothorn M. 2019. Two bifunctional inositol pyrophosphate kinases/phosphatases control plant phosphate homeostasis. Elife 8:e43582. doi:10.7554/eLife.43582. - DOI - PMC - PubMed

Publication types

MeSH terms

LinkOut - more resources