

Ongoing transposition in cell culture reveals the phylogeny of diverse Drosophila S2 sublines
- PMID: 35536183
- PMCID: PMC9252272
- DOI: 10.1093/genetics/iyac077
Ongoing transposition in cell culture reveals the phylogeny of diverse Drosophila S2 sublines
Abstract
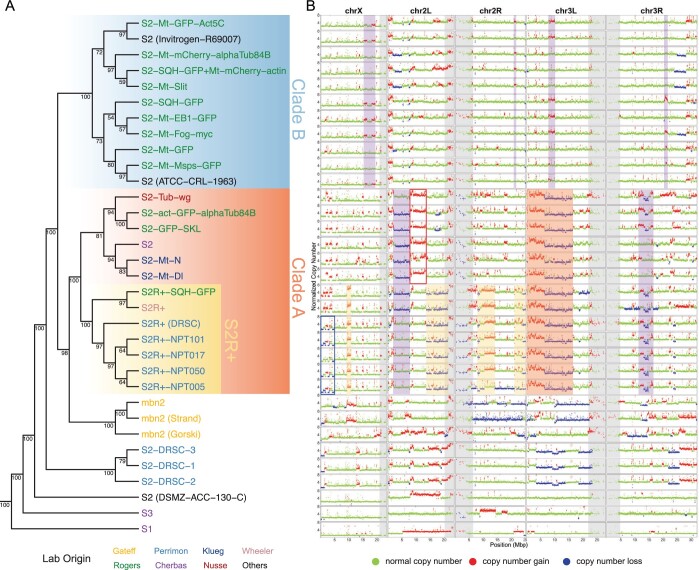
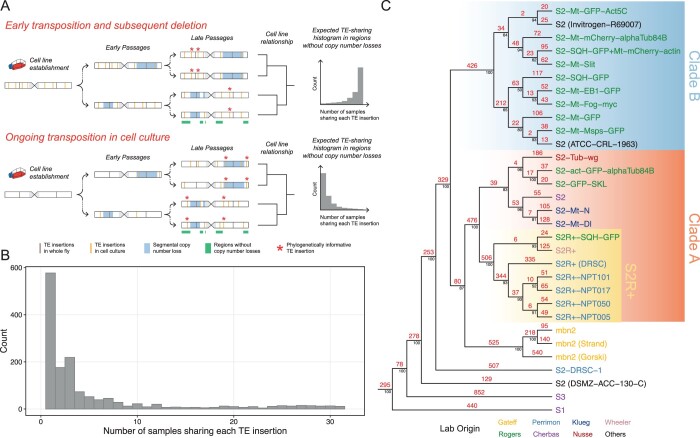
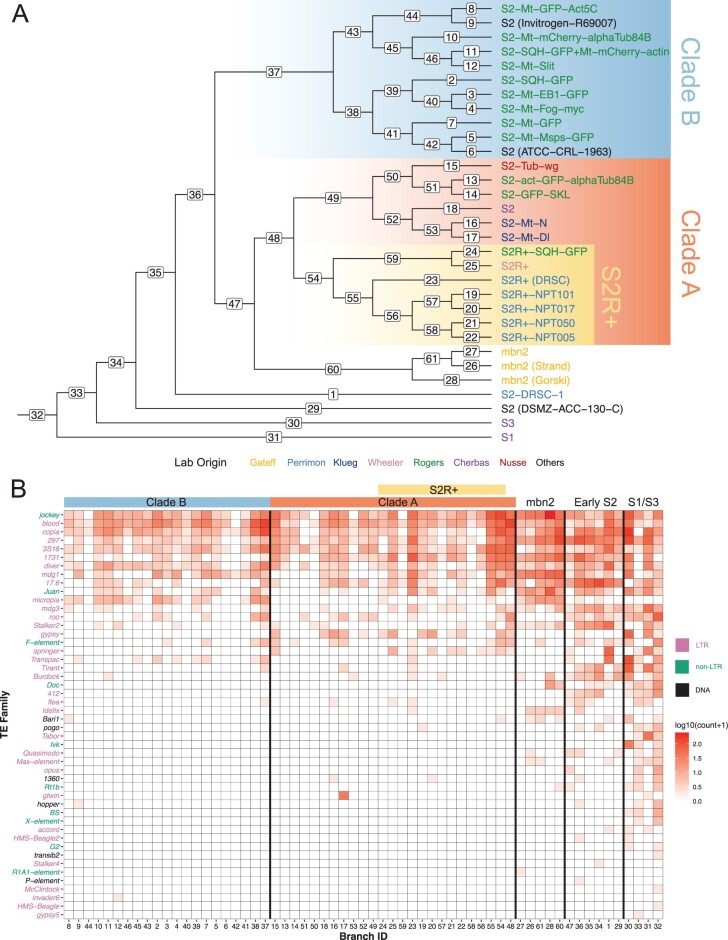
Cultured cells are widely used in molecular biology despite poor understanding of how cell line genomes change in vitro over time. Previous work has shown that Drosophila cultured cells have a higher transposable element content than whole flies, but whether this increase in transposable element content resulted from an initial burst of transposition during cell line establishment or ongoing transposition in cell culture remains unclear. Here, we sequenced the genomes of 25 sublines of Drosophila S2 cells and show that transposable element insertions provide abundant markers for the phylogenetic reconstruction of diverse sublines in a model animal cell culture system. DNA copy number evolution across S2 sublines revealed dramatically different patterns of genome organization that support the overall evolutionary history reconstructed using transposable element insertions. Analysis of transposable element insertion site occupancy and ancestral states support a model of ongoing transposition dominated by episodic activity of a small number of retrotransposon families. Our work demonstrates that substantial genome evolution occurs during long-term Drosophila cell culture, which may impact the reproducibility of experiments that do not control for subline identity.
Keywords: Drosophila; cell culture; copy number variation; genome evolution; transposable element.
© The Author(s) 2022. Published by Oxford University Press on behalf of Genetics Society of America.
Figures
Similar articles
-
Abundant and species-specific DINE-1 transposable elements in 12 Drosophila genomes.Genome Biol. 2008;9(2):R39. doi: 10.1186/gb-2008-9-2-r39. Epub 2008 Feb 21. Genome Biol. 2008. PMID: 18291035 Free PMC article.
-
Vertical inheritance and bursts of transposition have shaped the evolution of the BS non-LTR retrotransposon in Drosophila.Mol Genet Genomics. 2011 Jul;286(1):57-66. doi: 10.1007/s00438-011-0629-9. Epub 2011 May 27. Mol Genet Genomics. 2011. PMID: 21618036
-
Amplification of the 1731 LTR retrotransposon in Drosophila melanogaster cultured cells: origin of neocopies and impact on the genome.Gene. 2007 May 15;393(1-2):116-26. doi: 10.1016/j.gene.2007.02.001. Epub 2007 Feb 16. Gene. 2007. PMID: 17382490
-
Evolutionary forces generating sequence homogeneity and heterogeneity within retrotransposon families.Cytogenet Genome Res. 2005;110(1-4):383-91. doi: 10.1159/000084970. Cytogenet Genome Res. 2005. PMID: 16093690 Review.
-
Silencing of Transposable Elements by piRNAs in Drosophila: An Evolutionary Perspective.Genomics Proteomics Bioinformatics. 2017 Jun;15(3):164-176. doi: 10.1016/j.gpb.2017.01.006. Epub 2017 Jun 8. Genomics Proteomics Bioinformatics. 2017. PMID: 28602845 Free PMC article. Review.
Cited by
-
Primary Cell Culture as a Model System for Evolutionary Molecular Physiology.Int J Mol Sci. 2024 Jul 19;25(14):7905. doi: 10.3390/ijms25147905. Int J Mol Sci. 2024. PMID: 39063147 Free PMC article. Review.
-
Local assembly of long reads enables phylogenomics of transposable elements in a polyploid cell line.Nucleic Acids Res. 2022 Nov 28;50(21):e124. doi: 10.1093/nar/gkac794. Nucleic Acids Res. 2022. PMID: 36156149 Free PMC article.
-
Reproducible evaluation of transposable element detectors with McClintock 2 guides accurate inference of Ty insertion patterns in yeast.Mob DNA. 2023 Jul 14;14(1):8. doi: 10.1186/s13100-023-00296-4. Mob DNA. 2023. PMID: 37452430 Free PMC article.
-
Reproducible evaluation of transposable element detectors with McClintock 2 guides accurate inference of Ty insertion patterns in yeast.bioRxiv [Preprint]. 2023 Mar 21:2023.02.13.528343. doi: 10.1101/2023.02.13.528343. bioRxiv. 2023. Update in: Mob DNA. 2023 Jul 14;14(1):8. doi: 10.1186/s13100-023-00296-4. PMID: 36824955 Free PMC article. Updated. Preprint.
References
-
- Arkhipova I, Lyubomirskaya N, Ilyin Y.. Drosophila Retrotransposons. Austin (TX: ): R.G. Landes Co; 1995.
-
- Batzer MA, Deininger PL.. Alu repeats and human genomic diversity. Nat Rev Genet. 2002;3(5):370–379. - PubMed
Publication types
MeSH terms
Substances
Grants and funding
LinkOut - more resources
Full Text Sources
Molecular Biology Databases
