. 2022 Jul 5;82(13):2485-2498.
doi: 10.1158/0008-5472.CAN-22-0804.

Delineating the RAS Conformational Landscape

Affiliations

Delineating the RAS Conformational Landscape

Mitchell I Parker et al. Cancer Res. .

Abstract

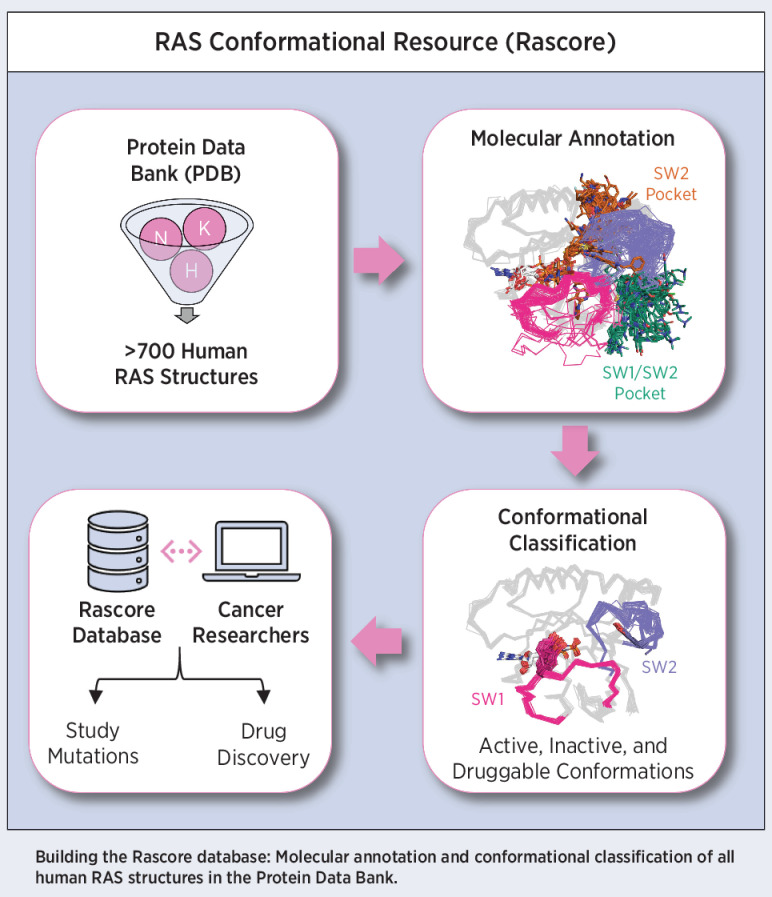
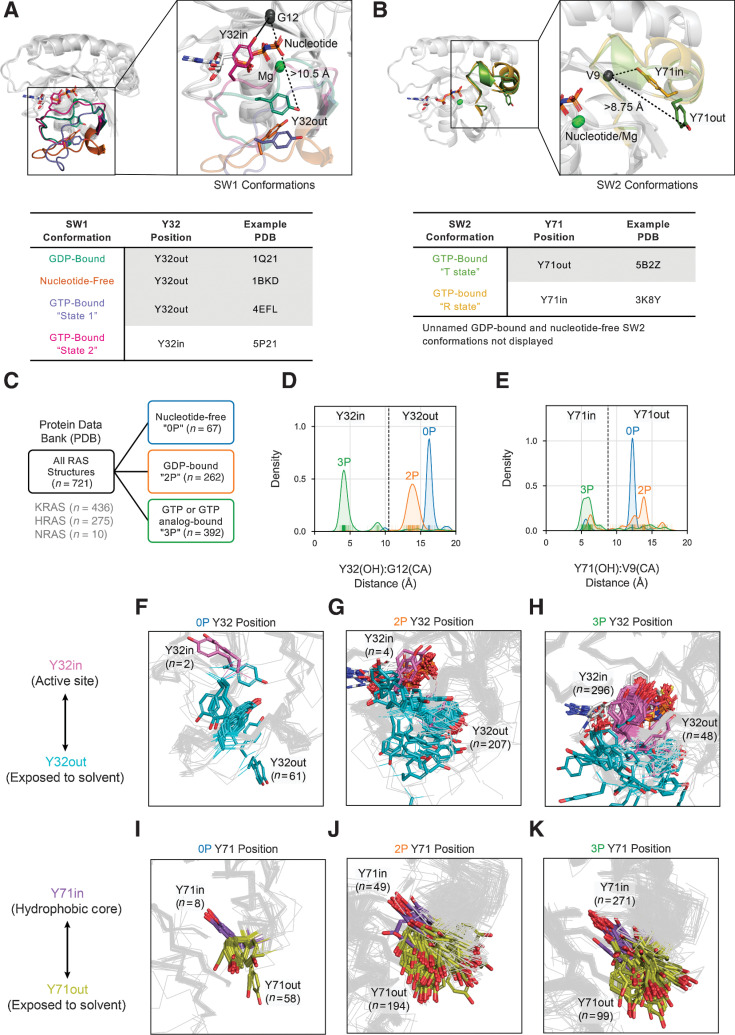
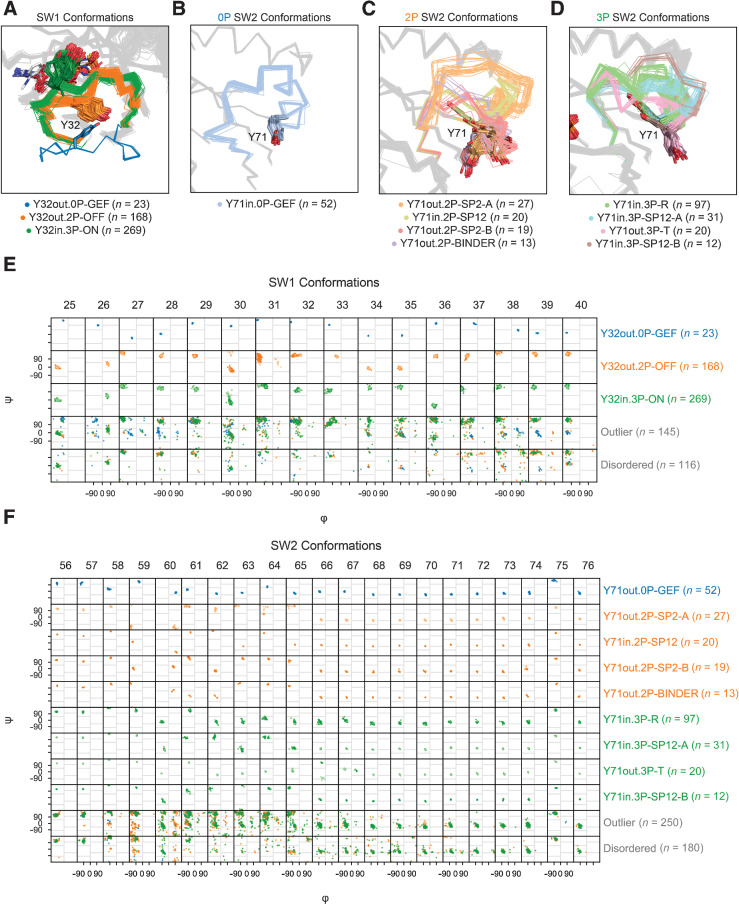
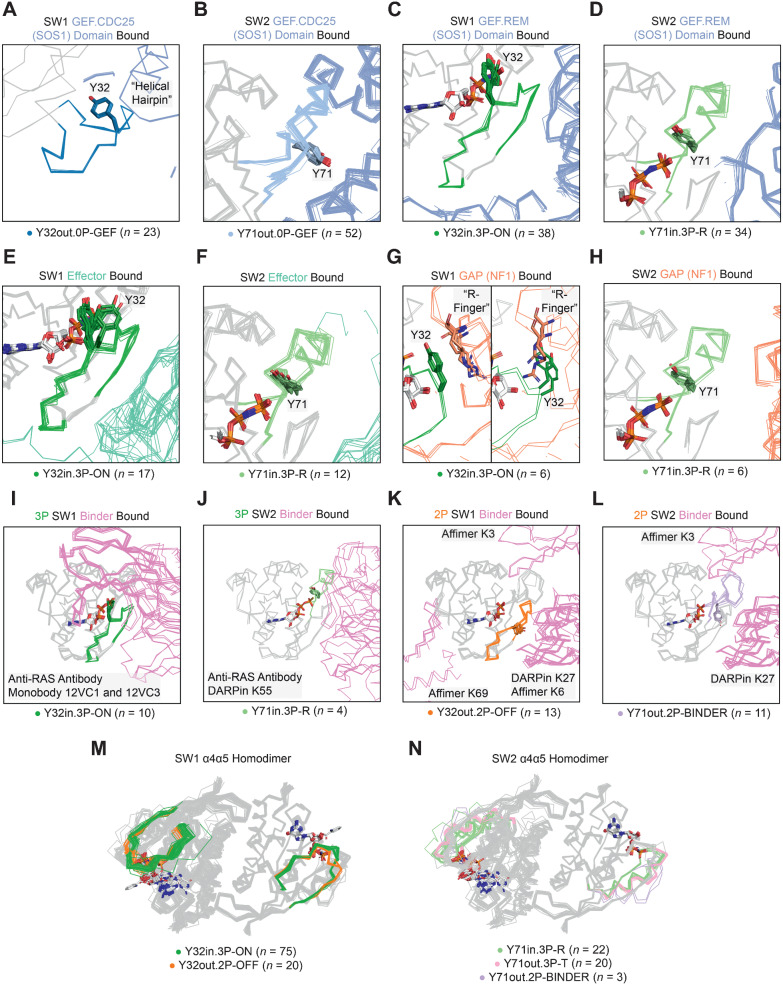
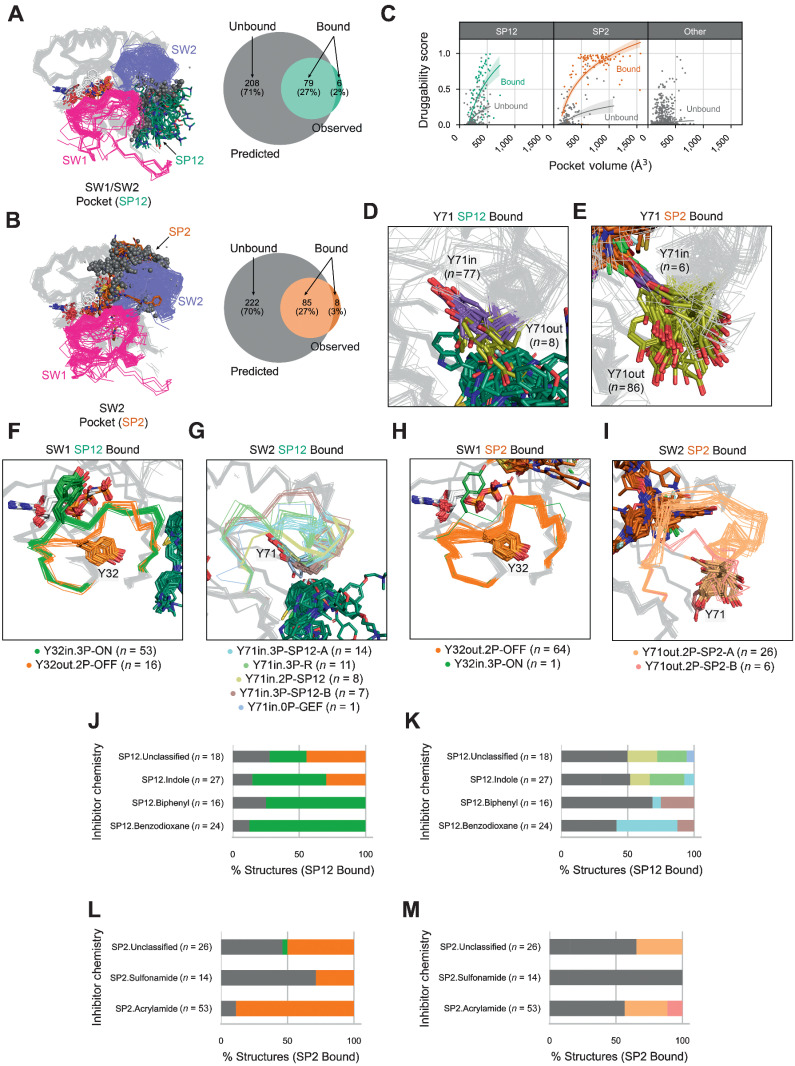
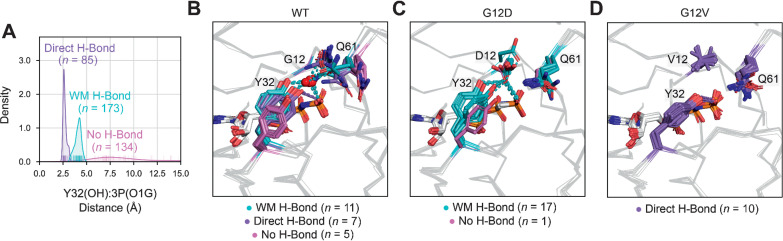
Mutations in RAS isoforms (KRAS, NRAS, and HRAS) are among the most frequent oncogenic alterations in many cancers, making these proteins high priority therapeutic targets. Effectively targeting RAS isoforms requires an exact understanding of their active, inactive, and druggable conformations. However, there is no structural catalog of RAS conformations to guide therapeutic targeting or examining the structural impact of RAS mutations. Here we present an expanded classification of RAS conformations based on analyses of the catalytic switch 1 (SW1) and switch 2 (SW2) loops. From 721 human KRAS, NRAS, and HRAS structures available in the Protein Data Bank (206 RAS-protein cocomplexes, 190 inhibitor-bound, and 325 unbound, including 204 WT and 517 mutated structures), we created a broad conformational classification based on the spatial positions of Y32 in SW1 and Y71 in SW2. Clustering all well-modeled SW1 and SW2 loops using a density-based machine learning algorithm defined additional conformational subsets, some previously undescribed. Three SW1 conformations and nine SW2 conformations were identified, each associated with different nucleotide states (GTP-bound, nucleotide-free, and GDP-bound) and specific bound proteins or inhibitor sites. The GTP-bound SW1 conformation could be further subdivided on the basis of the hydrogen bond type made between Y32 and the GTP γ-phosphate. Further analysis clarified the catalytic impact of G12D and G12V mutations and the inhibitor chemistries that bind to each druggable RAS conformation. Overall, this study has expanded our understanding of RAS structural biology, which could facilitate future RAS drug discovery.

Significance: Analysis of >700 RAS structures helps define an expanded landscape of active, inactive, and druggable RAS conformations, the structural impact of common RAS mutations, and previously uncharacterized RAS inhibitor-binding modes.


Figures

None
Graphical abstract
Figure 1. Broad structural classification of RAS structures. Previous conformational schemes based on the spatial position of, Y32 in SW1 (A) and Y71 in SW2 (B). C, Separation of available RAS structures in the Protein Data Bank by nucleotide states 0P (nucleotide-free), 2P (GDP-bound), and 3P (GTP or GTP analogue-bound). Distribution of distances by nucleotide state between the hydroxyl (OH) atom of residue Y32 and alpha carbon (CA) atom of residue G12 (D) and the OH atom of residue Y71 and CA atom of residue V9 (E); vertical dividing lines in plots indicate distance cutoffs for “in” versus “out” positions of Y32 (D) and Y71 (E), respectively. Structures classified Y32in (pink) and Y32out (cyan) within 0P (F), 2P (G), and 3P nucleotide states (H). Structures classified Y71in (purple) and Y71out (olive) within, 0P (I), 2P (J), and 3P nucleotide states (K).
Figure 1.
Broad structural classification of RAS structures. A and B, Previous conformational schemes based on the spatial position of, Y32 in SW1 (A) and Y71 in SW2 (B). C, Separation of available RAS structures in the Protein Data Bank by nucleotide states 0P (nucleotide-free), 2P (GDP-bound), and 3P (GTP or GTP analogue-bound). D and E, Distribution of distances by nucleotide state between the hydroxyl (OH) atom of residue Y32 and alpha carbon (CA) atom of residue G12 (D) and the OH atom of residue Y71 and CA atom of residue V9 (E); vertical dividing lines in plots indicate distance cutoffs for “in” versus “out” positions of Y32 (D) and Y71 (E), respectively. FH, Structures classified Y32in (pink) and Y32out (cyan) within 0P (F), 2P (G), and 3P nucleotide states (H). IK, Structures classified Y71in (purple) and Y71out (olive) within, 0P (I), 2P (J), and 3P nucleotide states (K).
Figure 2. SW1 and SW2 conformational clusters. A, SW1 conformations. In the Y32out.0P-GEF conformation, the central Y32 residue in SW1 is ∼12–13 Å from the active site. In the Y32out.2P-OFF conformation, SW1 is “closed” and interacts with the nucleotide through the backbone atoms of residues 28–32. In the Y32in.3P-ON conformation, further interactions are made with the nucleotide involving the side chains of residues Y32 and T35. SW2 conformations within 0P (B), 2P (C), and 3P states (D). In the Y71out.0P-GEF conformation, residues 58–60 of SW2 are pulled towards the nucleotide site, and the side chains of residues Q61 and Y71 form an intra- SW2 hydrogen bond (not displayed), which is not seen in other SW2 conformations. In all 2P SW2 conformations, except for Y71in.2P-SP12, Y71 is exposed to the solvent; the opposite trend is observed in all 3P SW2 conformations where Y71 is buried in the hydrophobic core of the protein, except in Y71out.3P-T where it is exposed. Ramachandran maps (φ versus ψ backbone dihedrals) for, E, SW1 and, F, SW2 conformational clusters. Lighter points in E and F correspond to loop structures with one or more residues belonging to different regional subdivisions of the Ramachandran map relative to the overall cluster that they belong to.
Figure 2.
SW1 and SW2 conformational clusters. A, SW1 conformations. In the Y32out.0P-GEF conformation, the central Y32 residue in SW1 is ∼12–13 Å from the active site. In the Y32out.2P-OFF conformation, SW1 is “closed” and interacts with the nucleotide through the backbone atoms of residues 28–32. In the Y32in.3P-ON conformation, further interactions are made with the nucleotide involving the side chains of residues Y32 and T35. BD, SW2 conformations within 0P (B), 2P (C), and 3P states (D). In the Y71out.0P-GEF conformation, residues 58–60 of SW2 are pulled towards the nucleotide site, and the side chains of residues Q61 and Y71 form an intra- SW2 hydrogen bond (not displayed), which is not seen in other SW2 conformations. In all 2P SW2 conformations, except for Y71in.2P-SP12, Y71 is exposed to the solvent; the opposite trend is observed in all 3P SW2 conformations where Y71 is buried in the hydrophobic core of the protein, except in Y71out.3P-T where it is exposed. E and F, Ramachandran maps (φ versus ψ backbone dihedrals) for SW1 (E) and SW2 (F) conformational clusters. Lighter points in E and F correspond to loop structures, with one or more residues belonging to different regional subdivisions of the Ramachandran map relative to the overall cluster that they belong to.
Figure 3. SW1 and SW2 conformations associated with bound proteins. SW1 and SW2 conformations bound to the GEF.CDC25 (catalytic) domain of SOS (A and B), the GEF.REM (allosteric) domain of SOS1 (C and D), effectors (E and F), the GAP NF1 (G and H), 3P targeting designed protein “binders” (I and J), 2P targeting binders (K and L). M and N, structures forming the α4α5 homodimer. A, the “helical hairpin” of SOS1 opening SW1 of RAS. G, Comparison of the catalytic “arginine (R) finger” position for the GAP NF1 with Y32 within 4.5 Å of the GTP γ-phosphate (left) and ∼2 Å further away from the γ-phosphate (right, PDB: identical to the transition state stabilized in 1WQ1).
Figure 3.
SW1 and SW2 conformations associated with bound proteins. SW1 and SW2 conformations bound to the GEF.CDC25 (catalytic) domain of SOS (A and B), the GEF.REM (allosteric) domain of SOS1 (C and D), effectors (E and F), the GAP NF1 (G and H), 3P targeting designed protein “binders” (I and J), and 2P targeting binders (K and L). M and N, structures forming the α4α5 homodimer. A, the “helical hairpin” of SOS1 opening SW1 of RAS. G, Comparison of the catalytic “arginine (R) finger” position for the GAP NF1 with Y32 within 4.5 Å of the GTP γ-phosphate (left) and ∼2 Å further away from the γ-phosphate (right, PDB: identical to the transition state stabilized in 1WQ1).
Figure 4. SW1 and SW2 conformations associated with inhibitor sites. Observed and predicted, SW1/SW2 pockets (SP12; A) and SW2 pockets (SP2; B) across RAS structures in the PDB. C, Pocket volumes and druggability scores across inhibitor-bound and unbound SP2, SP12, or other sites. Y71 positions in, SP12 (D) and SP2 inhibitor–bound structures (E). SW1 and SW2 conformations in RAS structures with an inhibitor-bound SP12 site (E and F) and an inhibitor-bound SP2 site (G and H). Percent of each SW1 and SW2 conformation bound to inhibitors with different chemistries at the SP12 site (I and J) and the SP2 site (K and L). I-J, colored by the same scheme as with gray indicating structures labeled outlier or disordered (E-H).
Figure 4.
SW1 and SW2 conformations associated with inhibitor sites. A and B, Observed and predicted, SW1/SW2 pockets (SP12; A) and SW2 pockets (SP2; B) across RAS structures in the PDB. C, Pocket volumes and druggability scores across inhibitor-bound and unbound SP2, SP12, or other sites. D and E, Y71 positions in SP12 (D) and SP2 (E) inhibitor–bound structures. FI, SW1 and SW2 conformations in RAS structures with an inhibitor-bound SP12 site (F and G) and an inhibitor-bound SP2 site (H and I). JM, Percent of each SW1 and SW2 conformation bound to inhibitors with different chemistries at the SP12 site (J and K) and the SP2 site (L and M). JM are colored by the same scheme, with gray indicating structures labeled outlier or disordered (F–I).
Figure 5. Structural impact of G12D and G12V mutations on GTP-bound substate preference. A, Distance distribution within 3P structure between the hydroxyl (OH) atom of residue Y32 and closest γ-phosphate (called here O1G) atom of GTP or GTP analogues, which was used to define hydrogen (H)-bonding subtypes: water-mediated (WM) H-bond, direct H-bond, and no H-bond. 3P substate preference within WT (B), G12D (C), and G12V (D) structures.
Figure 5.
Structural impact of G12D and G12V mutations on GTP-bound substate preference. A, Distance distribution within 3P structure between the hydroxyl (OH) atom of residue Y32 and closest γ-phosphate (called here O1G) atom of GTP or GTP analogues, which was used to define hydrogen (H)-bonding subtypes: water-mediated (WM) H-bond, direct H-bond, and no H-bond. BD, 3P substate preference within WT (B), G12D (C), and G12V (D) structures.

Similar articles

Cited by

References

    1. Prior IA, Hood FE, Hartley JL. The frequency of Ras mutations in cancer. Cancer Res 2020;80:2969. - PMC - PubMed
    1. Lu S, Jang H, Muratcioglu S, Gursoy A, Keskin O, Nussinov R, et al. . Ras conformational ensembles, allostery, and signaling. Chem Rev 2016;116:6607–65. - PubMed
    1. Hofmann MH, Gerlach D, Misale S, Petronczki M, Kraut N. Expanding the reach of precision oncology by drugging all KRAS mutants. Cancer Discov 2022;12:924–37. - PMC - PubMed
    1. Simanshu DK, Nissley DV, McCormick F. RAS proteins and their regulators in human disease. Cell 2017;170:17–33. - PMC - PubMed
    1. Boriack-Sjodin PA, Margarit SM, Bar-Sagi D, Kuriyan J. The structural basis of the activation of Ras by Sos. Nature 1998;394:337–43. - PubMed

Publication types

MeSH terms