. 2022 Jun 6;221(6):e202112081.
doi: 10.1083/jcb.202112081. Epub 2022 May 10.

VMP1 and TMEM41B are essential for DMV formation during β-coronavirus infection

Affiliations

VMP1 and TMEM41B are essential for DMV formation during β-coronavirus infection

Mingming Ji et al. J Cell Biol. .

Abstract

β-coronaviruses reshape host cell endomembranes to form double-membrane vesicles (DMVs) for genome replication and transcription. Ectopically expressed viral nonstructural proteins nsp3 and nsp4 interact to zipper and bend the ER for DMV biogenesis. Genome-wide screens revealed the autophagy proteins VMP1 and TMEM41B as important host factors for SARS-CoV-2 infection. Here, we demonstrated that DMV biogenesis, induced by virus infection or expression of nsp3/4, is impaired in the VMP1 KO or TMEM41B KO cells. In VMP1 KO cells, the nsp3/4 complex forms normally, but the zippered ER fails to close into DMVs. In TMEM41B KO cells, the nsp3-nsp4 interaction is reduced and DMV formation is suppressed. Thus, VMP1 and TMEM41B function at different steps during DMV formation. VMP1 was shown to regulate cross-membrane phosphatidylserine (PS) distribution. Inhibiting PS synthesis partially rescues the DMV defects in VMP1 KO cells, suggesting that PS participates in DMV formation. We provide molecular insights into the collaboration of host factors with viral proteins to remodel host organelles.


Figures

Figure 1.
Figure 1.
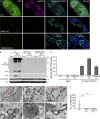
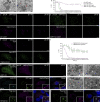
VMP1 and TMEM41B are required for β-coronavirus infection. (A) Immunostaining results show that GFP expression from an MHV-A59/GFP reporter virus and virus-specific dsRNA is detected in control (Ctrl) HeLa cells, but not in VMP1 KO or TMEM41B KO cells 9 h after MHV-A59 infection. Efficient expression of the MHV-A59 receptor Flag-mCEACAM1 is verified by immunostaining with Flag antibody. Bars: 10 μm. (B) 16 h after MHV-A59/GFP infection at the indicated multiplicity of infection (MOI), high levels of nsp9 precursors, mature nsp9, and GFP are detected in control HeLa cells, while no expression of nsp9 or GFP is detected in VMP1 KO or TMEM41B KO cells. The expression levels of mCEACAM1 are comparable in control and KO cells. (C) Control, VMP1 KO, and TMEM41B KO cells were infected with MHV-A59 for 3 h. Viral RNA levels were determined by quantitative PCR using virus-specific primers. Values were normalized to GAPDH mRNA levels (n = 3). (D and E) TEM analysis shows that numerous DMVs are observed in control cells 6 h after MHV-A59 infection. No DMVs are formed in VMP1 KO or TMEM41B KO cells (D). Virus (red arrow) is occasionally detected in endolysosomes of VMP1 KO cells. White arrows indicate DMVs. N, nucleus. Quantification of DMV numbers per cell is shown as mean ± SD (Ctrl, n = 33; VMP1 KO, n = 42; TMEM41B KO, n = 25; E). ****, P < 0.0001. Bars: 500 nm; inserts, 200 nm. Source data are available for this figure: SourceData F1.
Figure S1.
Figure S1.
DMVs are induced by coexpression of SARS-CoV-2 nsp3 and nsp4, related to Figs. 1 and 2. (A) Genomic DNA sequences of VMP1 in control and VMP1 KO HeLa cells. Deletions are indicated by dashes. (B) Immunoblotting with VMP1 antibody verifies the KO efficiency in VMP1 KO HeLa cells. (C) Genomic DNA sequences of TMEM41B in control and TMEM41B KO HeLa cells. The insertion is highlighted in red. (D) Immunoblotting with TMEM41B antibody verifies the KO efficiency in TMEM41B KO HeLa cells. (E–J) Immunostaining shows that Flag-nsp3/nsp4-mCherry double positive foci do not colocalize with GFP-Rab5 (E), GFP-Rab7 (F), EHD1-GFP (G), GFP-Sec24c (H), ERGIC53-GFP (I), or EDEM1-GFP (J). Bars: 5 μm; inserts, 2 μm. (K) TEM analysis demonstrates that clusters of DMVs are formed in HeLa cells coexpressing nsp3/4. The arrow indicates a DMV associated with the ER. The red boxed area in the left panel is enlarged in the right panel. N, nucleus. Bars: left panel, 500 nm; right panel, 200 nm. (L) Immuno-electron microscopy micrographs of control cells coexpressing mCherry-nsp3 and nsp4-GFP. Anti-GFP antibody (10 nm gold, arrows) was used to detect nsp4-GFP. The red boxed area in the left panel is enlarged in the right panel. Bars: left panel, 100 nm; right panel, 50 nm. (M and N) In FPP assays, time-lapse images show that mCherry-nsp3 puncta immediately disappear while most of nsp4-GFP puncta persist upon pK addition in digitonin-permeabilized HeLa cells coexpressing nsp3/4 (M). Quantitative data are shown as mean ± SEM (n = 16; N). Bars: 5 μm. (O and P) In FPP assays, time-lapse images show that mCherry-nsp3 puncta immediately disappear while most of nsp4-GFP puncta persist upon pK addition in digitonin-permeabilized COS7 cells coexpressing nsp3/4 (O). Quantitative data are shown as mean ± SEM (n = 17; P). Bars: 5 μm. (Q and R) HeLa cells coexpressing GFP-nsp3-SBP and nsp4–mCherry at control (Q) and 24 h biotin treatment (R) conditions. Bars, 5 μm. Source data are available for this figure: SourceData FS1.
Figure 2.
Figure 2.
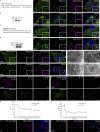
Ectopic expression of SARS-CoV-2 nsp3 and nsp4 is sufficient to induce DMVs. (A) In HeLa cells expressing GFP-nsp3 or nsp4-GFP alone, each protein shows a diffuse ER pattern and colocalizes with RFP-Sec61β. When cells are cotransfected with GFP-nsp3 and nsp4-mCherry, a large number of foci are observed, which are positive for both nsp3 and nsp4. Bars: 5 μm; inserts, 2 μm. (B) 3D-SMLM imaging of nsp4-SNAP co-transfected with GFP-nsp3 in a cell. The left panel shows the image of two nsp4 puncta in a large area with the z position color-coded. The middle panels show the x-y cross-sections of the boxed regions 1 and 2. The corresponding vertical cross-sections along the dotted lines are shown in the right panels. Bars: left panel, 5 μm; middle and right panels, 100 nm. (C–E) TEM images demonstrate that numerous DMVs are detected in HeLa cells coexpressing nsp3/4 (C). The sizes of DMVs formed during SARS-CoV-2 infection are larger than those induced by nsp3/4 expression (D). N, nucleus. Quantification of the size of DMVs is shown as mean ± SD (nsp3/4, n = 125; SARS-CoV-2, n = 71; E). ****, P < 0.0001. Bars: 500 nm. (F) CLEM images of a control cell expressing GFP-nsp3 and nsp4-mCherry. The left panel shows two nsp4 puncta in a large area. The middle and right panels show the boxed regions 1 and 2. Bars: left panel, 2 μm; middle and right panels, 500 nm. (G and H) In FPP assays, time-lapse images show that GFP-nsp3 puncta immediately disappear, while most of nsp4-mCherry puncta persist upon pK (proteinase K) addition in digitonin-permeabilized HeLa cells coexpressing nsp3/4 (H). Quantitative data (n = 11) are shown as mean ± SEM (G). Bars: 5 μm. (I) In most cells cotransfected with plasmids expressing GFP-nsp3-SBP and Strep-nsp4-mCherry, the two proteins show a diffuse ER pattern. After the addition of biotin for 24 h, GFP-nsp3-SBP and Strep-nsp4-mCherry form punctate structures. Bars, 5 μm. (J) The top panel shows a schematic of the topology of nsp3, and the structures of the nsp3 truncations. The bottom panel demonstrates that Flag–nsp4 is immunoprecipitated by WT GFP-nsp3, GFP-nsp3(1–1546), or GFP-nsp3(1–1582), but not GFP-nsp3(1-1452) in a GFP-Trap assay. (K) The left panel shows a schematic of the topology of nsp4 and the structures of the nsp4 truncations. The right panel demonstrates that Flag-nsp3 is immunoprecipitated by WT nsp4-GFP or nsp4(Δ338-364)-GFP, but not nsp4(Δ35-280)-GFP in a GFP-Trap assay. (L) In a GFP-Trap assay, mCherry-nsp3 is immunoprecipitated by GFP-nsp3. (M) In a GFP-Trap assay, nsp4–mCherry is immunoprecipitated by nsp4-GFP. (N) In a GFP-Trap assay, more Flag-nsp3 is immunoprecipitated by WT GFP-nsp3, compared with GFP-nsp3(Δ1436-1499). (O) In a GFP-Trap assay, more Flag-nsp4 is immunoprecipitated by WT nsp4-GFP, compared with nsp4(Δ35–280)-GFP. Source data are available for this figure: SourceData F2.
Figure 3.
Figure 3.
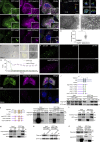
VMP1 and TMEM41B are involved at distinct steps of DMV generation. (AC) Cotransfection of nsp3 and nsp4 induces punctate structures in control, VMP1 KO and TMEM41B KO cells (A). Formation of nsp3/4+ puncta is less efficient in TMEM41B KO cells. The percentages of cells with formation of nsp3/4+ foci (Ctrl, n = 105; VMP1 KO, n = 104; TMEM41B KO, n = 110; B) and the numbers of nsp3/4+ foci (Ctrl, n = 45; VMP1 KO, n = 22; TMEM41B KO, n = 54; C) are quantified. ***, P < 0.001; ****, P < 0.0001; N.S., not significant. Bars: 5 μm. (D and E) TEM images show that coexpression of nsp3/4 induces clusters of DMVs in control HeLa cells, while in VMP1 KO and TMEM41B KO cells, the number of DMVs is greatly reduced and most DMVs are scattered in the cytosol. White arrows indicate DMVs. Concentric zippered membranes (red arrow) are present in VMP1 KO cells (D). N, nucleus. The numbers of DMVs per cell are quantified and shown as mean ± SEM (Ctrl, n = 108; VMP1 KO, n = 133; TMEM41B KO, n = 60; E). *, P < 0.05; ***, P < 0.001; N.S., not significant. Bars: 500 nm. (F) CLEM images of a VMP1 KO cell expressing GFP-nsp3 and nsp4-mCherry. The right panel shows the boxed region in the left panel. Bars: left panel, 2 μm; middle and right panels, 500 nm. (GI) In FPP assays, time-lapse images show that most of the nsp4-mCherry puncta persist upon pK addition in digitonin-permeabilized control HeLa cells coexpressing nsp3/4 (G). In VMP1 KO HeLa cells, nsp4-mCherry is quickly digested upon pK treatment (H). Quantitative data are shown as mean ± SEM (Ctrl, n = 11; VMP1 KO, n = 13; I). Bars: 5 μm. (J and K) In FPP assays, nsp4-mCherry is resistant to pK treatment in VMP1 KO HeLa cells expressing WT GFP-VMP1, but not GFP-VMP1(G195R) (J). Quantitative data are shown as mean ± SEM (WT, n = 12; G195R, n = 16; G197R, n = 13; K). Bar: 5 μm.
Figure S2.
Figure S2.
Distinct roles of VMP1 and TMEM41B in DMV biogenesis, related to Fig. 3. (A) TEM analysis shows that when nsp3/4 are ectopically expressed, large number of DMVs (white arrow) are induced in control COS7 cells. In VMP1 KO COS7 cells, the zippered ER forms concentric membrane structures (red arrow) and only a few DMVs are generated. N, nucleus. Bars: left panel, 500 nm; right panel, 200 nm. (B–D) In FPP assays, time-lapse images show that most of the nsp4-mCherry puncta persist upon pK addition in digitonin-permeabilized control COS7 cells coexpressing nsp3/4 (C). In VMP1 KO COS7 cells, nsp4–mCherry is quickly digested upon pK treatment (D). Quantitative data are shown as mean ± SEM (Ctrl, n = 11; VMP1 KO, n = 12; B). Bars: 5 μm. (E and F) In FPP assays, similar to control HeLa cells, mCherry-nsp3 is digested by pK, while nsp4-GFP is resistant to pK in TMEM41B KO cells expressing nsp3/4 (E). Quantitative data are shown as mean ± SEM (n = 18; F). Bars: 5 μm. (G) In FPP assays, nsp4-mCherry is sensitive to pK treatment in VMP1 KO HeLa cells expressing GFP-VMP1(G197R). Bar: 5 μm. (H) Immunostaining with LC3 antibody shows that GFP-nsp3/nsp4-mCherry double positive foci are separate from LC3 puncta. Bars: 5 μm; insert, 2 μm. (I) TEM analysis demonstrates that clusters of DMVs are formed in both control and FIP200 KO HeLa cells coexpressing nsp3/4. N, nucleus. Bars: top panel, 500 nm; bottom panel, 200 nm. (J) TEM analysis demonstrates that clusters of DMVs are formed in both control and TG-treated HeLa cells coexpressing nsp3/4. N, nucleus. Bars: 200 nm. (K) Immunostaining shows that Flag-nsp3/nsp4-mCherry double-positive foci are induced normally in FIP200 KO HeLa cells. Bars: 5 μm; insert, 2 μm. (L) Immunostaining shows that Flag-nsp3/nsp4-mCherry double-positive foci are induced normally in TG-treated HeLa cells. TG, thapsigargin. Bars: 5 μm; insert, 2 μm.
Figure S3.
Figure S3.
VMP1 interacts with nsp3 and nsp4, related to Figs. 4 and 5. (A) Immunostaining reveals that Myc-VMP1 colocalizes with GFP-nsp3 on the ER. Bars: 500 nm; insert, 200 nm. (B) Immunostaining reveals that Myc-VMP1 colocalizes with nsp4-GFP on the ER. Bars: 500 nm; insert, 200 nm. (C) Immunostaining reveals that Strep-TMEM41B colocalizes with GFP-nsp3 on the ER. Bars: 500 nm; insert, 200 nm. (D) Immunostaining reveals that Strep-TMEM41B colocalizes with nsp4-GFP on the ER. Bars: 500 nm; insert, 200 nm. (E) OptiPrep membrane flotation analysis of cells coexpressing GFP-nsp3 and nsp4-mCherry. PNS, post-nuclear supernatant. (F) In a GFP-Trap assay, endogenous VMP1 is immunoprecipitated by GFP-nsp3 or nsp4-GFP. (G) In a GFP-Trap assay, levels of Flag-nsp4 immunoprecipitated by GFP-VMP1 with the G195R mutation are increased, compared with WT GFP-VMP1. (H) In a GFP-Trap assay, levels of Flag-nsp3 immunoprecipitated by GFP-VMP1 or GFP-VMP1(G195R) are comparable. (I) Immunostaining reveals that GFP-VMP1(G195R) accumulates at the sites of Flag-nsp3/nsp4-mCherry puncta, as indicated by arrows. Bars: 500 nm; insert, 200 nm. (J) In a GFP-Trap assay, levels of nsp4-mCherry immunoprecipitated by GFP-nsp3 are comparable in control and Myc-VMP1-overexpressing cells. (K and L) The size of enlarged hypodermal LDs (arrows) in epg-3 mutant worms is dramatically reduced by pssy-1(RNAi) (K). Quantitative data are shown as mean ± SD (N2, n = 505; epg-3, n = 878; L). ****, P < 0.0001. Bars: 10 μm. (M) Quantitative PCR results show that the transcription of PTDSS1 or PTDSS2 is efficiently suppressed in siPTDSS1 or siPTDSS2 cells, respectively. mRNA levels of PTDSS1 and PTDSS2 are normalized by ACTB levels. (N) Immunoblotting results demonstrate that levels of p62 and LC3-I/II remain unchanged after single or double knock down of PTDSS1 and PTDSS2 in control and VMP1 KO HeLa cells. Source data are available for this figure: SourceData FS3.
Figure 4.
Figure 4.
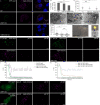
VMP1 binds to nsp3 and nsp4. (AC) Immunostaining reveals that GFP-VMP1 (A), TMEM41B-GFP (B), and endogenous VMP1 (C) weakly accumulate at the Flag-nsp3/nsp4-mCherry+ punctate structures, as indicated by arrows. Bars: 500 nm; inserts, 200 nm. (D) In a GFP-Trap assay, Flag–nsp3 or Flag-nsp4 is immunoprecipitated by GFP-VMP1. (E) In a GFP-Trap assay, Flag-nsp4, but not Flag–nsp3 is immunoprecipitated by TMEM41B-GFP. (F) Schematic of the topology of VMP1, and the structures of the VMP1 truncations. The positions of G195R and G197R are indicated by yellow squares. (G) In a GFP-Trap assay, Flag-nsp3 is immunoprecipitated by WT GFP-VMP1, GFP-VMP1(1-272), or GFP-VMP1(1-295), but not GFP-VMP1(1-131). (H) In a GFP-Trap assay, Flag–nsp4 is immunoprecipitated by WT GFP-VMP1, GFP-VMP1(1-272), or GFP-VMP1(1-295), but not GFP-VMP1(1-131). (I) In a GFP-Trap assay, levels of nsp4-mCherry immunoprecipitated by GFP-nsp3 are comparable between control and VMP1 KO HeLa cells. (J) In a GFP-Trap assay, levels of Flag-nsp4 immunoprecipitated by GFP-nsp3 are greatly reduced in TMEM41B KO HeLa cells, compared with control cells. (K) In a GFP-Trap assay, levels of nsp4-mCherry immunoprecipitated by GFP-nsp3 are dramatically increased in Flag-TMEM41B-overexpressing HeLa cells, compared with control cells. Source data are available for this figure: SourceData F4.
Figure 5.
Figure 5.
siPTDSS1 reverses the DMV defects in VMP1-depleted cells. (A and B) The enlarged LD phenotype in siVMP1 cells is suppressed by siPTDSS1, but not siPTDSS2. siPTDSS2 alone causes bigger LDs, compared with control cells (A). Quantitative data are shown as mean ± SD (NC, n = 54; siPTDSS1, n = 55; siPTDSS2, n = 53; siVMP1, n = 52; siVMP1&siPTDSS1, n = 50; siVMP1&siPTDSS1, n = 52; B). ****, P < 0.0001; N.S., not significant. Bars: 5 μm. (C) Compared with NC-treated VMP1 KO cells, concentric membrane structures (red arrows) are reduced and the formation of DMVs (white arrow) is increased after siPTDSS1. N, nucleus. Bars: 200 nm. (D–F) In FPP assays, nsp4–mCherry immediately disappears upon pK addition in NC-treated VMP1 KO cells (D), while nsp4-mCherry shows partial resistance to pK treatment after knocking down of PTDSS1 (E). Quantitative data are shown as mean ± SEM (NC, n = 18; siPTDSS1, n = 12; F). Bars: 5 μm. (G) The proposed model of the roles of VMP1 and TMEM41B in DMV biogenesis. Once β-coronaviruses enter the cell, the polyprotein containing nsp3 and nsp4 is translated, and then cleaved into individual proteins by viral genome-encoded proteases. The host ER protein TMEM41B facilitates the binding of nsp3 and nsp4 to each other through their luminal domains. This leads to the separation of nsp3 and nsp4 and their concentration on the opposite sides of the ER by unknown mechanisms. nsp3/4 interaction and separation drive the zippering and bending of the ER. The paired ER finally closes into vesicles, possibly regulated by VMP1-modulated PS distribution.

Similar articles

Cited by

References

    1. Baggen, J., Persoons L., Vanstreels E., Jansen S., Van Looveren D., Boeckx B., Geudens V., De Man J., Jochmans D., Wauters J., et al. . 2021. Genomewide CRISPR screening identifies TMEM106B as a proviral host factor for SARS-CoV-2. Nat. Genet. 53:435–444. 10.1038/s41588-021-00805-2 - DOI - PubMed
    1. Cortese, M., Santarella-Mellwig R., Schorb M., Boermel M., Mocaer K., Beckwith M.S., Templin R.M., Gross V., Pape C., Tischer C., et al. . 2020. Integrative imaging reveals SARS-CoV-2-induced reshaping of subcellular morphologies. Cell Host Microbe. 28:853–866.e5. 10.1016/j.chom.2020.11.003 - DOI - PMC - PubMed
    1. Das Sarma, J., Scheen E., Seo S.H., Koval M., and Weiss S.R.. 2002. Enhanced green fluorescent protein expression may be used to monitor murine coronavirus spread in vitro and in the mouse central nervous system. J. Neurovirol. 8:381–391. 10.1080/13550280260422686 - DOI - PMC - PubMed
    1. Ding, X., Yang W., Shi X., Du P., Su L., Qin Z., Chen J., and Deng H.. 2011. TNF receptor 1 mediates dendritic cell maturation and CD8 T cell response through two distinct mechanisms. J. Immunol. 187:1184–1191. 10.4049/jimmunol.1002902 - DOI - PMC - PubMed
    1. Ghanbarpour, A., Valverde D.P., Melia T.J., and Reinisch K.M.. 2021. A model for a partnership of lipid transfer proteins and scramblases in membrane expansion and organelle biogenesis. Proc. Natl. Acad. Sci. USA. 118:e2101562118. 10.1073/pnas.2101562118 - DOI - PMC - PubMed

Publication types