

A Model for Estimating Biological Age From Physiological Biomarkers of Healthy Aging: Cross-sectional Study
- PMID: 35536617
- PMCID: PMC9131142
- DOI: 10.2196/35696
A Model for Estimating Biological Age From Physiological Biomarkers of Healthy Aging: Cross-sectional Study
Erratum in
-
Correction: A Model for Estimating Biological Age From Physiological Biomarkers of Healthy Aging: Cross-sectional Study.JMIR Aging. 2022 Jun 28;5(2):e40508. doi: 10.2196/40508. JMIR Aging. 2022. PMID: 35763795 Free PMC article.
Abstract
Background: Individual differences in the rate of aging and susceptibility to disease are not accounted for by chronological age alone. These individual differences are better explained by biological age, which may be estimated by biomarker prediction models. In the light of the aging demographics of the global population and the increase in lifestyle-related morbidities, it is interesting to invent a new biological age model to be used for health promotion.
Objective: This study aims to develop a model that estimates biological age based on physiological biomarkers of healthy aging.
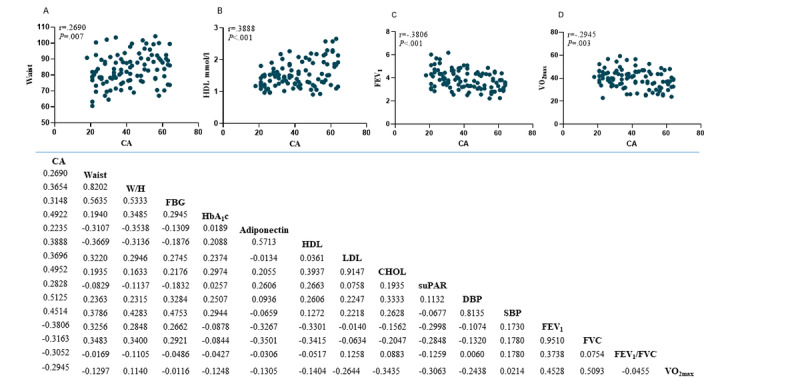
Methods: Carefully selected physiological variables from a healthy study population of 100 women and men were used as biomarkers to establish an estimate of biological age. Principal component analysis was applied to the biomarkers and the first principal component was used to define the algorithm estimating biological age.
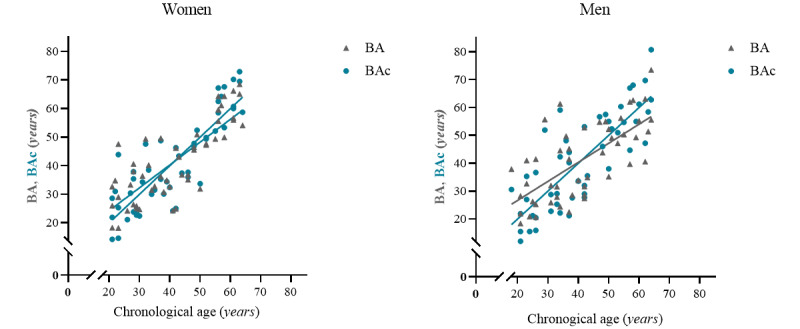
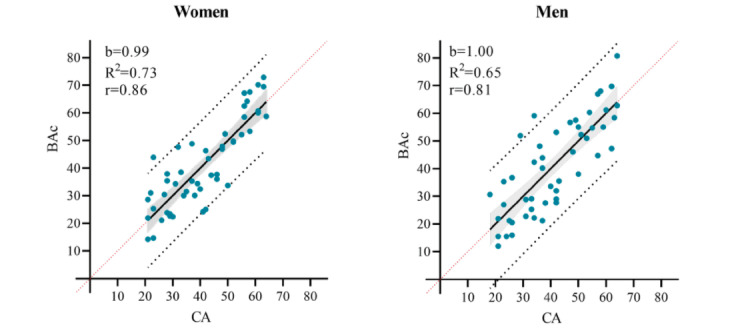
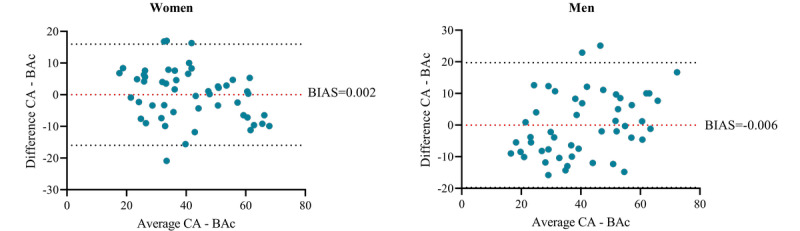
Results: The first principal component accounted for 31% in women and 25% in men of the total variance in the biological age model combining mean arterial pressure, glycated hemoglobin, waist circumference, forced expiratory volume in 1 second, maximal oxygen consumption, adiponectin, high-density lipoprotein, total cholesterol, and soluble urokinase-type plasminogen activator receptor. The correlation between the corrected biological age and chronological age was r=0.86 (P<.001) and r=0.81 (P<.001) for women and men, respectively, and the agreement was high and unbiased. No difference was found between mean chronological age and mean biological age, and the slope of the regression line was near 1 for both sexes.
Conclusions: Estimating biological age from these 9 biomarkers of aging can be used to assess general health compared with the healthy aging trajectory. This may be useful to evaluate health interventions and as an aid to enhance awareness of individual health risks and behavior when deviating from this trajectory.
Trial registration: ClinicalTrials.gov NCT03680768; https://clinicaltrials.gov/ct2/show/NCT03680768.
International registered report identifier (irrid): RR2-10.2196/19209.
Keywords: aging; biological age; biomarkers; healthy aging; model development; principal component analysis.
©Karina Louise Skov Husted, Andreas Brink-Kjær, Mathilde Fogelstrøm, Pernille Hulst, Akita Bleibach, Kaj-Åge Henneberg, Helge Bjarup Dissing Sørensen, Flemming Dela, Jens Christian Brings Jacobsen, Jørn Wulff Helge. Originally published in JMIR Aging (https://aging.jmir.org), 10.05.2022.
Conflict of interest statement
Conflicts of Interest: None declared.
Figures

References
-
- Levine ME, Crimmins EM. A comparison of methods for assessing mortality risk. Am J Hum Biol. 2014 Aug 04;26(6):768–76. doi: 10.1002/ajhb.22595. http://europepmc.org/abstract/MED/25088793 - DOI - PMC - PubMed
-
- Kang YG, Suh E, Lee J, Kim DW, Cho KH, Bae C. Biological age as a health index for mortality and major age-related disease incidence in Koreans: National Health Insurance Service - Health screening 11-year follow-up study. Clin Interv Aging. 2018;13:429–436. doi: 10.2147/CIA.S157014. doi: 10.2147/CIA.S157014.cia-13-429 - DOI - PMC - PubMed
-
- Waziry R, Gras L, Sedaghat S, Tiemeier H, Weverling GJ, Ghanbari M, Klap J, de Wolf F, Hofman A, Ikram MA, Goudsmit J. Quantification of biological age as a determinant of age-related diseases in the Rotterdam Study: a structural equation modeling approach. Eur J Epidemiol. 2019 Aug 13;34(8):793–799. doi: 10.1007/s10654-019-00497-3.10.1007/s10654-019-00497-3 - DOI - PubMed
-
- Levine ME. Modeling the rate of senescence: can estimated biological age predict mortality more accurately than chronological age? J Gerontol A Biol Sci Med Sci. 2013 Jun;68(6):667–74. doi: 10.1093/gerona/gls233. http://europepmc.org/abstract/MED/23213031 gls233 - DOI - PMC - PubMed
Associated data
LinkOut - more resources
Full Text Sources
Other Literature Sources
Medical
Miscellaneous
