. 2022 Jun 15;132(12):e159500.
doi: 10.1172/JCI159500.

Favorable vaccine-induced SARS-CoV-2-specific T cell response profile in patients undergoing immune-modifying therapies

Affiliations

Favorable vaccine-induced SARS-CoV-2-specific T cell response profile in patients undergoing immune-modifying therapies

Martin Qui et al. J Clin Invest. .

Abstract

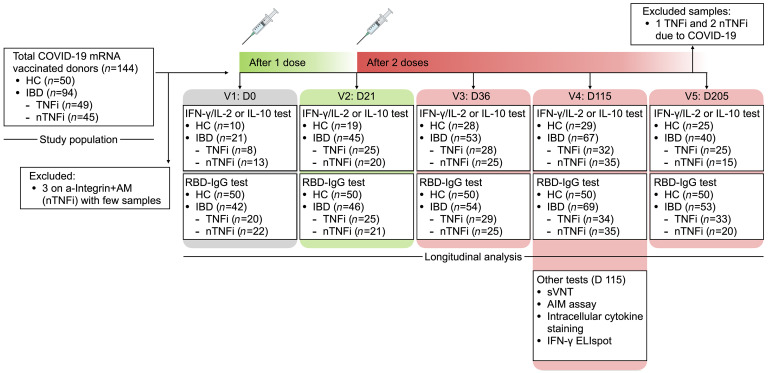
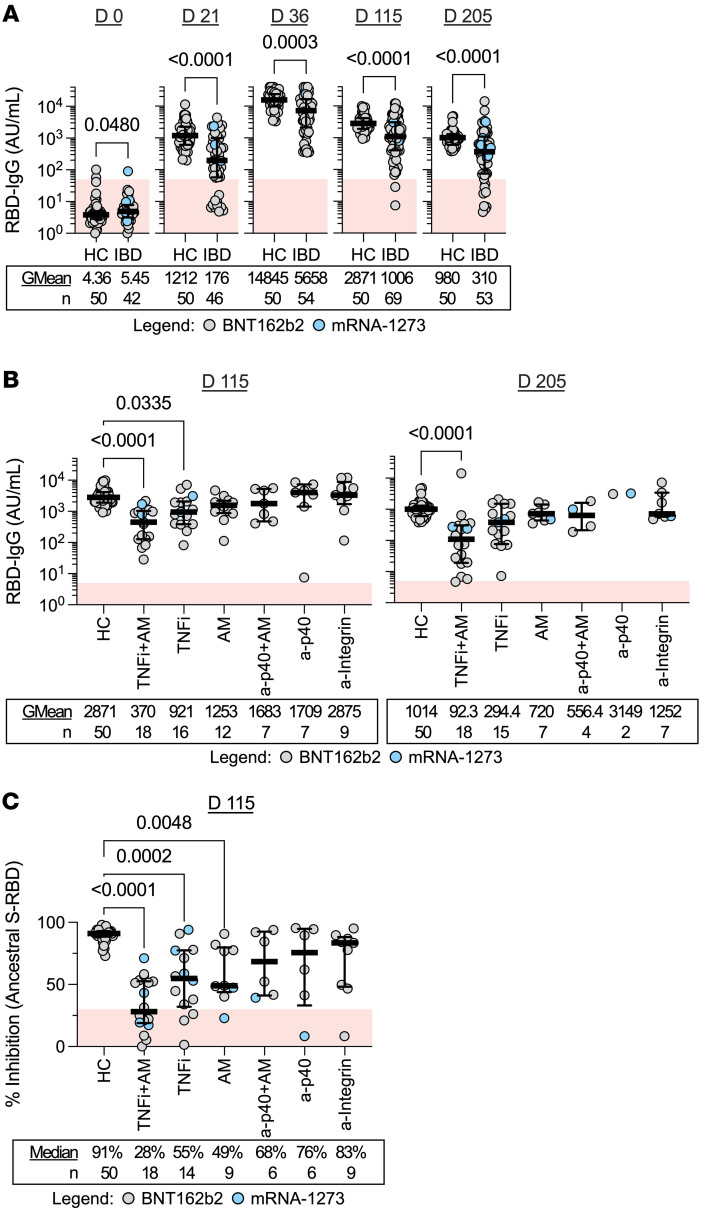
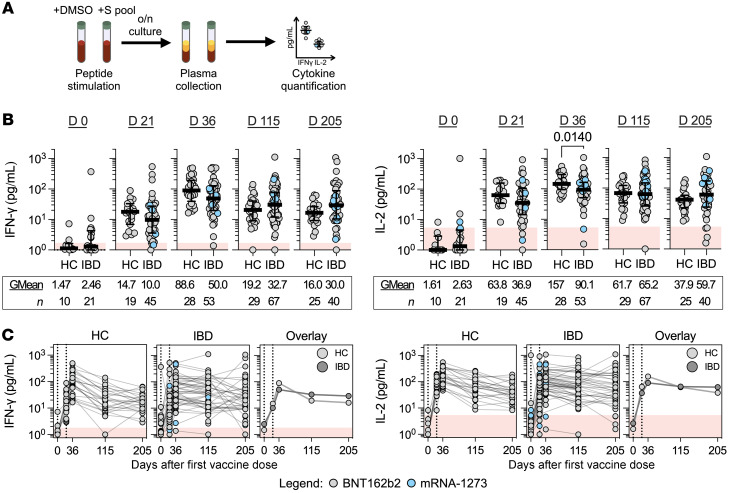
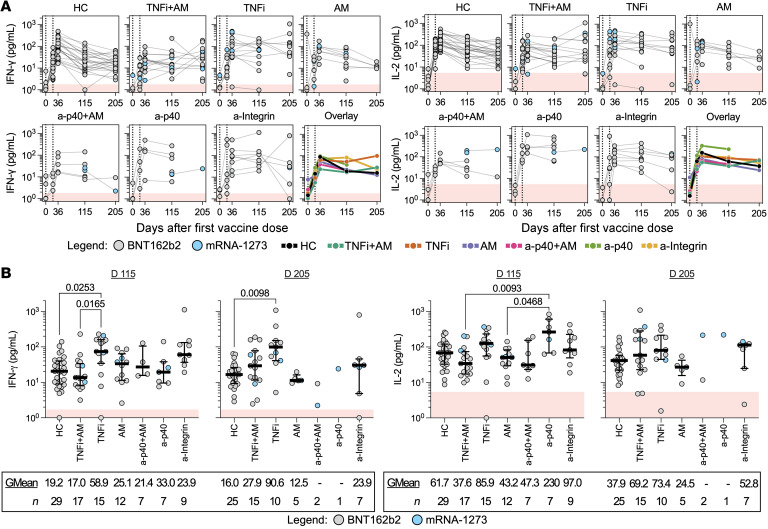
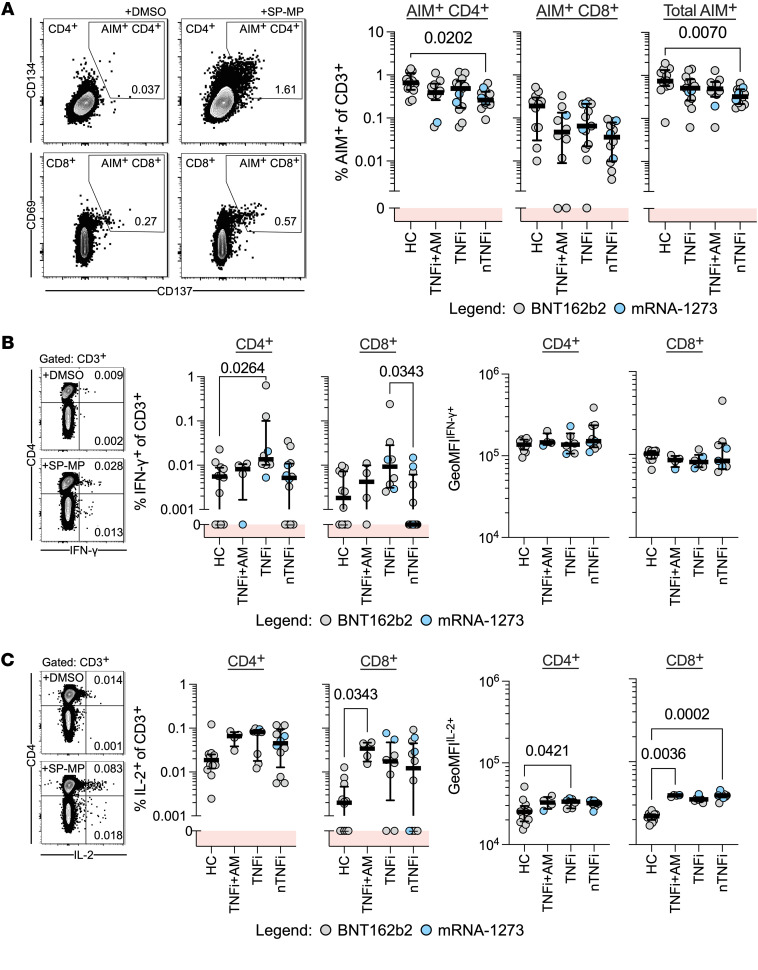
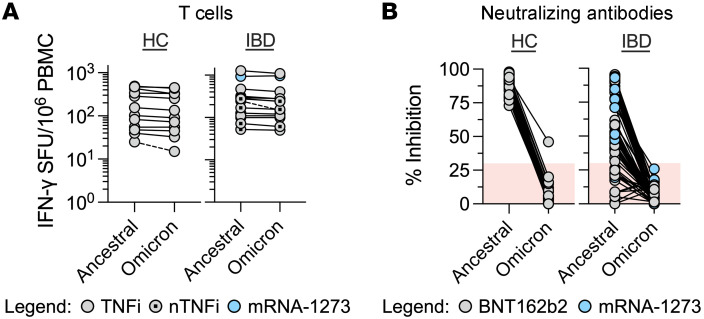
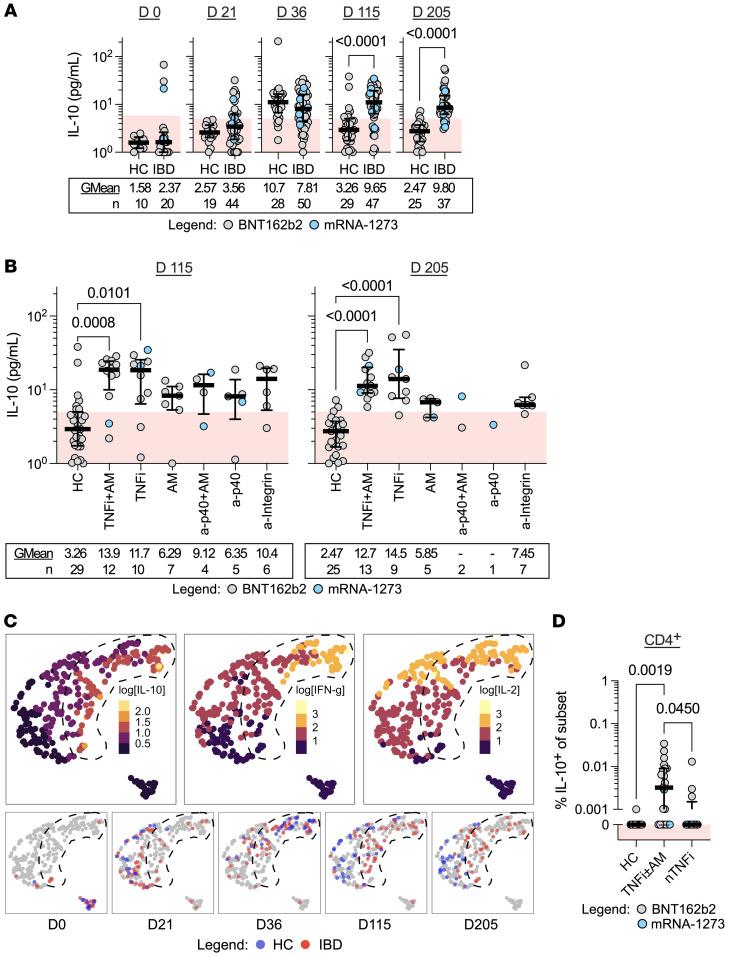
BACKGROUNDPatients undergoing immune-modifying therapies demonstrate a reduced humoral response after COVID-19 vaccination, but we lack a proper evaluation of the effect of such therapies on vaccine-induced T cell responses.METHODSWe longitudinally characterized humoral and spike-specific T cell responses in patients with inflammatory bowel disease (IBD), who were on antimetabolite therapy (azathioprine or methotrexate), TNF inhibitors, and/or other biologic treatment (anti-integrin or anti-p40) for up to 6 months after completing 2-dose COVID-19 mRNA vaccination.RESULTSWe demonstrate that a spike-specific T cell response was not only induced in treated patients with IBD at levels similar to those of healthy individuals, but also sustained at higher magnitude for up to 6 months after vaccination, particularly in those treated with TNF inhibitor therapy. Furthermore, the spike-specific T cell response in these patients was mainly preserved against mutations present in SARS-CoV-2 B.1.1.529 (Omicron) and characterized by a Th1/IL-10 cytokine profile.CONCLUSIONDespite the humoral response defects, patients under immune-modifying therapies demonstrated a favorable profile of vaccine-induced T cell responses that might still provide a layer of COVID-19 protection.FUNDINGThis study was funded by the National Centre for Infectious Diseases (NCID) Catalyst Grant (FY2021ES) and the National Research Fund Competitive Research Programme (NRF-CRP25-2020-0003).

Keywords: COVID-19; Cellular immune response; Immunology; Immunotherapy; Inflammatory bowel disease.


Figures

Figure 1
Figure 1. Study design outline.
Peripheral blood samples from healthcare workers who were not on immune-modifying therapy and served as HCs or from patients with IBD on varying immunotherapies were collected for up to 5 study time points of interest. Humoral, cellular, and IL-10 responses were quantified longitudinally. Additional tests, including sVNT, AIM assay, intracellular cytokine staining, and IFN-γ ELIspot, were performed on a subset of donor samples obtained at the fourth study time point (day 115) for further analysis.
Figure 2
Figure 2. Humoral immunity is induced following COVID-19 mRNA vaccination.
(A) Dot plots with median (middle bar) and interquartile range (whiskers) of RBD IgG concentrations (AU/mL) from serum samples of the 2 study cohorts collected at different time points. (B) RBD IgG concentrations (AU/mL) from serum samples of HCs and patients with IBD grouped by treatment 3 and 6 months after completing their 2-dose vaccination. (C) Percentage inhibition measured by sVNT of the ancestral SARS-CoV-2 S-RBD from serum samples of HCs and patients with IBD grouped by treatment 3 months after completing their 2-dose vaccination. For all graphs, the shaded red region denotes the area under the threshold for a positive test. Statistical analyses were performed by (A) Wilcoxon’s signed-rank test or by (B and C) Kruskal-Wallis and Dunn’s test, with P values indicated above the comparison line when significant (P ≤ 0.05). Geometric means (GMean; AU/mL) or median inhibition and number of data points (n) are indicated below each group.
Figure 3
Figure 3. Cellular immunity is induced following COVID-19 mRNA vaccination.
(A) Overview of whole blood cytokine release assay for IFN-γ/IL-2 quantification. (B) Dot plots with median (middle bar) and interquartile range (whiskers) of IFN-γ or IL-2 concentrations (pg/mL) from S pool–stimulated whole-blood supernatants of the 2 study cohorts collected at different time points. Statistical analyses were performed by Wilcoxon’s signed-rank test, with P values indicated above the comparison line when significant (P ≤ 0.05). Geometric means (GMean; AU/mL) and number of data points (n) are indicated below each group. (C) Quantified IFN-γ or IL-2 concentrations (pg/mL) plotted against time, faceted by the 2 study cohorts. Data points originating from the same participant are connected by gray lines. Data are summarized in the “Overlay,” plot with lines connecting the geometric means of each group at each sampling interval. For all graphs, shaded red regions denote the area under the threshold for a positive test.
Figure 4
Figure 4. Durable T cell responses are demonstrated by patients under different immunotherapies.
(A) Quantified IFN-γ or IL-2 concentrations (pg/mL) plotted against days after first vaccine dose for both HCs and patients with IBD grouped by treatment. Data points originating from the same participant are connected by gray lines. Data are summarized in the “Overlay,” plot with lines connecting the geometric means of each group at each sampling interval. (B) Dot plots with median (middle bar) and interquartile range (whiskers) of quantified IFN-γ or IL-2 concentrations (pg/mL) from S pool–stimulated whole-blood supernatants of HCs and patients with IBD grouped by treatment 3 and 6 months after completing their 2-dose vaccination. Statistical analyses were performed by Kruskal-Wallis and Dunn’s test, with P values shown above the comparison lines when significant (P ≤ 0.05). Geometric means (GMean; AU/mL) and number of data points (n) are indicated below each group. For all graphs, the shaded red region denotes the area under the threshold for a positive test.
Figure 5
Figure 5. Spike-specific T cells are activated and produce Th1 cytokines.
(A) Left: Representative flow cytometry plots from AIM assays identify CD4+CD134+CD137+ and CD8+CD69+CD137+ T cell populations with or without stimulation with spike peptides. Activated cells are defined by the drawn gate within each population. Right: Summary frequencies of AIM+ cells identified in PBMCs from HCs or patients with IBD 3 months after the second vaccine dose (HC, n = 12; TNFi+AM, n = 10; TNFi, n = 13; nTNFi, n = 12). (B and C) Intracellular cytokine staining for (B) IFN-γ+ or (C) IL-2+ T cell populations with or without stimulation with spike peptides. Representative flow cytometry plots and dot plots (with median and IQR) summaries of CD4+ or CD8+IFN-γ+ or IL-2+ frequencies of CD3+ cells and background-subtracted geometric mean fluorescence intensities (GeoMFIs) of IFN-γ+ or IL-2+ populations (HC, n = 12; TNFi, n = 8; TNFi+AM, n = 4; nTNFi, n = 12). Statistical analyses were performed by Kruskal-Wallis and Dunn’s test, with P values shown above the comparison lines when significant (P ≤ 0.05). For all graphs, the shaded red regions denote responses below background levels (denoted with 0).
Figure 6
Figure 6. Cellular but not humoral responses are mostly preserved against Omicron variant spike.
(A) Dot plots denoting the number of IFN-γ SFU per 106 PBMCs generated after ancestral and Omicron variant spike peptide stimulation in HCs or IBD donor groups (day 115). Each line connects paired responses from a single donor, with broken lines denoting a difference of more than 25% responses (HC, n = 12; TNFi or TNFi+AM [TNFi ± AM], n = 8; nTNFi, n = 6). (B) Dot plots denoting the percentage inhibition of binding of SARS-CoV-2 S-RBD to hACE2 by sVNT from donor sera (day 115). Each line connects paired responses from a single donor (HC, n = 50; IBD, n = 63). Shaded red regions denote data with negative result calls.
Figure 7
Figure 7. IL-10 delineates T cell cytokine response profile of individuals undergoing immune-modifying therapies.
(A and B) Dot plots with median (middle bar) and interquartile range (whiskers) (A) of IL-10 concentrations (pg/mL) from S pool–stimulated whole-blood supernatants of the 2 study cohorts collected at different time points and (B) of HCs and patients with IBD grouped by treatment 3 and 6 months after completing their 2-dose vaccination. Shaded red regions denote the area under the threshold for a positive test. Statistical analyses were performed by (A) Wilcoxon’s signed-rank test or (B) Kruskal-Wallis and Dunn’s test, with P values indicated above the comparison line when significant (P ≤ 0.05). Geometric means (GMean; AU/mL) and number of data points (n) are indicated below each group. (C) UMAP projections based on IL-10, IFN-γ, and IL-2 quantities measured from each donor time point. Images on the top row display each point filled according to log10-transformed cytokine quantities (pg/mL). Images on the bottom row display points filled according to study cohort at the respective time point. A shape is drawn enclosing a region mostly containing points with IL-10 values of greater than 10 pg/mL. (D) Dot plots with median (middle bar) and interquartile range (whiskers) of IL-10+CD4+ cell frequencies of CD4+ from HCs (n = 12) or donors with IBD on TNFi (with or without AM, n = 21) or nTNFi therapy (n = 12). Statistical analysis was performed by Wilcoxon’s signed-rank test, with P values indicated above the comparison line when significant (P ≤ 0.05). For all graphs, the shaded red region denotes responses below background levels (denoted with 0).

References

    1. Turner D, et al. STRIDE-II: an update on the selecting therapeutic targets in inflammatory bowel disease (STRIDE) initiative of the international organization for the study of IBD (IOIBD): determining therapeutic goals for treat-to-target strategies in IBD. Gastroenterology. 2021;160(5):1570–1583. doi: 10.1053/j.gastro.2020.12.031. - DOI - PubMed
    1. Alexander JL, et al. SARS-CoV-2 vaccination for patients with inflammatory bowel disease: a British Society of Gastroenterology Inflammatory Bowel Disease section and IBD Clinical Research Group position statement. Lancet Gastroenterol Hepatol. 2021;6(3):218–224. doi: 10.1016/S2468-1253(21)00024-8. - DOI - PMC - PubMed
    1. Siegel CA, et al. SARS-CoV-2 vaccination for patients with inflammatory bowel diseases: recommendations from an international consensus meeting. Gut. 2021;70(4):635–640. doi: 10.1136/gutjnl-2020-324000. - DOI - PMC - PubMed
    1. Chen RE, et al. Reduced antibody activity against SARS-CoV-2 B.1.617.2 delta virus in serum of mRNA-vaccinated individuals receiving tumor necrosis factor-α inhibitors. Med (N Y) 2021;2(12):1327–1341. doi: 10.1016/j.medj.2021.11.004. - DOI - PMC - PubMed
    1. Kennedy NA, et al. Infliximab is associated with attenuated immunogenicity to BNT162b2 and ChAdOx1 nCoV-19 SARS-CoV-2 vaccines in patients with IBD. Gut. 2021;70(10):1884–1893. doi: 10.1136/gutjnl-2021-324789. - DOI - PubMed

Publication types