. 2022 Jun 15;132(12):e149371.
doi: 10.1172/JCI149371.

Caffeine intake exerts dual genome-wide effects on hippocampal metabolism and learning-dependent transcription

Affiliations

Caffeine intake exerts dual genome-wide effects on hippocampal metabolism and learning-dependent transcription

Isabel Paiva et al. J Clin Invest. .

Abstract

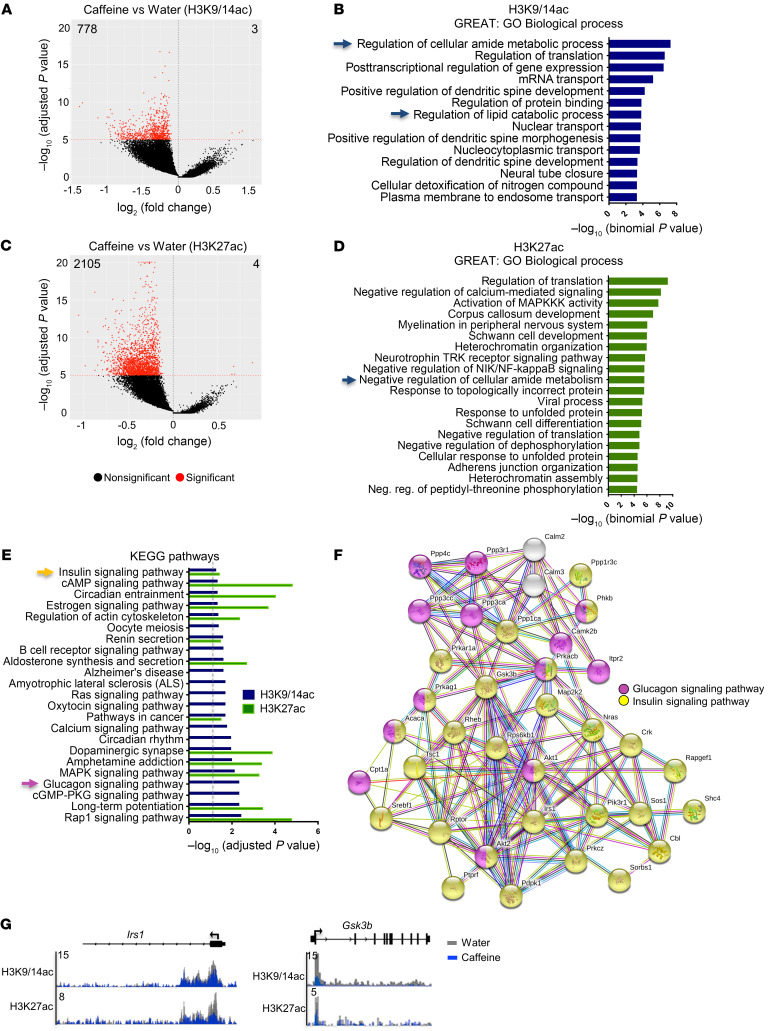
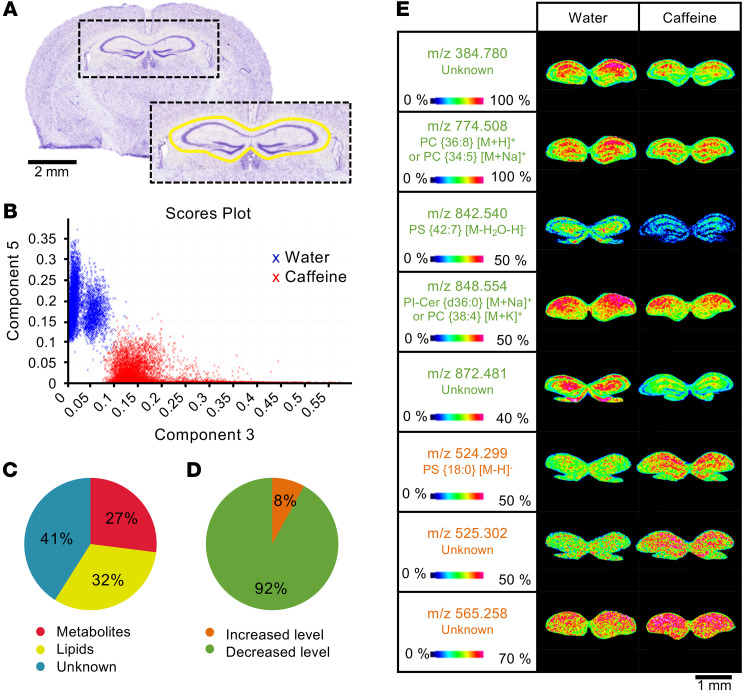
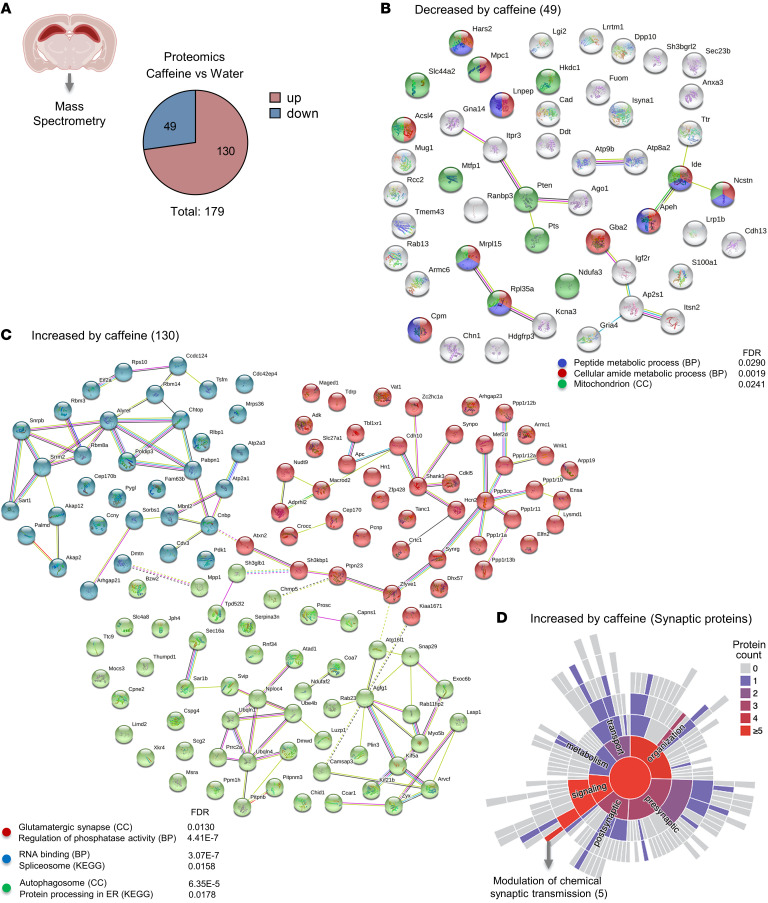
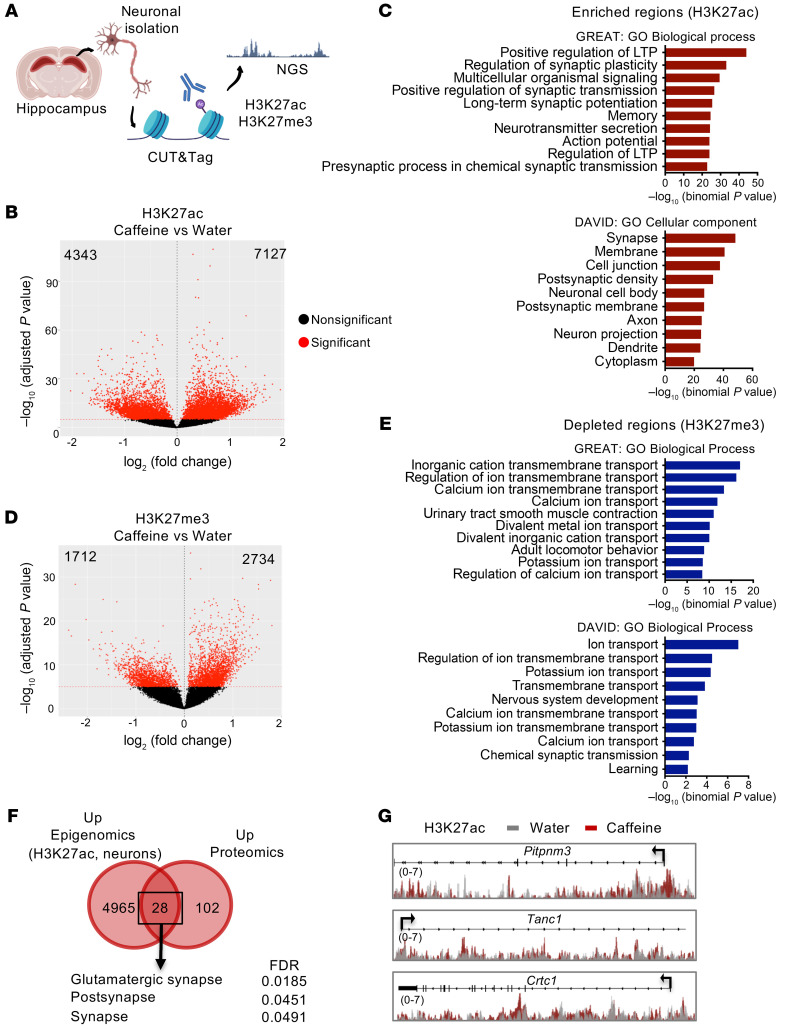
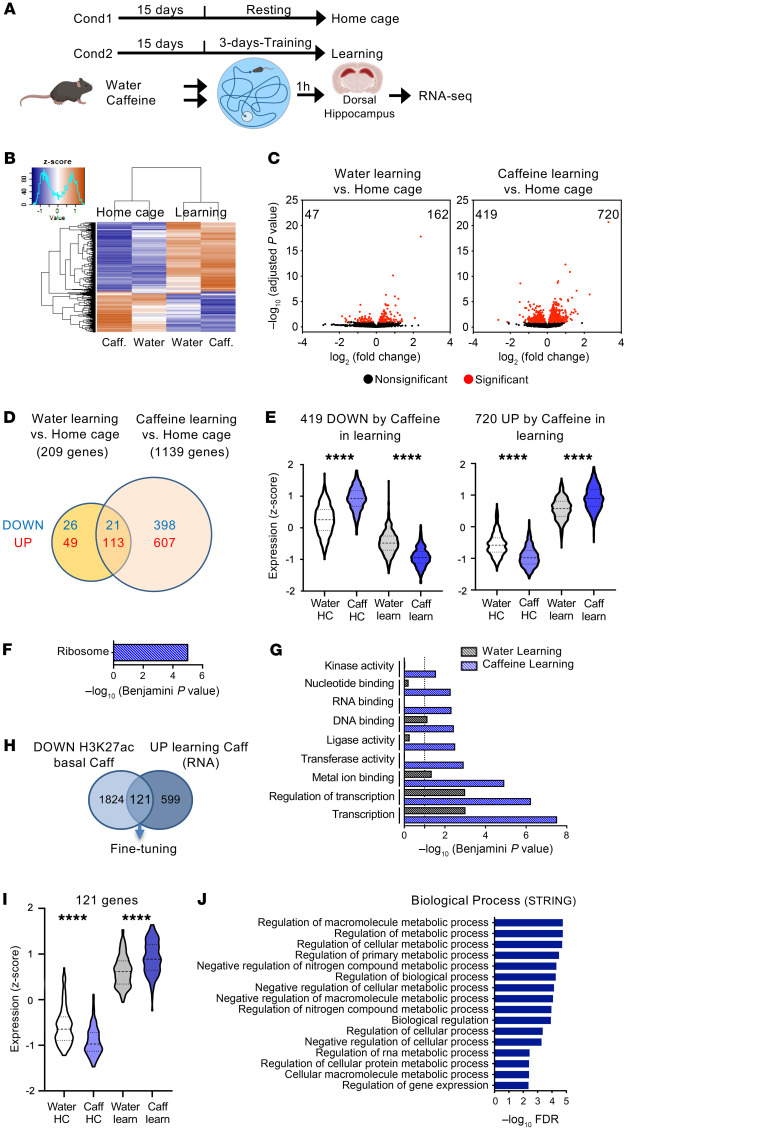
Caffeine is the most widely consumed psychoactive substance in the world. Strikingly, the molecular pathways engaged by its regular consumption remain unclear. We herein addressed the mechanisms associated with habitual (chronic) caffeine consumption in the mouse hippocampus using untargeted orthogonal omics techniques. Our results revealed that chronic caffeine exerts concerted pleiotropic effects in the hippocampus at the epigenomic, proteomic, and metabolomic levels. Caffeine lowered metabolism-related processes (e.g., at the level of metabolomics and gene expression) in bulk tissue, while it induced neuron-specific epigenetic changes at synaptic transmission/plasticity-related genes and increased experience-driven transcriptional activity. Altogether, these findings suggest that regular caffeine intake improves the signal-to-noise ratio during information encoding, in part through fine-tuning of metabolic genes, while boosting the salience of information processing during learning in neuronal circuits.

Keywords: Epigenetics; Memory; Neuroscience; Pharmacology.


Figures

Figure 1
Figure 1. Hippocampal epigenomic alterations associated with chronic caffeine consumption.
(A) Volcano plot showing the differentially enriched genomic regions of H3K9/14ac (ChIP-Seq) upon chronic caffeine treatment (778 decreased and 3 increased peaks, FDR < 1 × 10⁻⁵). (B) GREAT analysis showing the most-enriched biological processes associated with the H3K9/14ac-decreased peaks in caffeine-treated mice. Blue arrows indicate metabolic process– and translation-related terms. (C) Volcano plot representing the differentially regulated regions of H3K27ac upon chronic caffeine treatment (2105 decreased and 4 increased peaks, with FDR < 1 × 10⁻⁵). (D) GREAT analysis representing the most common biological processes associated with the H3K27ac-decreased peaks in the caffeine group. Regulation of metabolic processes is indicated by the blue arrow. (E) KEGG pathway analyses of depleted regions of both histone marks. Dashed gray line indicates adjusted P < 0.05. Yellow and pink arrows correspond to highlighted pathways in F. (F) Functional protein-protein network analysis (STRING) representation of insulin- and glucagon-related genes found to be decreased in both histone acetylation marks. (G) A representation of genomic regions using Integrative Genomics Viewer (IGV) of the metabolic genes Irs1 and Gsk3b, showing significant (FDR<10-5) decreases in H3K27ac and H3K9/14ac after caffeine treatment. Two biological replicates per histone mark were used for ChIP-Seq experiments.
Figure 2
Figure 2. Hippocampal metabolomic changes induced by chronic caffeine consumption.
(A) Unsupervised PCA performed in the hippocampal region of interest (indicated in yellow) on Nissl-stained brain tissue sections. Scale bar: 2 mm. (B) Scores from the unsupervised PCA in the hippocampus of water- and caffeine-treated mice are presented in a plot where the differences between the molecular signatures of the 2 experimental groups clearly emerge. Pie charts showing the distribution of the different classes of molecules (C) and the changes in their levels (D) based on m/z measured in positive or negative ionization modes, with a significant quantitative difference after Student’s t test analysis in the hippocampus of caffeine- compared with water-treated animals (n = 6/group). (E) MS images obtained at a spatial resolution of 35 μm for m/z resenting a decreased (green) or increased (orange) density in the hippocampus of caffeine- compared with water-treated mice. The color scale shows the intensity of the m/z of interest. Cer, ceramide; PC, phosphatidylcholine; PI, phosphatidylinositol; PS, phosphatidylserine. Scale bar: 1 mm.
Figure 3
Figure 3. Alteration of hippocampal proteomics induced by chronic caffeine consumption.
(A) Pie chart indicating proteins altered in the hippocampus of water- and caffeine-treated mice determined by MS analysis (n = 3/group). In total, 179 proteins were altered, of which 49 were decreased and 130 increased by chronic caffeine. (B) STRING network analysis of the 49 decreased proteins in the caffeine condition showing that they were associated with metabolism- and mitochondrion-related terms. (C) STRING network analysis of the 130 increased proteins by chronic caffeine revealing 3 major clusters (k-means). The cluster in red shows significance for glutamatergic synapse–related terms; the blue cluster represents proteins associated with RNA binding; the green, autophagosome-related pathways. BP, biological processes; CC, cellular component. (D) The SynGO ontologies and annotations (26) tool revealed that most of the synaptic proteins among the proteins increased by chronic caffeine are associated with synaptic signaling and modulation of chemical synaptic transmission. Warmer colors represent the predominance of proteins associated with the respective pathway.
Figure 4
Figure 4. Neuron-specific H3K27ac and H3K27me3 changes induced by chronic caffeine consumption.
(A) Schematic of the experimental design used to assess the active (H3K27ac) and repressive (H3K27me3) histone marks by the CUT&Tag technique in a hippocampal neuron-enriched population. NGS, next-generation sequencing. (B) Volcano plot representing H3K27ac differentially regulated regions (4343 depleted and 7127 enriched, FDR < 1 × 10⁻⁵). (C) Top: GREAT analysis showing the most-enriched biological processes associated with the H3K27ac-enriched peaks in caffeine-treated mice, primarily related to synaptic transmission. Bottom: DAVID Gene Ontology analysis revealing the most significant cellular components associated with H3K27ac-enriched regions. (D) Volcano plot showing H3K27me3 differentially regulated regions between the water- (control) and caffeine-treated mouse hippocampus (1712 depleted and 2734 enriched, FDR < 1 × 10⁻⁵). (E) Top: GREAT analysis showing that depleted regions are mostly associated with ion transport processes. Bottom: DAVID Gene Ontology analysis indicating the most significant biological processes associated with H3K27ac-enriched genes in neurons. (F) Venn diagram showing that 28 proteins were increased by caffeine and enriched in H3K27ac at their coding genes. These proteins are mostly associated with glutamatergic synapse (STRING analysis). (G) Representation (using IGV) of H3K27ac-enrichement of genomic regions at 3 genes in neurons from mice treated with water or chronic caffeine. Two biological replicates per histone mark were used for CUT&Tag experiments.
Figure 5
Figure 5. Hippocampal transcriptomic alterations induced by chronic caffeine consumption in learning conditions.
(A) Experimental procedure for the RNA-Seq experiments in the home cage and learning groups. After chronic consumption of caffeine (or water as a control), mice were subjected to 3 days of training in the MWM, and the dorsal hippocampus was dissected 1 hour after the last trial for RNA-Seq. Cond, condition. (B) Heatmap representation of RNA-Seq results (z score) in the 4 groups. A total of 4 biological replicates were used per group. Color coding was performed according to the z score of the normalized read counts divided by gene length. (C) Left: Volcano plots show the differentially expressed hippocampal genes (adjusted P < 0.1) between water-treated control learning and control home cage groups. Right: Volcano plot showing differentially expressed genes in caffeine-treated learning and home cage mice (adjusted P < 0.1). (D) Venn diagram showing the transcriptome changes induced by learning in water- and caffeine-treated animals (adjusted P < 0.1). (E) Violin plots representing expression values (z score) of the 419 genes downregulated and the 720 upregulated by caffeine (Caff) in learning (learn), showing opposite trends among the home cage (HC) groups. (F) KEGG pathway analysis showing that most of the genes downregulated by caffeine upon learning are associated with ribosome. (G) Functional annotation performed with DAVID, and significance for the effect of learning in water- and caffeine-treated animals. (H) Venn diagram revealing 121 genes depleted in H3K27ac (bulk hippocampus ChIP-Seq; DOWN) and upregulated (RNA; UP) by learning in caffeine-treated mice. (I) Violin plots of the expression values (z score) of the 121 genes. (J) Gene ontology analysis performed with STRING of the 121 genes, showing a strong association with metabolism-related biological processes (top 16 by FDR). Statistical significance in E and I was calculated by 1-way ANOVA followed by Bonferroni’s multiple-comparison post hoc test;****P < 0.0001.

Similar articles

Cited by

References

    1. Smith A. Effects of caffeine on human behavior. Food Chem Toxicol. 2002;40(9):1243–1255. doi: 10.1016/S0278-6915(02)00096-0. - DOI - PubMed
    1. Kim Y, et al. Coffee consumption and all-cause and cause-specific mortality: a meta-analysis by potential modifiers. Eur J Epidemiol. 2019;34(8):731–752. doi: 10.1007/s10654-019-00524-3. - DOI - PubMed
    1. Loftfield E, et al. Association of coffee drinking with mortality by genetic variation in caffeine metabolism: findings from the UK Biobank. JAMA Intern Med. 2018;178(8):1086–1097. doi: 10.1001/jamainternmed.2018.2425. - DOI - PMC - PubMed
    1. Freedman ND, et al. Association of coffee drinking with total and cause-specific mortality. N Engl J Med. 2012;366(20):1891–1904. doi: 10.1056/NEJMoa1112010. - DOI - PMC - PubMed
    1. Flaten V, et al. From epidemiology to pathophysiology: what about caffeine in Alzheimer’s disease? Biochem Soc Trans. 2014;42(2):587–592. doi: 10.1042/BST20130229. - DOI - PMC - PubMed

Publication types