. 2022 Jun 22;7(12):e157865.
doi: 10.1172/jci.insight.157865.

Tissue-localized immune responses in people with cystic fibrosis and respiratory nontuberculous mycobacteria infection

Affiliations

Tissue-localized immune responses in people with cystic fibrosis and respiratory nontuberculous mycobacteria infection

Don Hayes Jr et al. JCI Insight. .

Abstract

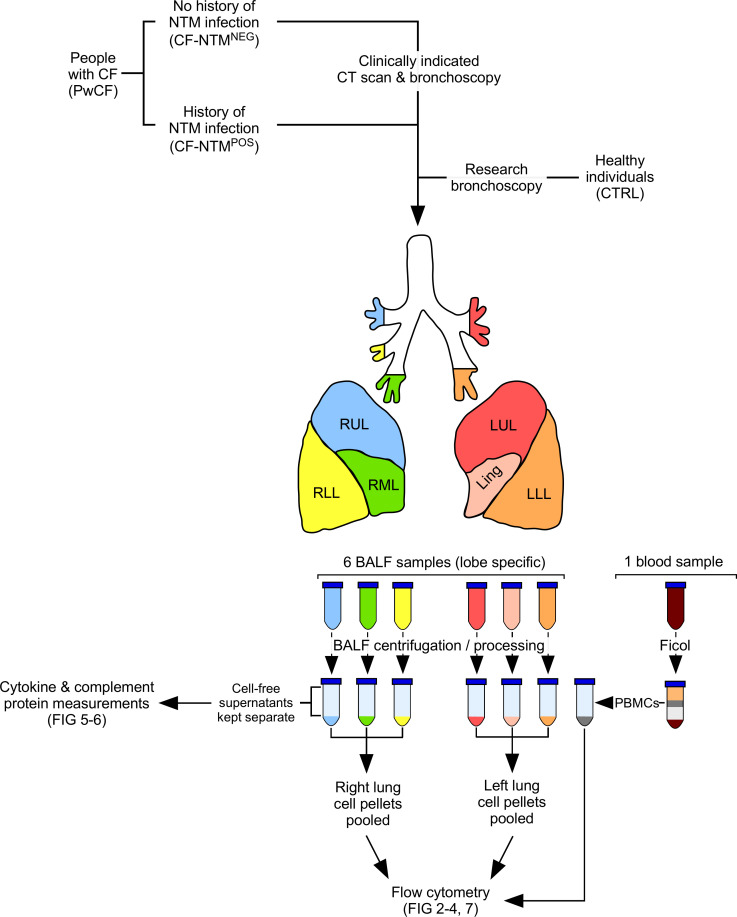
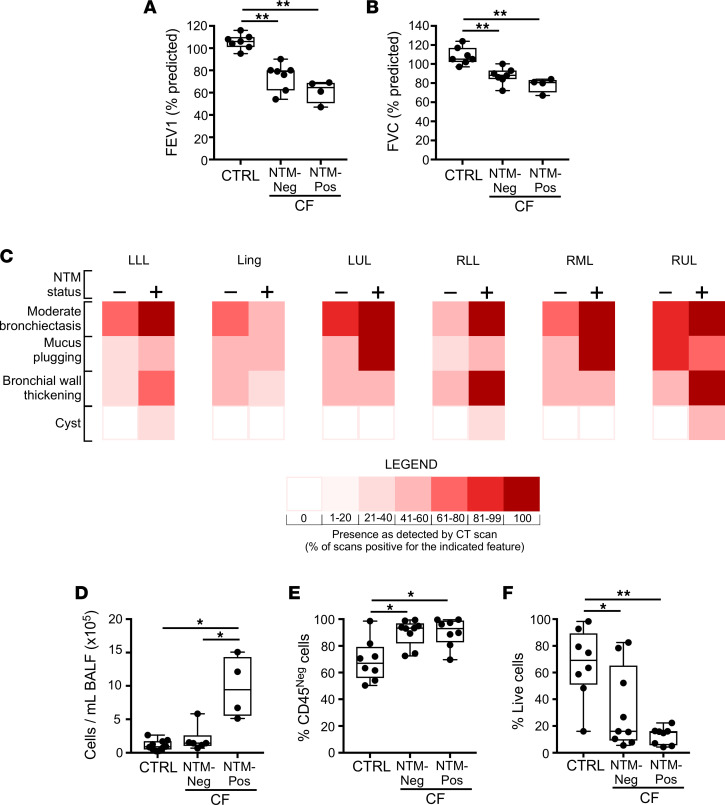
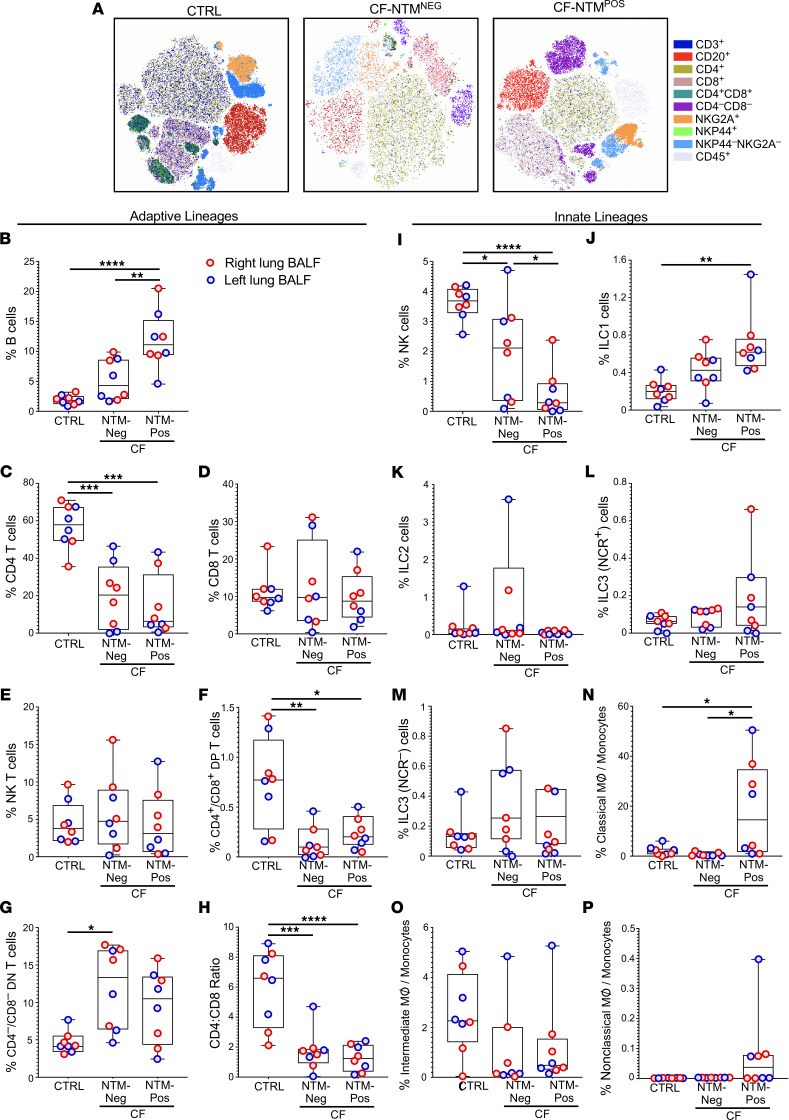
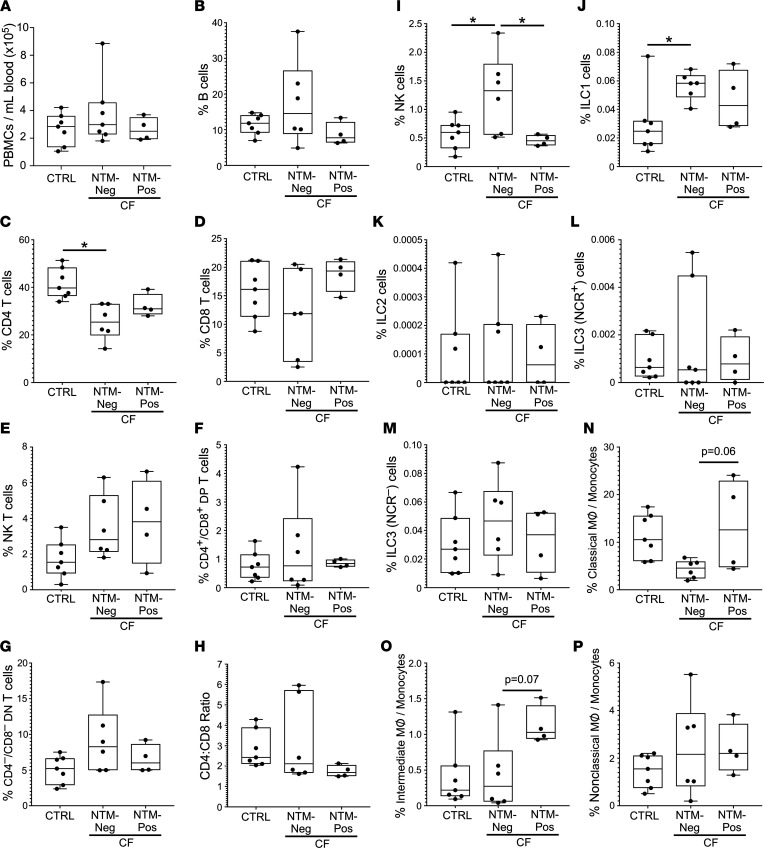
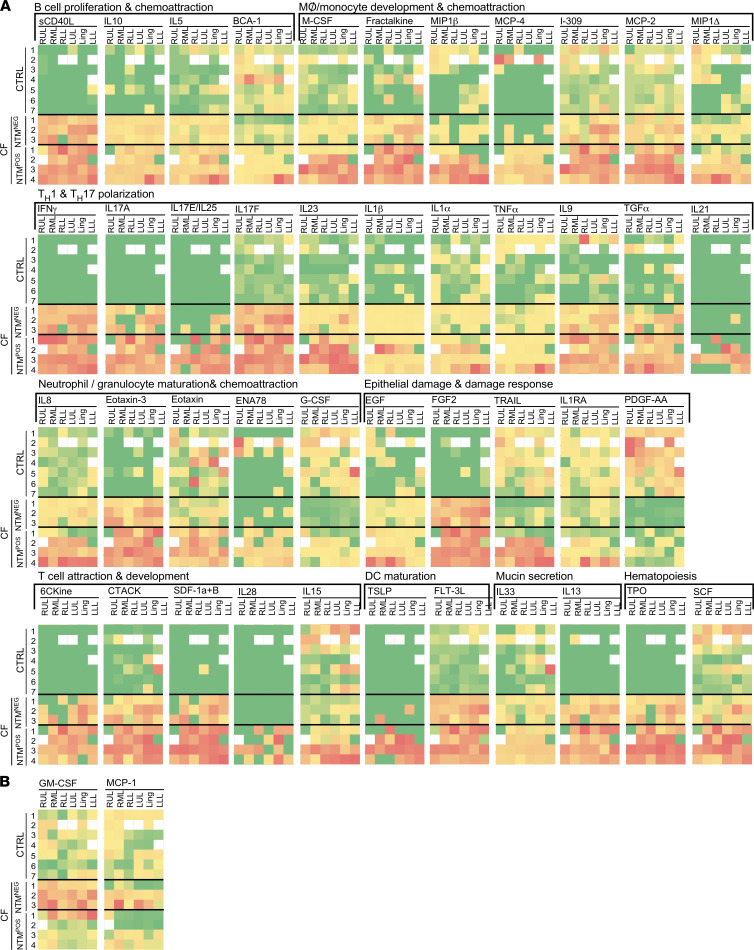
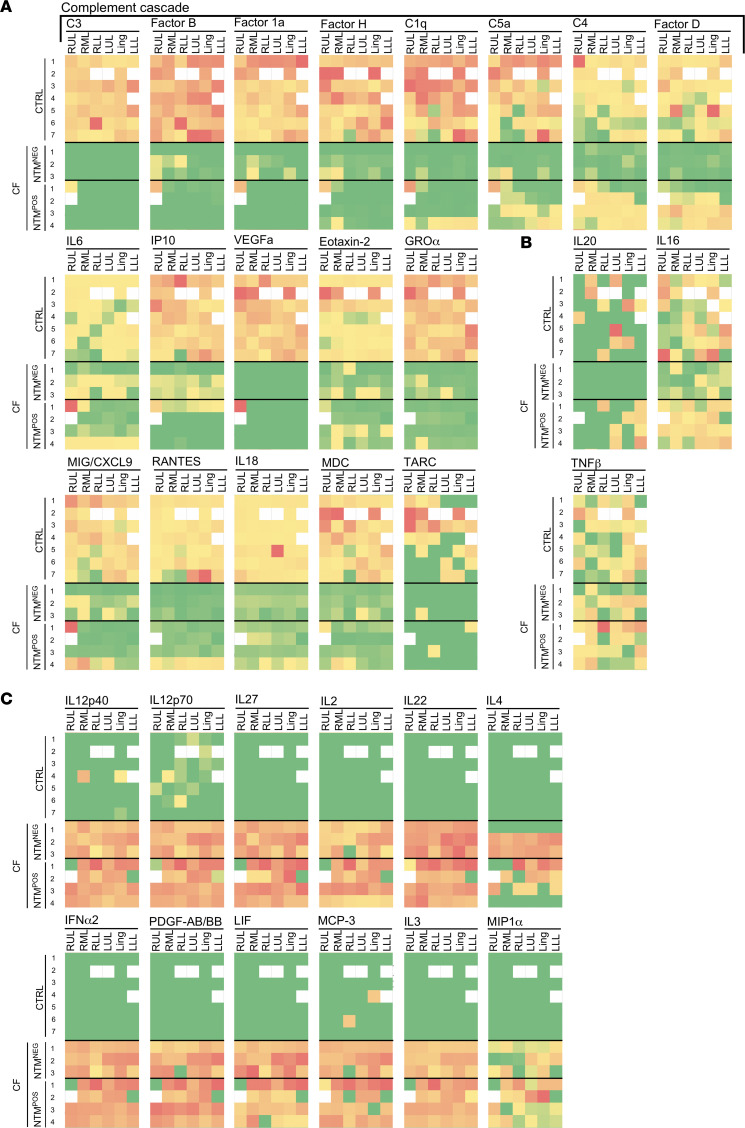
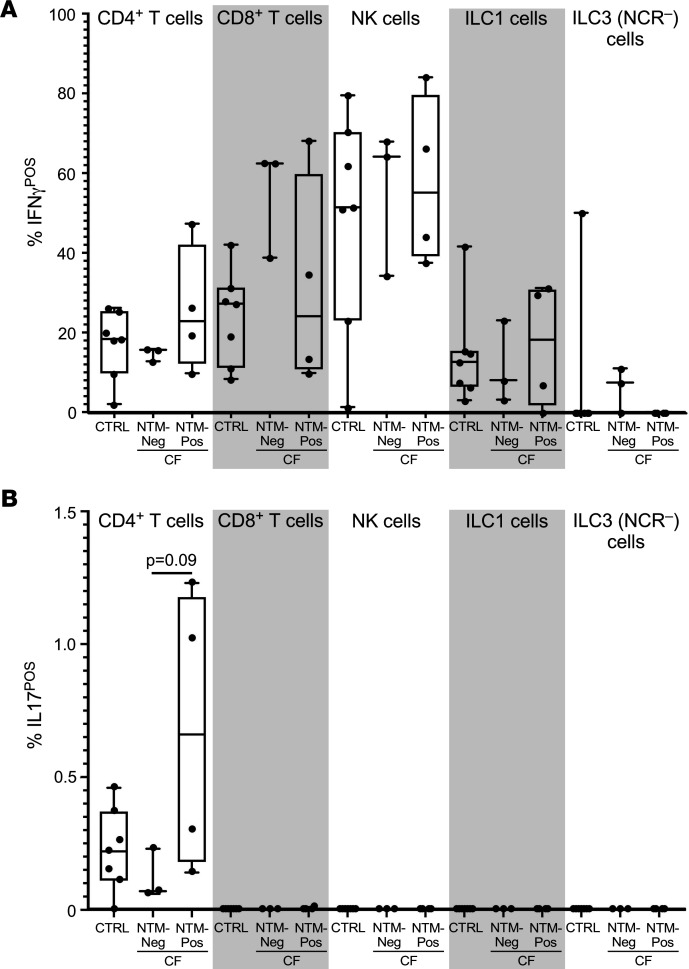
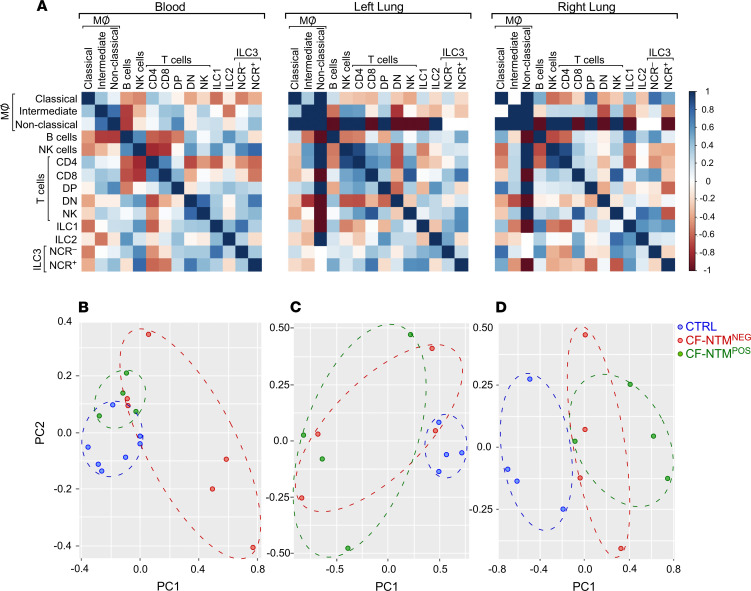
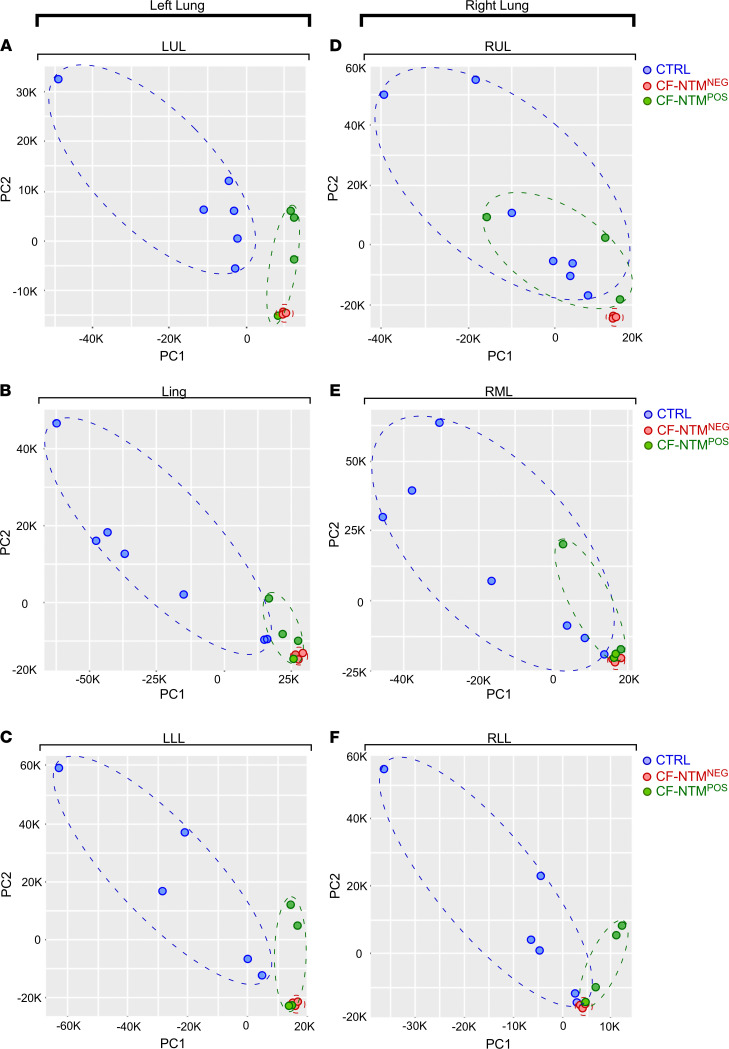
Nontuberculous mycobacteria (NTM) are an increasingly common cause of respiratory infection in people with cystic fibrosis (PwCF). Relative to those with no history of NTM infection (CF-NTMNEG), PwCF and a history of NTM infection (CF-NTMPOS) are more likely to develop severe lung disease and experience complications over the course of treatment. In other mycobacterial infections (e.g., tuberculosis), an overexuberant immune response causes pathology and compromises organ function; however, since the immune profiles of CF-NTMPOS and CF-NTMNEG airways are largely unexplored, it is unknown which, if any, immune responses distinguish these cohorts or concentrate in damaged tissues. Here, we evaluated lung lobe-specific immune profiles of 3 cohorts (CF-NTMPOS, CF-NTMNEG, and non-CF adults) and found that CF-NTMPOS airways are distinguished by a hyperinflammatory cytokine profile. Importantly, the CF-NTMPOS airway immune profile was dominated by B cells, classical macrophages, and the cytokines that support their accumulation. These and other immunological differences between cohorts, including the near absence of NK cells and complement pathway members, were enriched in the most damaged lung lobes. The implications of these findings for our understanding of lung disease in PwCF are discussed, as are how they may inform the development of host-directed therapies to improve NTM disease treatment.

Keywords: Bacterial infections; Cytokines; Infectious disease; Pulmonology; Tuberculosis.


Figures

Figure 1
Figure 1. Overview of our study and experimental design.
Adult individuals with CF and a history of being CF-NTMPOS and CF-NTMNEG consented to our study after having scheduled a clinically indicated CT scan and bronchoscopy. CTRL individuals likewise consented to a research bronchoscopy. All bronchoscopies were done by the same individual (author DH). At the time of the bronchoscopy, blood- and lobe-specific BALF samples from the RUL, RML, RLL, LUL, Ling, and LLL were collected and kept separate. Once BALF samples were centrifuged and otherwise processed in a laboratory, cell-free supernatants from each lobe were collected and frozen for downstream cytokine measurements (the data from which are shown in Figures 5 and 6). To have a sufficient number of cells for flow cytometry, cell pellets from the right lung lobes (RUL, RML, and RLL) were pooled, as were the cell pellets from the left lung lobes (LUL, Ling, and LLL). The right lung BALF cells, left lung BALF cells, and PBMCs of each individual were immediately used for phenotypic and functional flow cytometry analysis (the data from which are shown in Figures 2–4, and 7).
Figure 2
Figure 2. CF-NTMPOS lungs exhibit more tissue damage that is concentrated in the right and upper lobes.
(A and B) FEV1 and FVC were measured prior to bronchoscopy for each individual in our CTRL, CF-NTMNEG, and CF-NTMPOS cohorts. Shown are the mean percentage predicted FEV1 in A and the mean percentage predicted FVC values in B for each cohort. (C) CT scan findings for each lobe (LLL, Ling, LUL, RLL, RML, and RUL) based on an individual’s NTM cohort status (- or +). Colors represent the percent of individuals in that cohort who had the following features in the specified lobe: moderate bronchiectasis, mucus plugging, bronchial wall thickening, and 1 or more cysts. (DF) BALF from the same individuals was collected and used to prepare noncellular and cellular fractions (see Supplemental Figure 1), the latter of which were counted and stained with a viability dye and CD45-specific Ab. Shown are the total BALF cell counts in D and the CD45 frequency in E of each cohort, as well as the proportion of live BALF cells in each cohort in F. Bars represent mean ± SD; *P = 0.05, **P = 0.005 as determined by 1-way ANOVA.
Figure 3
Figure 3. CF-NTMPOS airways are distinguished by changes in multiple innate and adaptive immune lineage frequencies.
BALF cells from individuals in our 3 cohorts (CTRL, CF-NTMNEG, and CF-NTMPOS) were used for multidimensional flow cytometry analysis. (A) t-SNE analysis of the cumulative flow cytometry data from each cohort, wherein each cluster neighborhood represents a unique immune subset. Using the gating scheme shown in Supplemental Figure 2, we measured the frequencies of (B) B cells, (C) CD4 T cells, (D) CD8 T cells, (E) NKT cells, (F) CD4+CD8+ DP T cells, (G) CD4CD8 DN T cells, (H) CD4:CD8 T cell ratio, (I) NK cells, (J) ILC1 cells, (K) ILC2 cells, (L) ILC3 NCR+ cells, (M) ILC3 NCR cells, (N) classical MØ/monocytes, (O) intermediate MØ/monocytes, and (P) nonclassical MØ/monocytes. To observe general trends across cohorts, the data from right and left lung BALF are combined to generate each box and whisker plot; individual data points are, however, colored red or blue to indicate whether the data point originated from a right or left lung BALF, respectively. Asterisks indicate those group differences that were statistically significant as determined by 1-way ANOVA (*P < 0.05; **P < 0.005; ***P < 0.0005; ****P < 0.0001).
Figure 4
Figure 4. Circulating immune lineage frequencies are largely similar between individuals who are CF-NTMPOS and CF-NTMNEG.
Blood from individuals in each cohort was collected at the time of bronchoscopy and used to determine circulating immune subset frequencies, using the same flow cytometry panel and gating strategy as that used to determine airway immune subset frequencies. Shown for each cohort are (A) PBMC concentrations and frequencies of circulating (B) B cells, (C) CD4 T cells, (D) CD8 T cells, (E) NKT cells, (F) CD4+CD8+ DP T cells, and (G) CD4CD8 DN T cells, as well as (H) the ratio of CD4:CD8 T cells in the blood of each cohort. Likewise, shown are the frequencies of circulating (I) NK cells, (J) ILC1 cells, (K) ILC2 cells, (L) ILC3 (NCR+) cells, (M) ILC3 (NCR) cells, (N) classical MØ/monocytes, (O) intermediate MØ/monocytes, and (P) nonclassical MØ/monocytes. Closed circles represent individual donor data; box and whiskers, means with error bars at the minimum and maximum (*P < 0.05 by 1-way ANOVA).
Figure 5
Figure 5. CF-NTMPOS airways have high concentrations of cytokines that promote B cell growth, MØ/monocyte attraction, TH1/TH17 polarization, granulocyte attraction, and epithelial damage.
BALF samples from each lung lobe (RUL, RML, RLL, LUL, Ling, and LLL) were collected from individuals in each cohort and processed into cellular and noncellular fractions, the latter of which were used to measure the protein concentrations of multiple cytokines. Shown in heatmap format are those cytokines that distinguished CF-NTMPOS airways from CF-NTMNEG airways as determined by statistical analyses (Supplemental Figure 3), including (A) BALF cytokines that were higher in CF-NTMPOS airways relative to CF-NTMNEG airways, as well as (B) BALF cytokines that were lower in CF-NTMPOS airways relative to CF-NTMNEG airways. For each heatmap, rows represent data from a specified individual and columns represent data from the specified lung lobe. Since the concentration range for each cytokine is different, green and red represent the lower and higher values of a given concentration range, respectively, relative to the mean (yellow). White boxes represent samples for which there was an insufficient amount of material for cytokine measurement. Specific values for these same cytokine and sample data are shown in Supplemental Figure 3.
Figure 6
Figure 6. Complement pathway members are largely absent from the airways of PwCF, regardless of NTM infection history.
In a manner identical to that described in the previous figure, the concentrations of complement pathway members and multiple cytokines were determined and represented in heatmap format. Shown are (A) cytokines that were more concentrated in CF airways regardless of NTM infection history, relative to CTRL airways; (B) cytokines that were less concentrated in CF airways regardless of NTM infection history, relative to CTRL airways; and (C) cytokines that were present at equivalent concentrations in CF and CTRL airways. Specific values for these same cytokine and sample data are shown in Supplemental Figure 4.
Figure 7
Figure 7. Circulating lymphocytes from individuals who are CF-NTMNEG and CTRL-NTMPOS have similar IFNγ- and IL-17–producing capacity.
PBMCs from individuals in each study cohort (CTRL, CF-NTMNEG, and CTRL-NTMPOS) were stimulated in vitro and stained to identify 5 lymphocyte subsets (CD4+ T cells, CD8+ T cells, NK cells, ILC1, and ILC3) and quantify their production of IFNγ and IL-17. For each cohort and lymphocyte subset, the percentage of cells positive for (A) IFNγ or (B) IL-17 are shown. In each case, closed dots represent data from a given individual in the indicated cohort, with box and whiskers representing data from the entire cohort; significance was determined by 1-way ANOVA.
Figure 8
Figure 8. Cellular biomarker differences between individuals who are CF-NTMNEG and CF-NTMPOS are pronounced in the right lung segment.
Adaptive and innate immune subset frequency data from the blood, left lung, and right lung were analyzed via PCA to identify cellular correlates of CF status and NTM infection history status. (A) Correlation matrix of immune subset frequencies in blood, left lung, and right lung. (BD) PC scores for the first and second components of immune cell frequencies from (B) blood, (C) left lung, and (D) right lung.
Figure 9
Figure 9. Cytokine and complement biomarker differences between individuals who are CF-NTMNEG and CF-NTMPOS are pronounced in the RUL.
Lobe-specific cytokine and complement concentration data from all individuals in each cohort were analyzed via PCA to identify correlates of CF status and NTM infection history status. PCA scores for the first and second components of cytokine concentrations from the left lung lobes (A) LUL, (B) Ling, and (C) LLL, as well as the right lung lobes (D) RUL, (E) RML, and (F) RLL.

Similar articles

Cited by

References

    1. Shteinberg M, et al. Cystic fibrosis. Lancet. 2021;397(10290):2195–2211. doi: 10.1016/S0140-6736(20)32542-3. - DOI - PubMed
    1. Elborn JS, et al. Report of the European Respiratory Society/European Cystic Fibrosis Society task force on the care of adults with cystic fibrosis. Eur Respir J. 2016;47(2):420–428. doi: 10.1183/13993003.00592-2015. - DOI - PubMed
    1. Furukawa BS, Flume PA. Nontuberculous mycobacteria in cystic fibrosis. Semin Respir Crit Care Med. 2018;39(3):383–391. doi: 10.1055/s-0038-1651495. - DOI - PubMed
    1. Skolnik K, et al. Nontuberculous mycobacteria in cystic fibrosis. Curr Treat Options Infect Dis. 2016;8(4):259–274. doi: 10.1007/s40506-016-0092-6. - DOI - PMC - PubMed
    1. Qvist T, et al. Comparing the harmful effects of nontuberculous mycobacteria and Gram negative bacteria on lung function in patients with cystic fibrosis. J Cyst Fibros. 2016;15(3):380–385. doi: 10.1016/j.jcf.2015.09.007. - DOI - PMC - PubMed

Publication types

MeSH terms