

Development and Validation of a Novel Metabolic Signature-Based Prognostic Model for Uveal Melanoma
- PMID: 35536719
- PMCID: PMC9100464
- DOI: 10.1167/tvst.11.5.9
Development and Validation of a Novel Metabolic Signature-Based Prognostic Model for Uveal Melanoma
Abstract
Purpose: Uveal melanoma (UM) is the most common primary malignant tumor with poor prognosis. The role of metabolism-related genes in the prognosis of UM remains unrevealed. This study aimed to establish and validate a prognostic prediction model for UM based on metabolism-related genes.
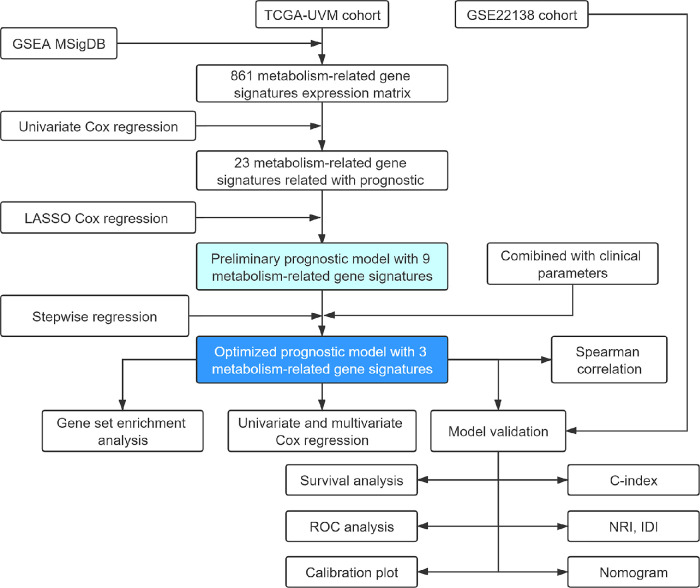
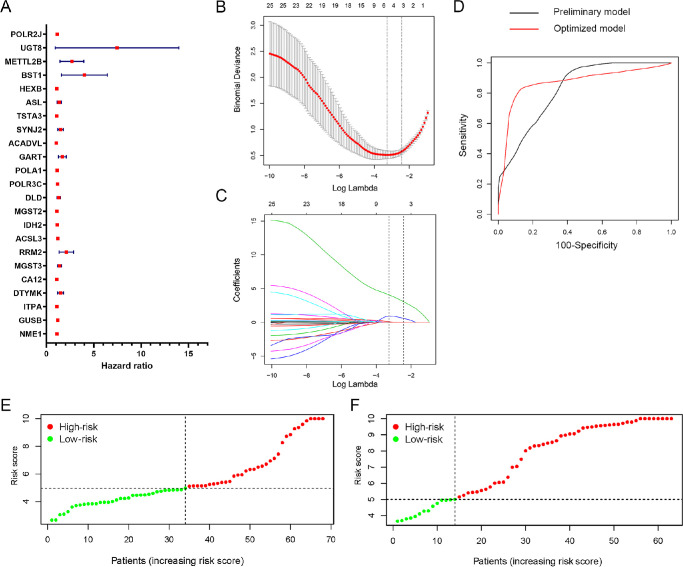
Methods: Gene expression profiles and clinicopathological information were downloaded from The Cancer Genome Atlas, and the Gene Expression Omnibus database. Univariable Cox regression, least absolute shrinkage and selection operator Cox regression, and stepwise regression were performed to establish the model. Kaplan-Meier survival analysis, receiver operating characteristic (ROC) curve analysis, and calibration and discrimination analyses were used to evaluate the prognostic model.
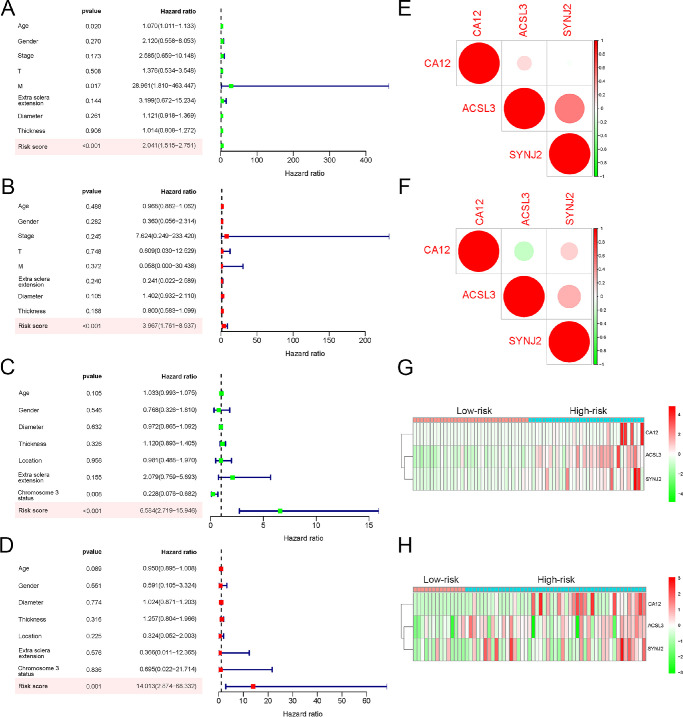
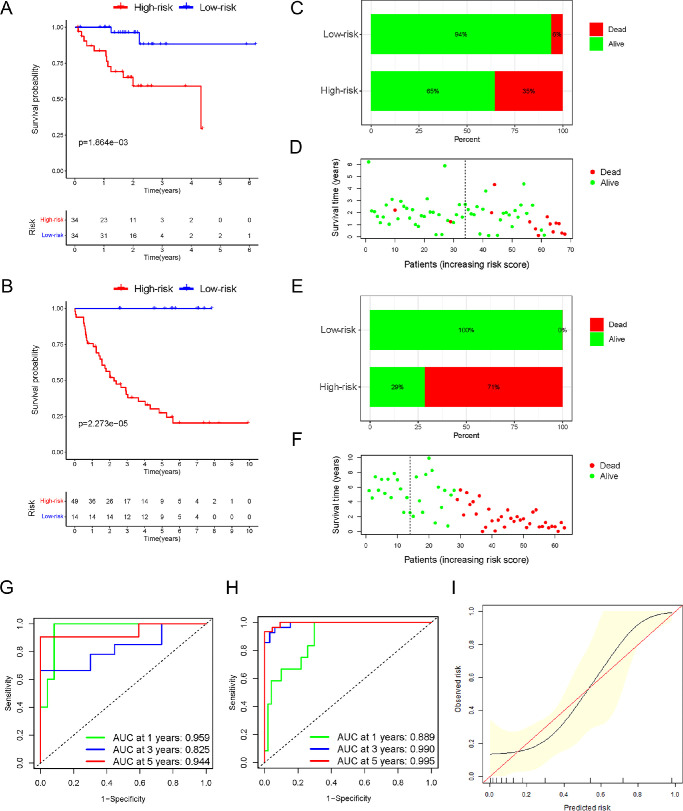
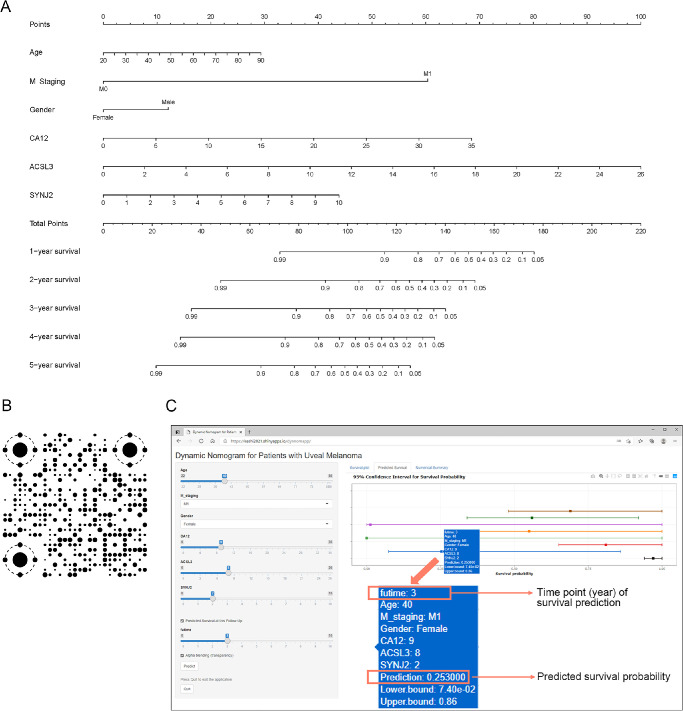
Results: Three metabolism-related genes, carbonic anhydrase 12, acyl-CoA synthetase long-chain family member 3, and synaptojanin 2, and three clinicopathological parameters (i.e., age, gender, and metastasis staging) were identified to establish the model. The risk score was found to be an independent prognostic factor for UM survival. High-risk patients demonstrated significantly poorer prognosis than low-risk patients. ROC analysis suggested the promising prognostic efficiency of the model. The calibration curve manifested satisfactory agreement between the predicted and observed risk. A nomogram and online survival calculator were developed to predict the survival probability.
Conclusions: The novel metabolism-based prognostic model could accurately predict the prognosis of UM patients, which facilitates the prediction of the survival probability by both ophthalmologists and patients with the online dynamic nomogram.
Translational relevance: The dynamic nomogram links gene expression profiles to clinical prognosis of UM and is useful to evaluate the survival probability.
Conflict of interest statement
Disclosure:
Figures
Similar articles
-
A Comprehensive Prognostic and Immunological Analysis of a Six-Gene Signature Associated With Glycolysis and Immune Response in Uveal Melanoma.Front Immunol. 2021 Sep 22;12:738068. doi: 10.3389/fimmu.2021.738068. eCollection 2021. Front Immunol. 2021. PMID: 34630418 Free PMC article.
-
Construction and validation of a novel prognostic signature for uveal melanoma based on five metabolism-related genes.Math Biosci Eng. 2021 Sep 15;18(6):8045-8063. doi: 10.3934/mbe.2021399. Math Biosci Eng. 2021. PMID: 34814288
-
Immunogenic profiling of metastatic uveal melanoma discerns a potential signature related to prognosis.J Cancer Res Clin Oncol. 2024 Jan 21;150(1):23. doi: 10.1007/s00432-023-05542-z. J Cancer Res Clin Oncol. 2024. PMID: 38246894 Free PMC article.
-
Integrative analysis identifies key genes related to metastasis and a robust gene-based prognostic signature in uveal melanoma.BMC Med Genomics. 2022 Mar 17;15(1):61. doi: 10.1186/s12920-022-01211-1. BMC Med Genomics. 2022. PMID: 35300699 Free PMC article.
-
Extracellular vesicles in uveal melanoma - Biological roles and diagnostic value.Cancer Lett. 2025 Apr 10;615:217531. doi: 10.1016/j.canlet.2025.217531. Epub 2025 Feb 4. Cancer Lett. 2025. PMID: 39914771 Review.
Cited by
-
Development and Validation of an Extracellular Matrix Gene Expression Signature for Prognostic Prediction in Patients with Uveal Melanoma.Int J Mol Sci. 2025 May 1;26(9):4317. doi: 10.3390/ijms26094317. Int J Mol Sci. 2025. PMID: 40362553 Free PMC article.
-
Nomogram of uveal melanoma as prediction model of metastasis risk.Heliyon. 2023 Aug 6;9(8):e18956. doi: 10.1016/j.heliyon.2023.e18956. eCollection 2023 Aug. Heliyon. 2023. PMID: 37609406 Free PMC article.
References
-
- Jager MJ, Shields CL, Cebulla CM, et al. .. Uveal melanoma. Nat Rev Dis Primers. 2020; 6: 24. - PubMed
-
- Al-Jamal RT, Cassoux N, Desjardins L, et al. .. The Pediatric Choroidal and Ciliary Body Melanoma Study: a survey by the European Ophthalmic Oncology Group. Ophthalmology. 2016; 123: 898–907. - PubMed
-
- Shields CL, Kaliki S, Shah SU, Luo W, Furuta M, Shields JA.. Iris melanoma: features and prognosis in 317 children and adults. J AAPOS. 2012; 16: 10–16. - PubMed
-
- Shields CL, Furuta M, Thangappan A, et al. .. Metastasis of uveal melanoma millimeter-by-millimeter in 8033 consecutive eyes. Arch Ophthalmol. 2009; 127: 989–998. - PubMed
Publication types
MeSH terms
Substances
LinkOut - more resources
Full Text Sources
Medical
