

Novel approach to semi-quantification of tracer accumulation in dopamine transporter scan
- PMID: 35536775
- PMCID: PMC9278684
- DOI: 10.1002/acm2.13626
Novel approach to semi-quantification of tracer accumulation in dopamine transporter scan
Abstract
Purpose: Accurate tracer accumulation evaluation is difficult owing to the partial volume effect (PVE). We proposed a novel semi-quantitative approach for measuring the accumulation amount by examining the approximate image. Using a striatal phantom, we verified the validity of a newly proposed method to accurately evaluate the tracer accumulations in the caudate and putamen separately. Moreover, we compared the proposed method with the conventional methods.
Methods: The left and right caudate/putamen regions and the whole brain region as background were identified in computed tomography (CT) images obtained by single-photon emission computed tomography (SPECT)/CT and acquired the positional information of each region. SPECT-like images were generated by assigning assumed accumulation amounts to each region. The SPECT-like image, approximated to the actual measured SPECT image, was examined by changing the assumed accumulation amounts assigned to each region. When the generated SPECT-like image most approximated the actual measured SPECT image, the accumulation amounts assumed were determined as the accumulation amounts in each region. We evaluated the correlation between the count density calculated by the proposed method and the actual count density of the 123 I solution filled in the phantom. Conventional methods (CT-guide method, geometric transfer matrix [GTM] method, region-based voxel-wise [RBV] method, and Southampton method) were also evaluated. The significance of differences between the correlation coefficients of various methods (except the Southampton method) was evaluated.
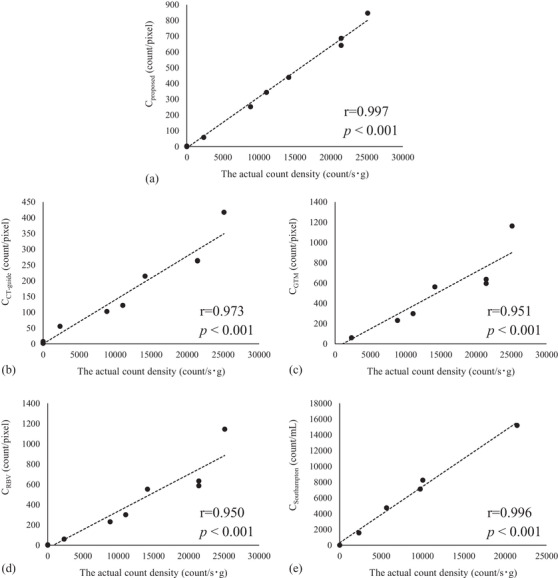
Results: The correlation coefficients between the actual count density and the SPECT count densities were 0.997, 0.973, 0.951, 0.950, and 0.996 for the proposed method, CT-guide method, GTM method, RBV method, and Southampton method, respectively. The correlation of the proposed method was significantly higher than those of the other methods.
Conclusions: The proposed method could calculate accurate accumulation amounts in the caudate and putamen separately, considering the PVE.
Keywords: FP-CIT; SPECT; dopamine transporter; quantification; specific binding ratio.
© 2022 The Authors. Journal of Applied Clinical Medical Physics published by Wiley Periodicals, LLC on behalf of The American Association of Physicists in Medicine.
Conflict of interest statement
The authors declare that there is no conflict of interest that could be perceived as prejudicing the impartiality of the research reported.
Figures


References
-
- Tatsch K, Poepperl G. Nigrostriatal dopamine terminal imaging with dopamine transporter SPECT: An update. J Nucl Med. 2013;54:1331‐1338. - PubMed
MeSH terms
Substances
LinkOut - more resources
Full Text Sources
