. 2022 May 10;17(5):e0267130.
doi: 10.1371/journal.pone.0267130. eCollection 2022.

Analysis of temporal changes in HIV-1 CRF01_AE gag genetic variability and CD8 T-cell epitope evolution

Affiliations

Analysis of temporal changes in HIV-1 CRF01_AE gag genetic variability and CD8 T-cell epitope evolution

Wardah Rafaqat et al. PLoS One. .

Abstract

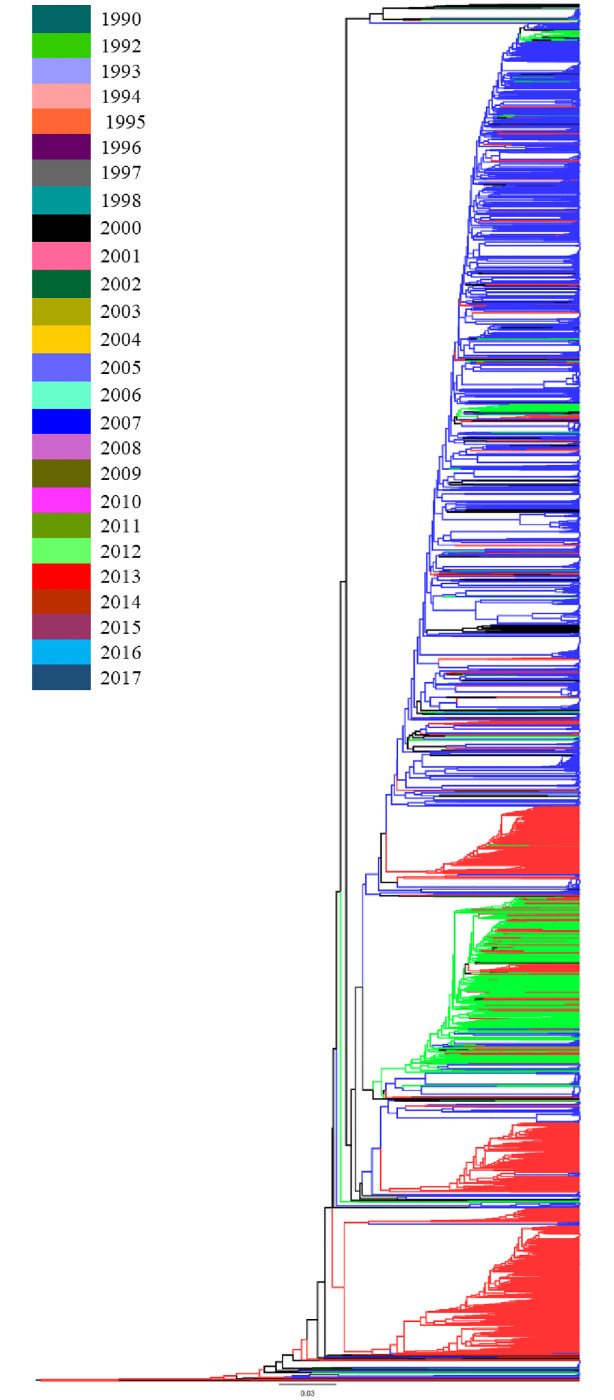
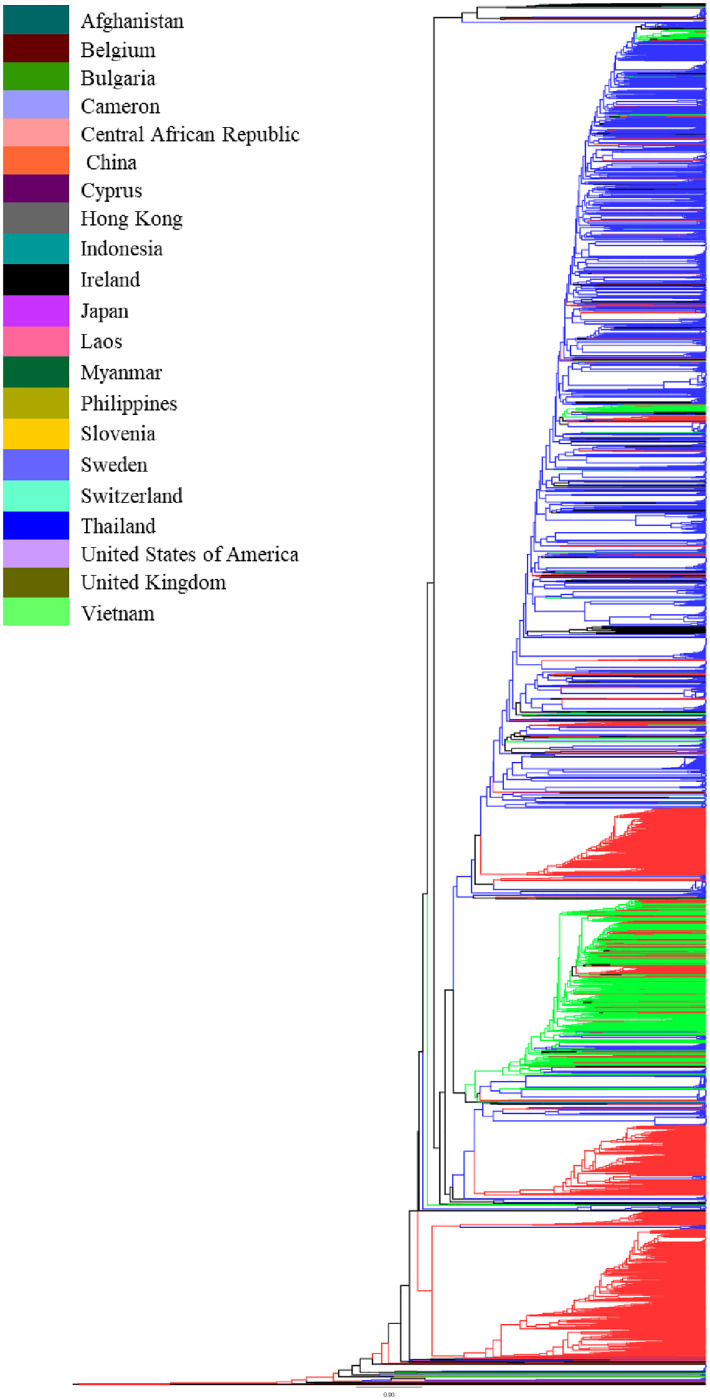
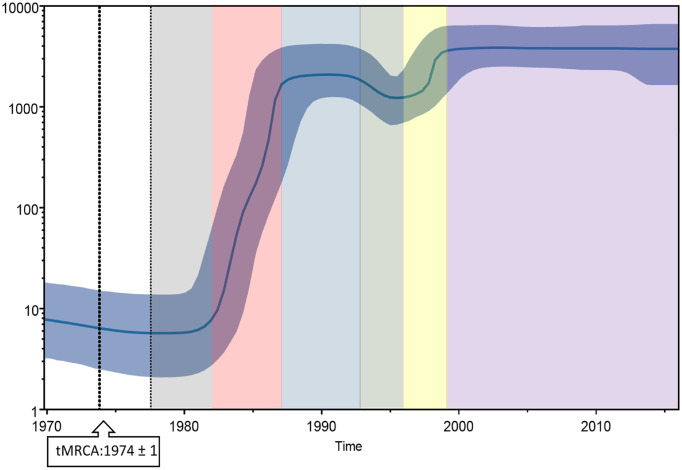
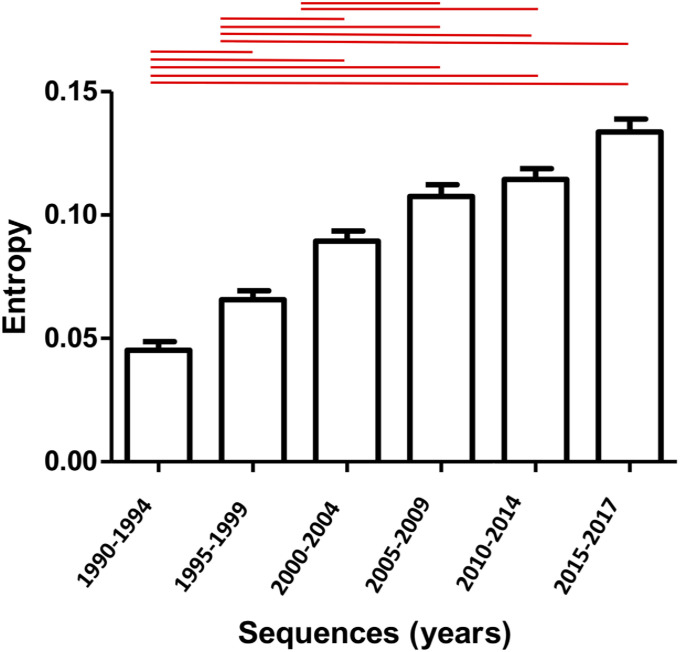
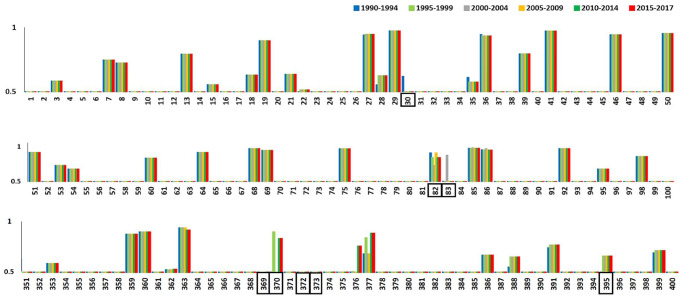
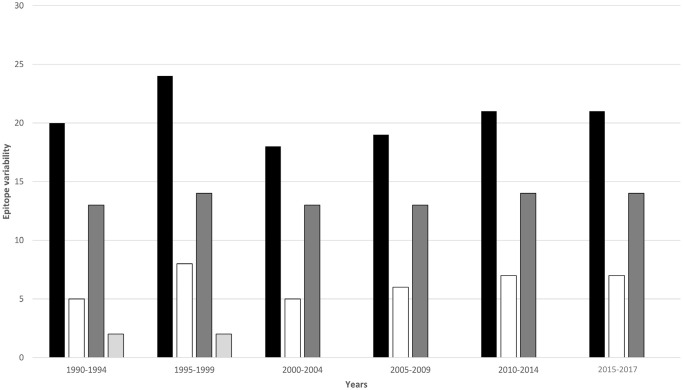
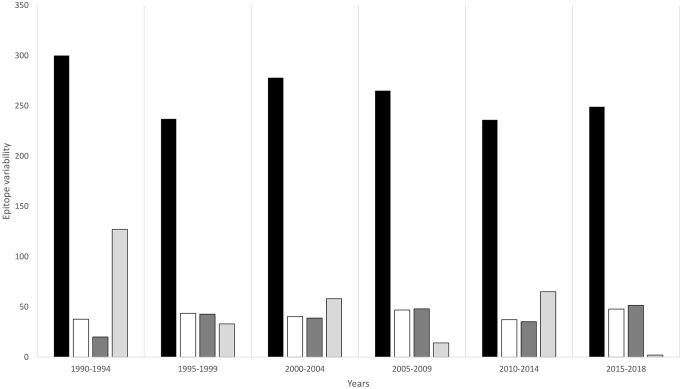
Currently, little is known about the time-dependent evolution of human immunodeficiency virus-1 (HIV-1) circulating recombinant forms (CRF) 01_AE, a dominant recombinant form associated with HIV-1 epidemics worldwide. Since gag is a highly immunodominant HIV-1 protein, we performed a comparative analysis of the CRF01_AE gag protein's time-dependent changes and evolution. A total of 3105 HIV-1 CRF01_AE gag sequences representing 17 countries from the timeline 1990-2017 were obtained. The sequences' phylogenetic relationship and epidemic dynamics were analyzed through a Maximum Likelihood tree and Bayesian Skyline plot, respectively. Genomic variability was measured through Shannon entropy and time-dependent immunoevolution was analyzed using changes in proteasomal degradation pattern, cytotoxic T lymphocytes (CTL) epitopes, and Human leukocyte antigens (HLA) restriction profile. The most recent common ancestor of the HIV CRF01_AE epidemic was estimated to be 1974±1. A period of exponential growth in effective population size began in 1982, fluctuated, and then stabilized in 1999. Genetic variability (entropy) consistently increased, however, epitope variability remained comparable; the highest number of novel CTL epitopes were present in 1995-1999, which were lost over time. The spread of the HIV-1 CRF01_AE epidemic is predominant in countries within Asia. Population immunogenetic pressures in the region may have contributed to the initial changes and following adaptation/stabilization of epitope diversity within gag sequences.


Conflict of interest statement

The authors have declared that no competing interests exist.

Figures

Fig 1
Fig 1. Maximum likelihood (ML) tree of HIV-1 CRF01_AE gag gene sequences.
ML tree was used to infer the phylogenetic relationship among the 3105 HIV-1 CRF01_AE gag sequences submitted to the LANL HIV Sequence Database, representing the years 1990 to 2017. The tree was color-coded based on the years groups. The color key for the tree is given within the figure.
Fig 2
Fig 2. Maximum likelihood (ML) tree of HIV-1 CRF01_AE gag gene sequences.
ML tree was used to infer the phylogenetic relationship among the 3105 HIV-1 CRF01_AE gag sequences submitted to the LANL HIV Sequence Database, representing the years 1990 to 2017. The tree was color-coded based on the countries. The color key for the tree is given within the figure.
Fig 3
Fig 3. HIV-1 CRF01_AE gag gene effective population size and time to the most recent common ancestor.
Bayesian Skyline plot, based on a ‘relaxed clock’ coalescent framework analysis, was constructed using 286 sequences (representing all years and countries). The X-axis represents time in years, while Y-axis shows an effective population size. The thick black line represents the median, while the blue band represents 95% highest posterior density (HPD) intervals. The tMRCA of the HIV-1 subtype AE gag gene is indicated by a black dotted line and a black box. Grey, red, blue, green, yellow, and purple shaded areas represent the period of the plateau phase, increase in viral effective population size, plateau phase, decline, increase, and plateau, respectively.
Fig 4
Fig 4. Time-dependent changes in HIV-1 CRF01_AE gag genomic variability.
The mean entropy score for each year group was calculated and plotted using GraphPad software. The Redline over bars represents a statistically significant difference between the groups (p<0.05). Error bars represent the standard error of the mean.
Fig 5
Fig 5. Proteasomal degradation sites in HIV-1 CRF01_AE gag protein.
Proteasomal degradation sites gag protein sequences from 1990–1994 (blue), 1995–1999 (light green), 2000–2004 (grey), 2005–2009 (yellow), 2010–2014 (dark green), and 2015–2017 (red) year groups were predicted using NetChop software. Below the sequence, the numbers indicating the position of each amino acid with reference to the HXB2 reference strain are shown. Only proteasomal degradation sites with a cut-off value >0.5 are shown. The black box indicates the position at which the mutation occurred.
Fig 6
Fig 6. Divergence and evolution of HIV-1 CRF01_AE gag CTL epitopes.
Bar chart summarizing epitope data for each year group. Black bars show the total number of gag epitopes observed for each year group, white bars represent epitope variability (total number of mutations in all epitope sequences in the year group/total number of epitopes in a year group), dark grey bars indicate intermittently recurring epitopes, and light grey bars indicate novel epitopes that were observed in one year group only.
Fig 7
Fig 7. Divergence and evolution of HIV-1 CRF01_AE envelope CTL epitopes.
Bar chart summarizing epitope data for each year group. Black bars show the total number of envelope epitopes observed for each year group, white bars represent epitope variability (total number of mutations in all epitope sequences in the year group/total number of epitopes in a year group), dark grey bars indicate intermittently recurring epitopes, and light grey bars indicate novel epitopes that were observed in one year group only.

References

    1. HIV/AIDS JUNP on. 2008 report on the global AIDS epidemic. 2008 Rep Glob AIDS Epidemic 2008.
    1. Chook JB, Ong LY, Takebe Y, Chan KG, Choo M, Kamarulzaman A, et al.. Molecular detection of HIV-1 subtype B, CRF01_AE, CRF33_01B, and newly emerging recombinant lineages in Malaysia. Am J Trop Med Hyg 2015;92:507–12. doi: 10.4269/ajtmh.14-0681 - DOI - PMC - PubMed
    1. Kalish ML, Robbins KE, Pieniazek D, Schaefer A, Nzilambi N, Quinn TC, et al.. Recombinant Viruses and Early Global HIV-1 Epidemic. Emerg Infect Dis 2004;10:1227. - PMC - PubMed
    1. Liao H, Tee KK, Hase S, Uenishi R, Li XJ, Kusagawa S, et al.. Phylodynamic analysis of the dissemination of HIV-1 CRF01_AE in Vietnam. Virology 2009;391:51–6. doi: 10.1016/j.virol.2009.05.023 - DOI - PubMed
    1. Li X, Liu H, Liu L, Feng Y, Kalish ML, Ho SYW, et al.. Tracing the epidemic history of HIV-1 CRF01_AE clusters using near-complete genome sequences. Sci Rep 2017;7:4024. doi: 10.1038/s41598-017-03820-8 - DOI - PMC - PubMed

Publication types

Substances