. 2022 Jul 5;82(13):2417-2430.
doi: 10.1158/0008-5472.CAN-21-4256.

Hypoxia-Reoxygenation Couples 3βHSD1 Enzyme and Cofactor Upregulation to Facilitate Androgen Biosynthesis and Hormone Therapy Resistance in Prostate Cancer

Affiliations

Hypoxia-Reoxygenation Couples 3βHSD1 Enzyme and Cofactor Upregulation to Facilitate Androgen Biosynthesis and Hormone Therapy Resistance in Prostate Cancer

Liang Qin et al. Cancer Res. .

Abstract

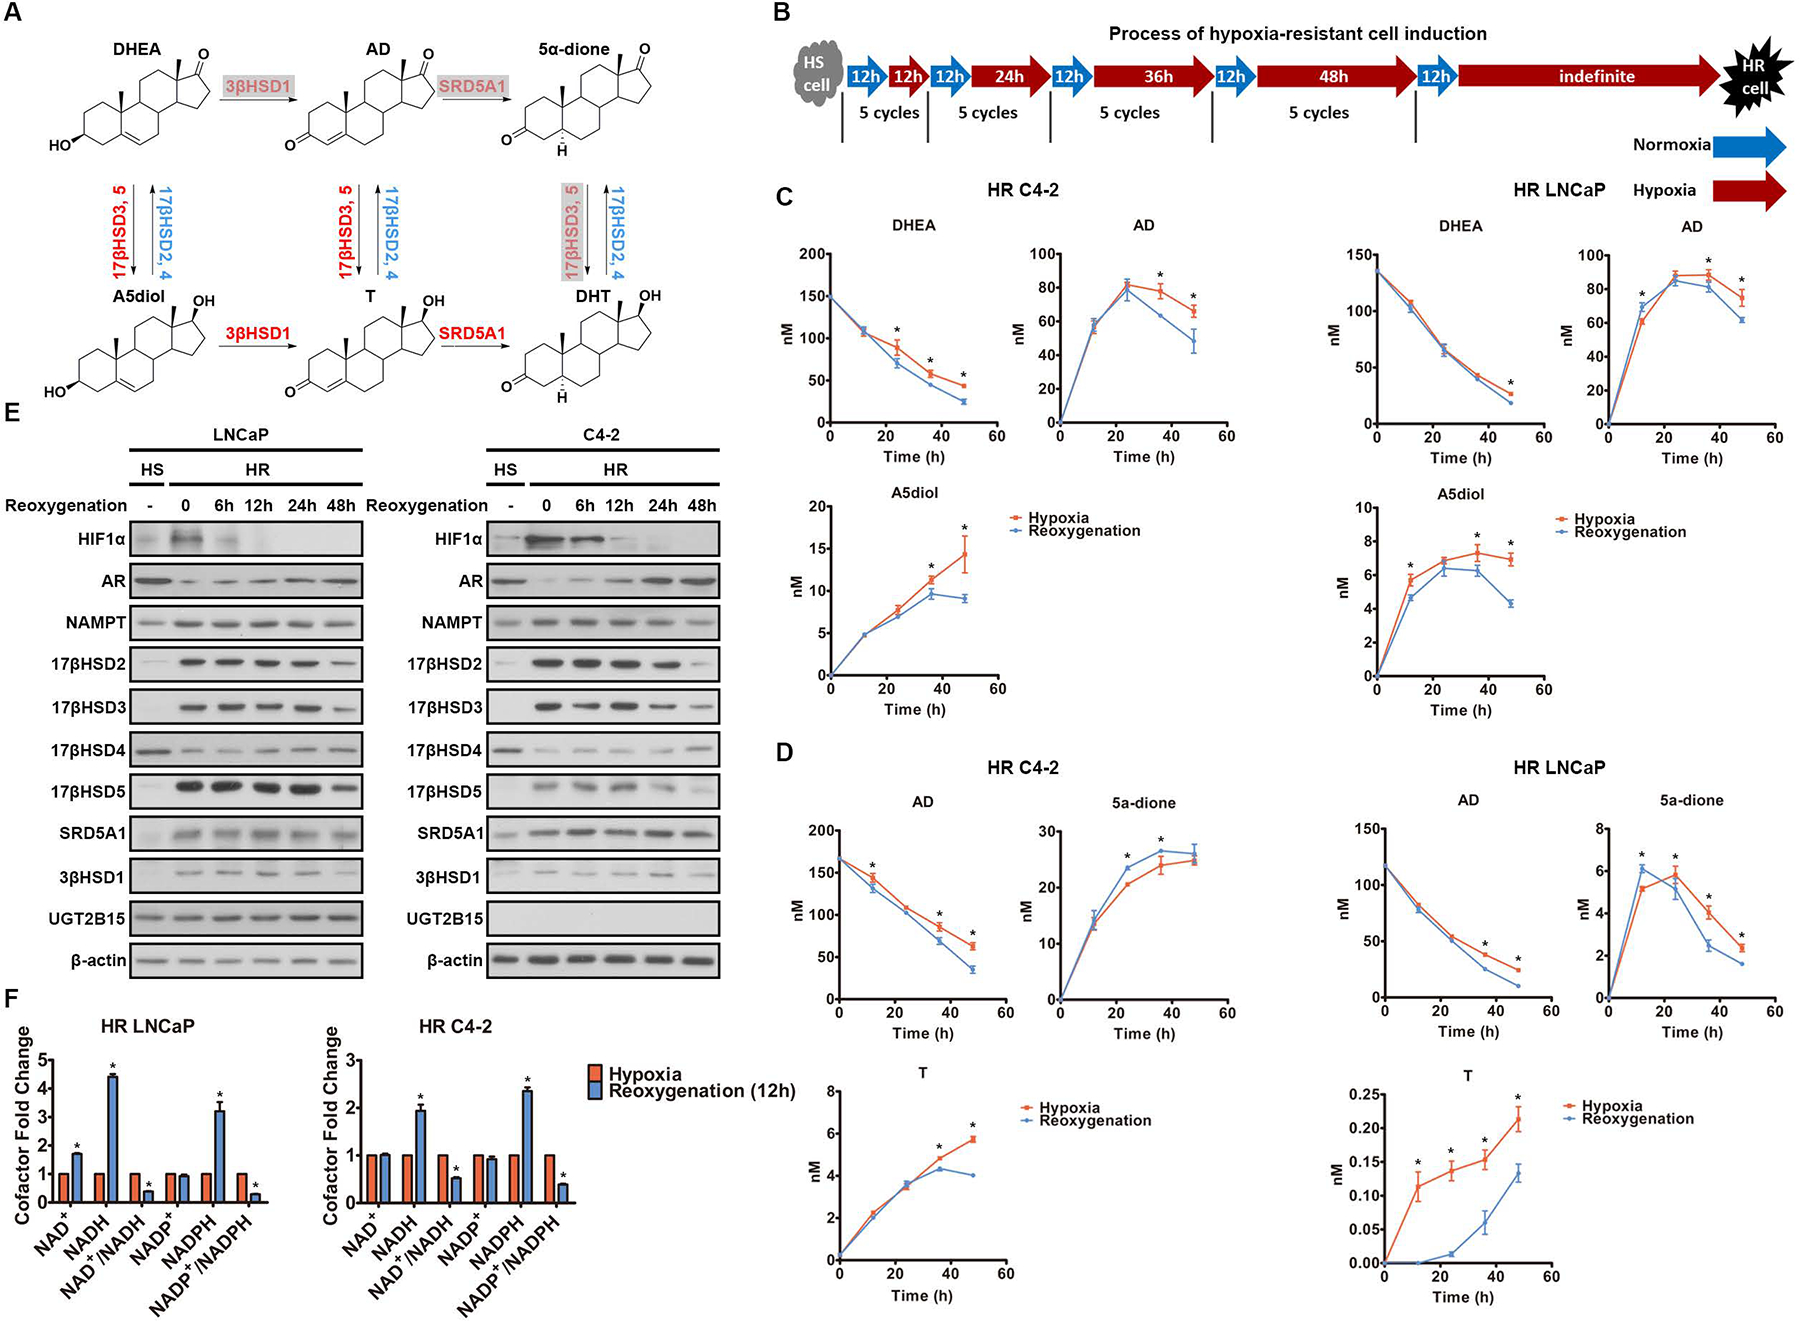
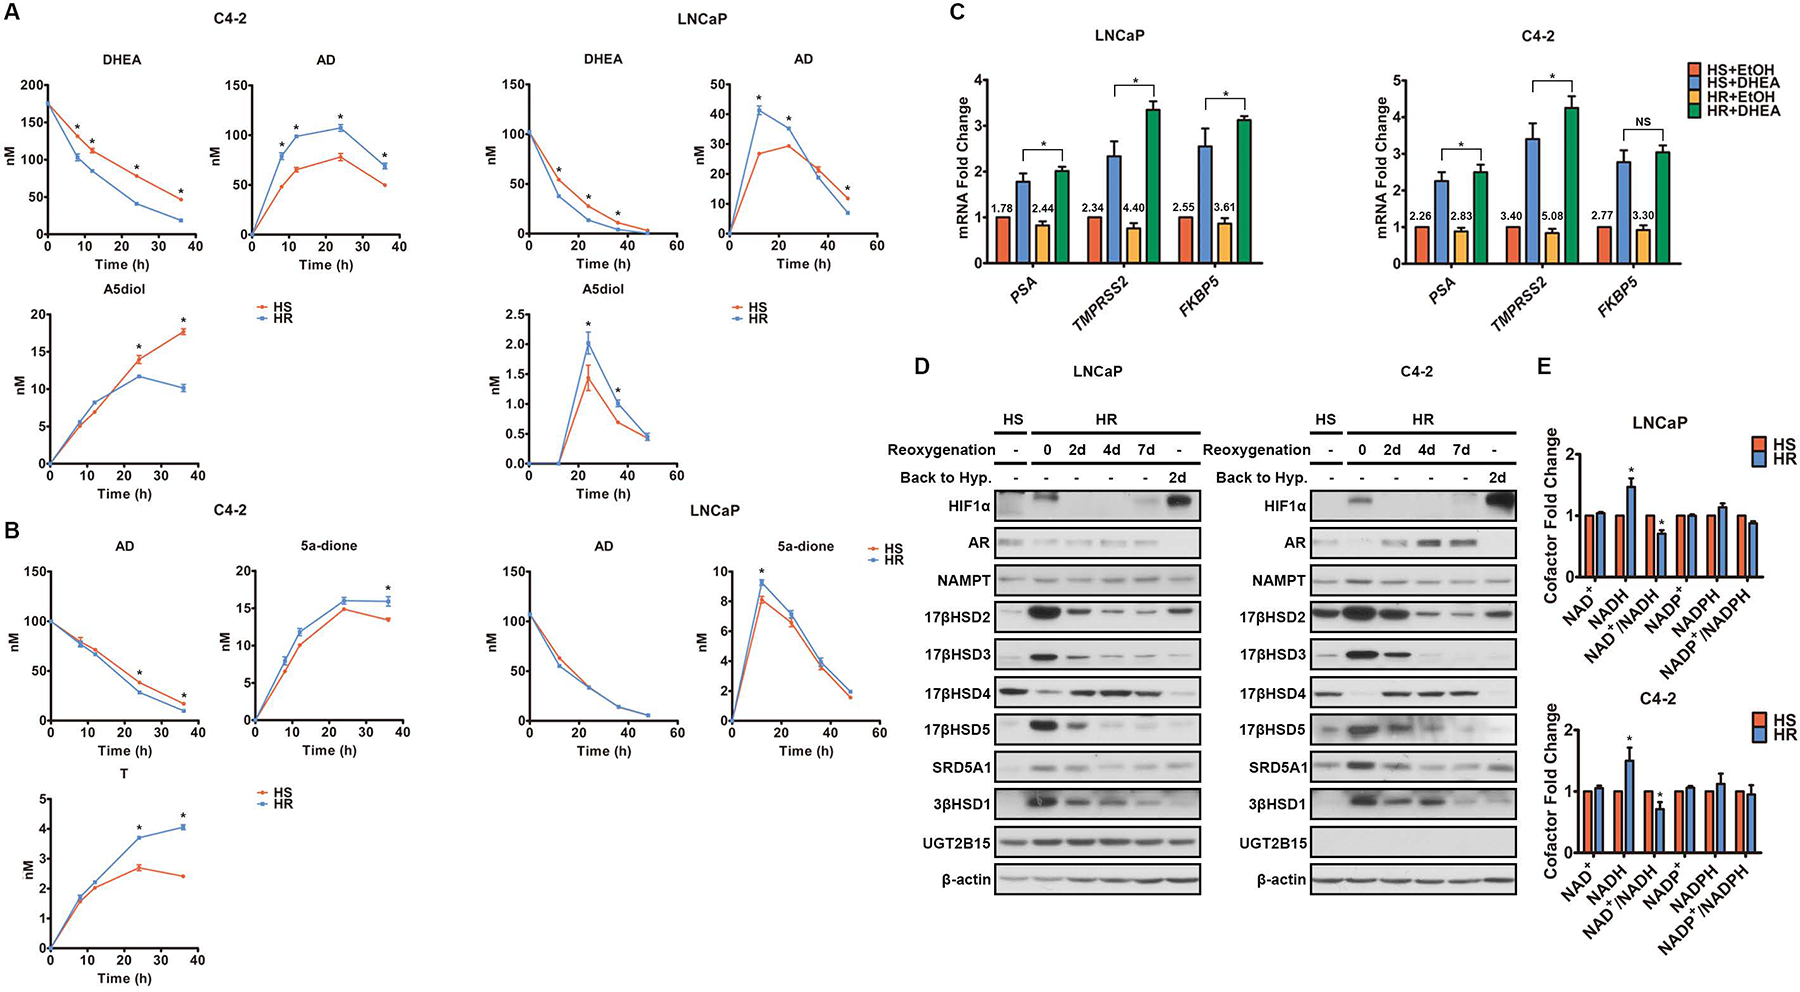
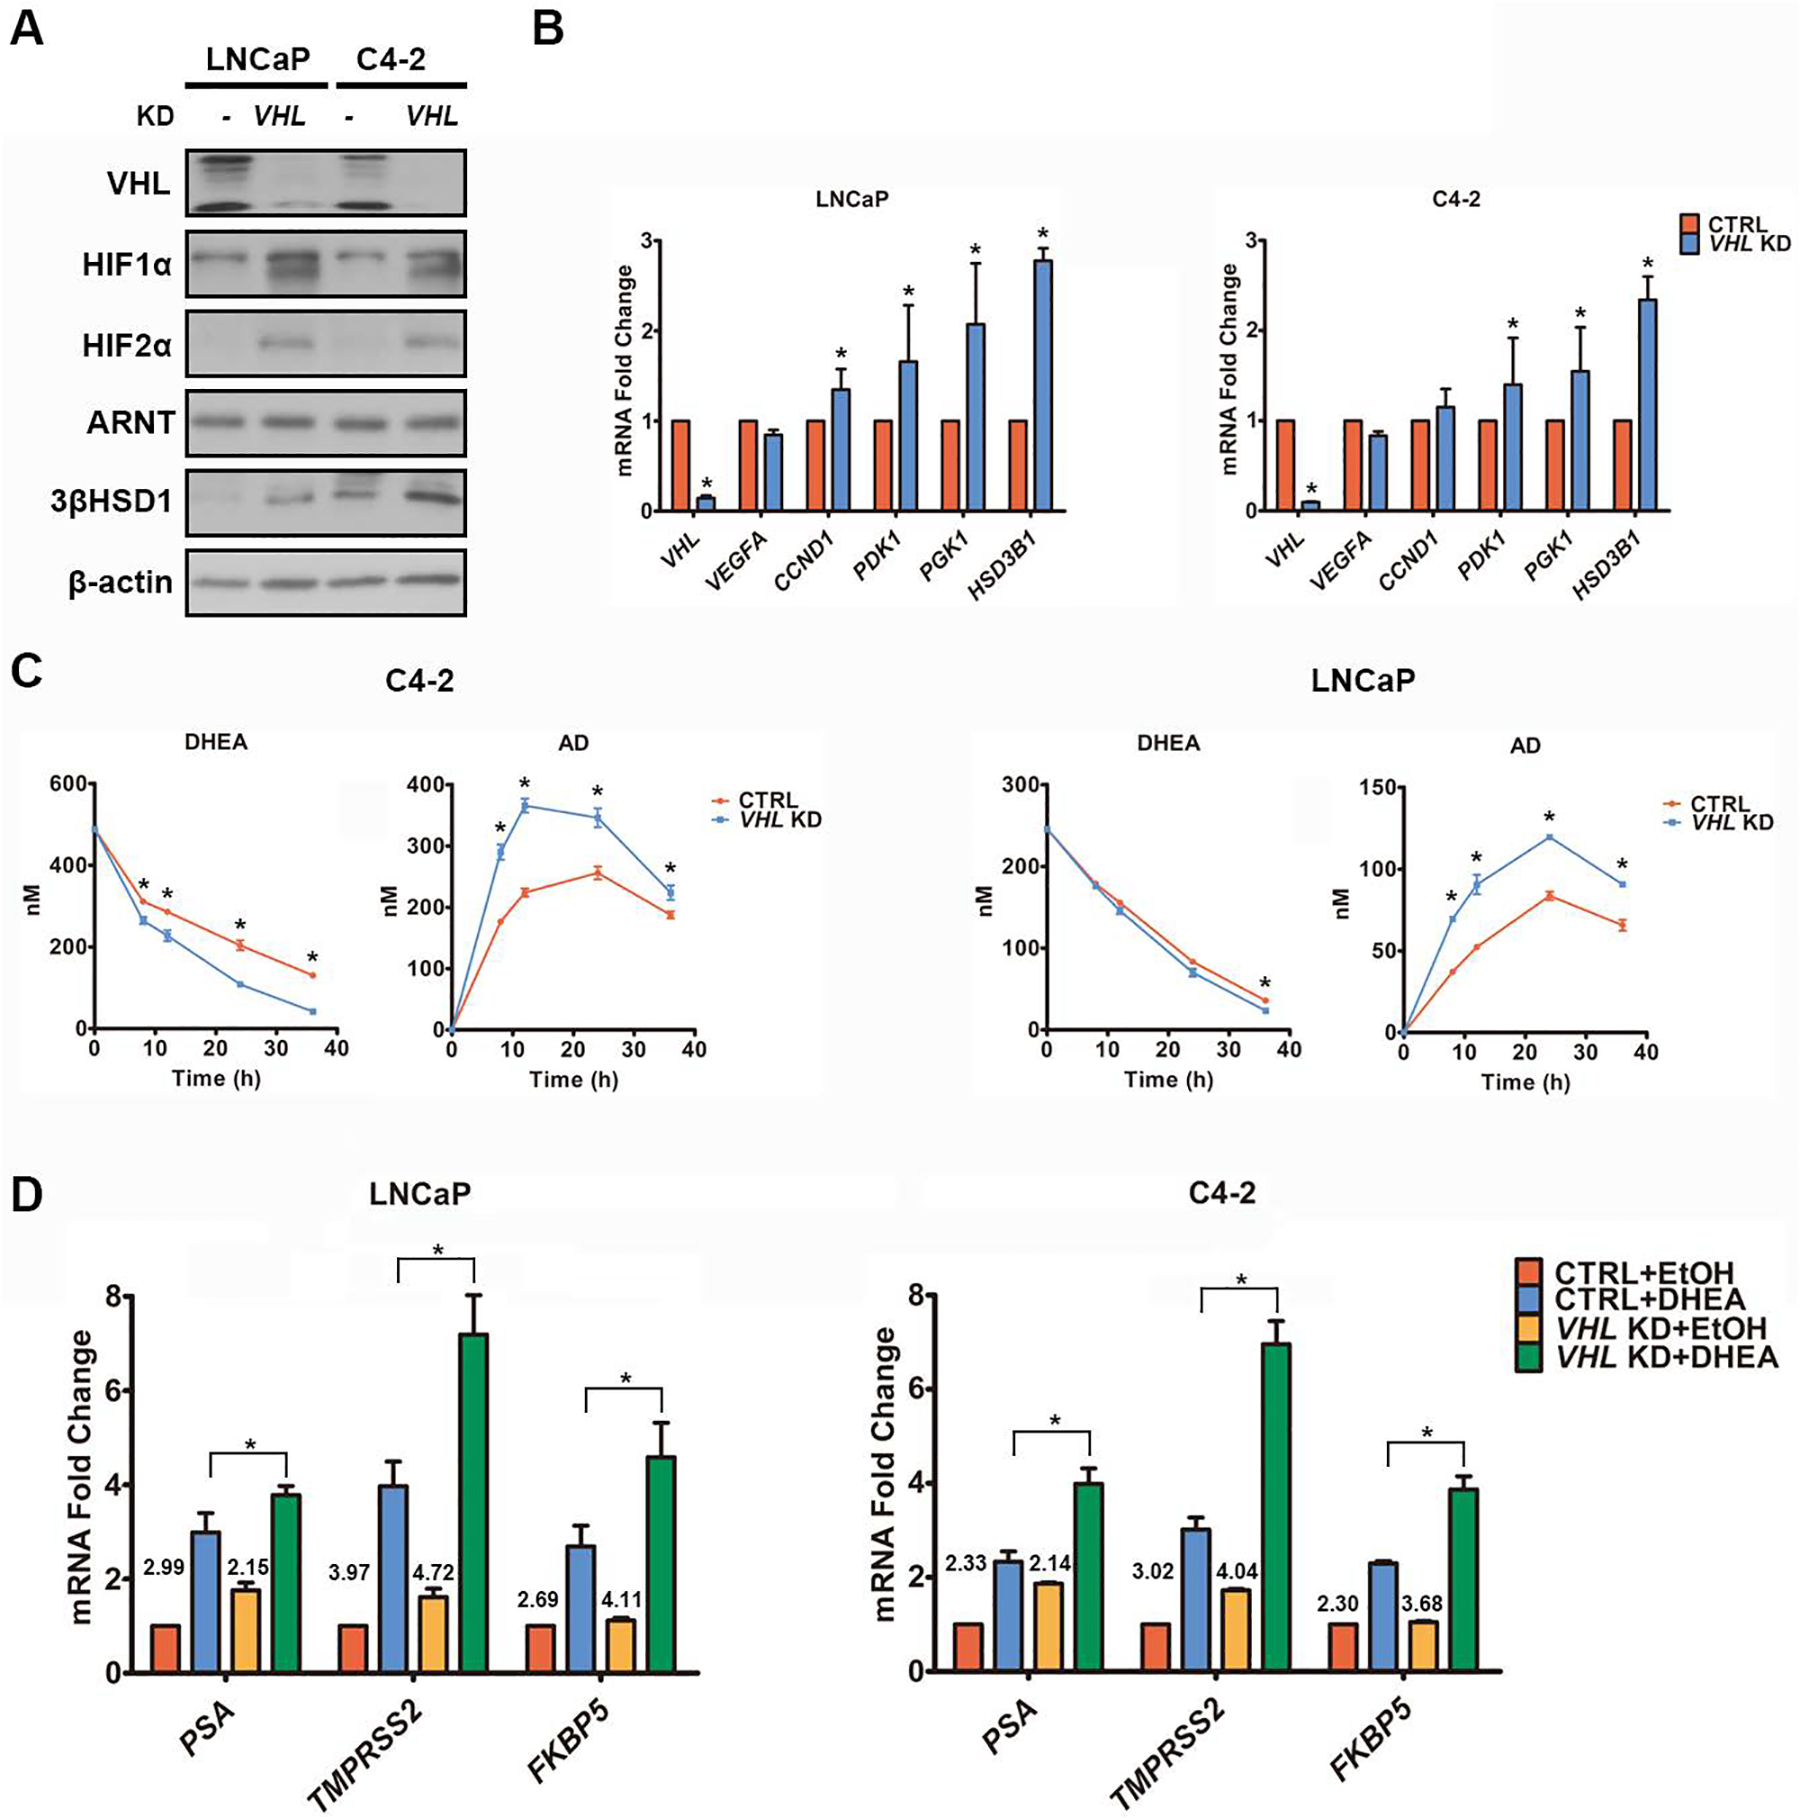
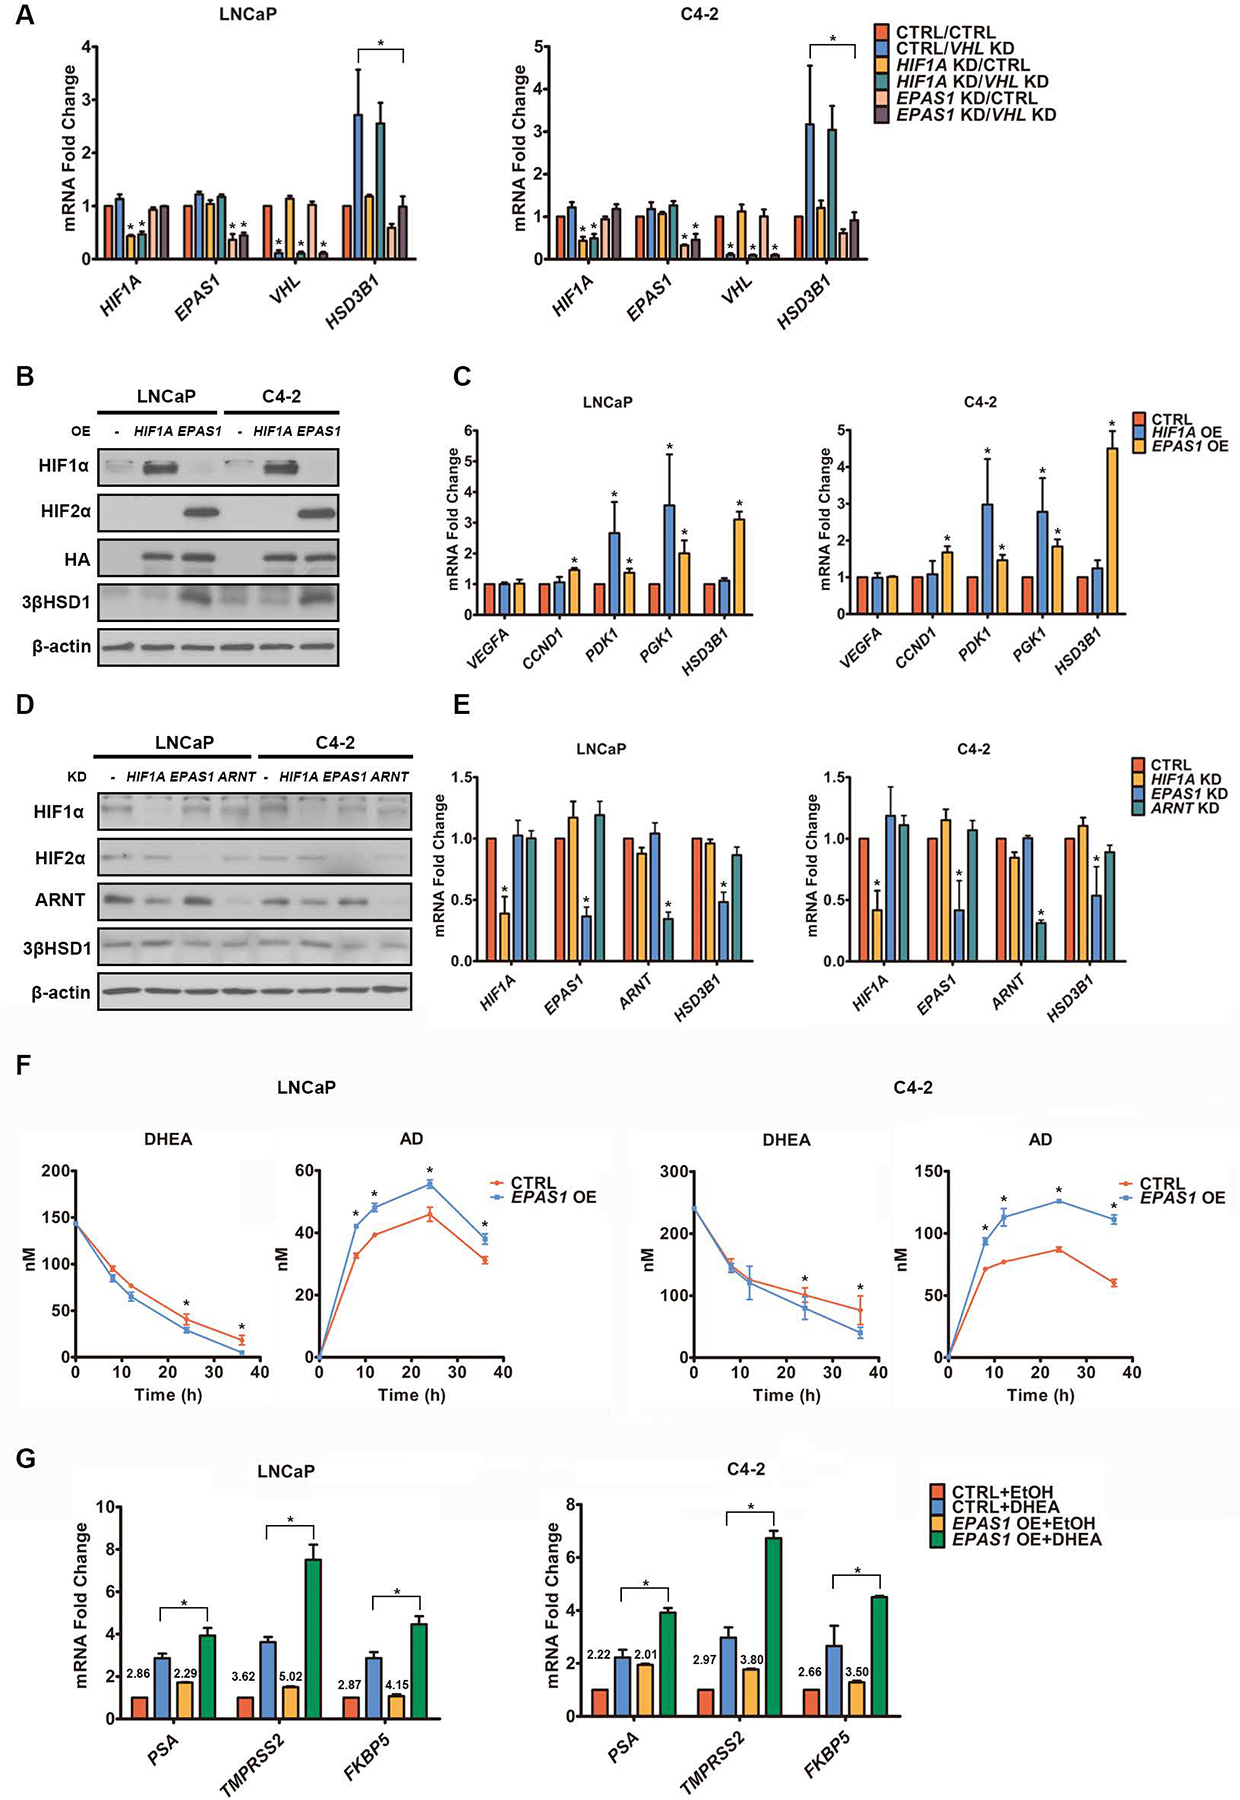
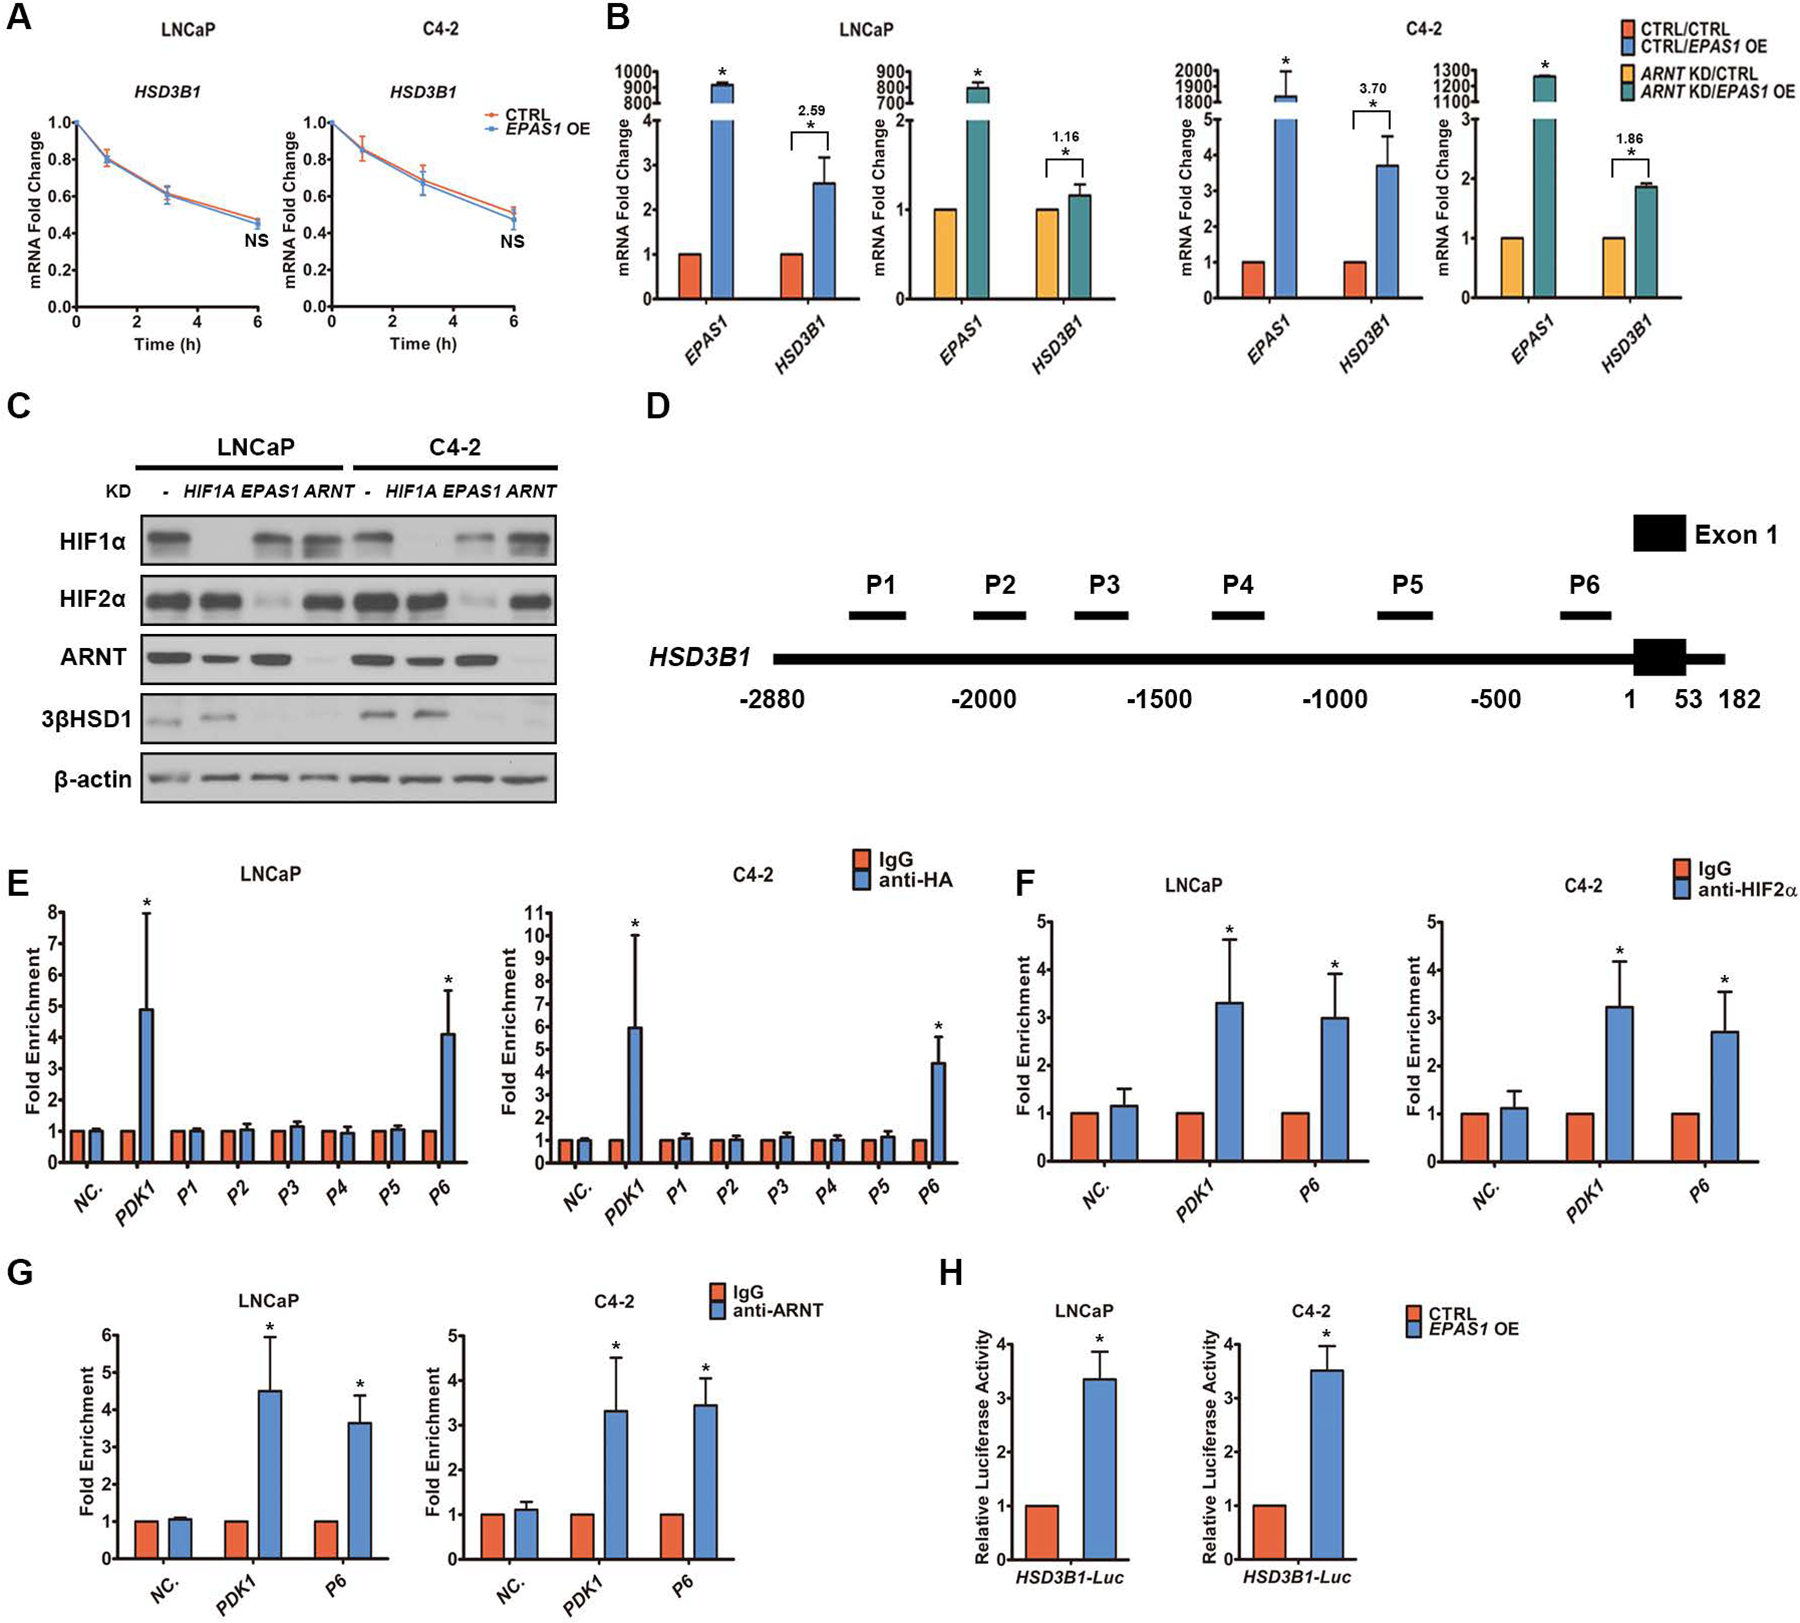
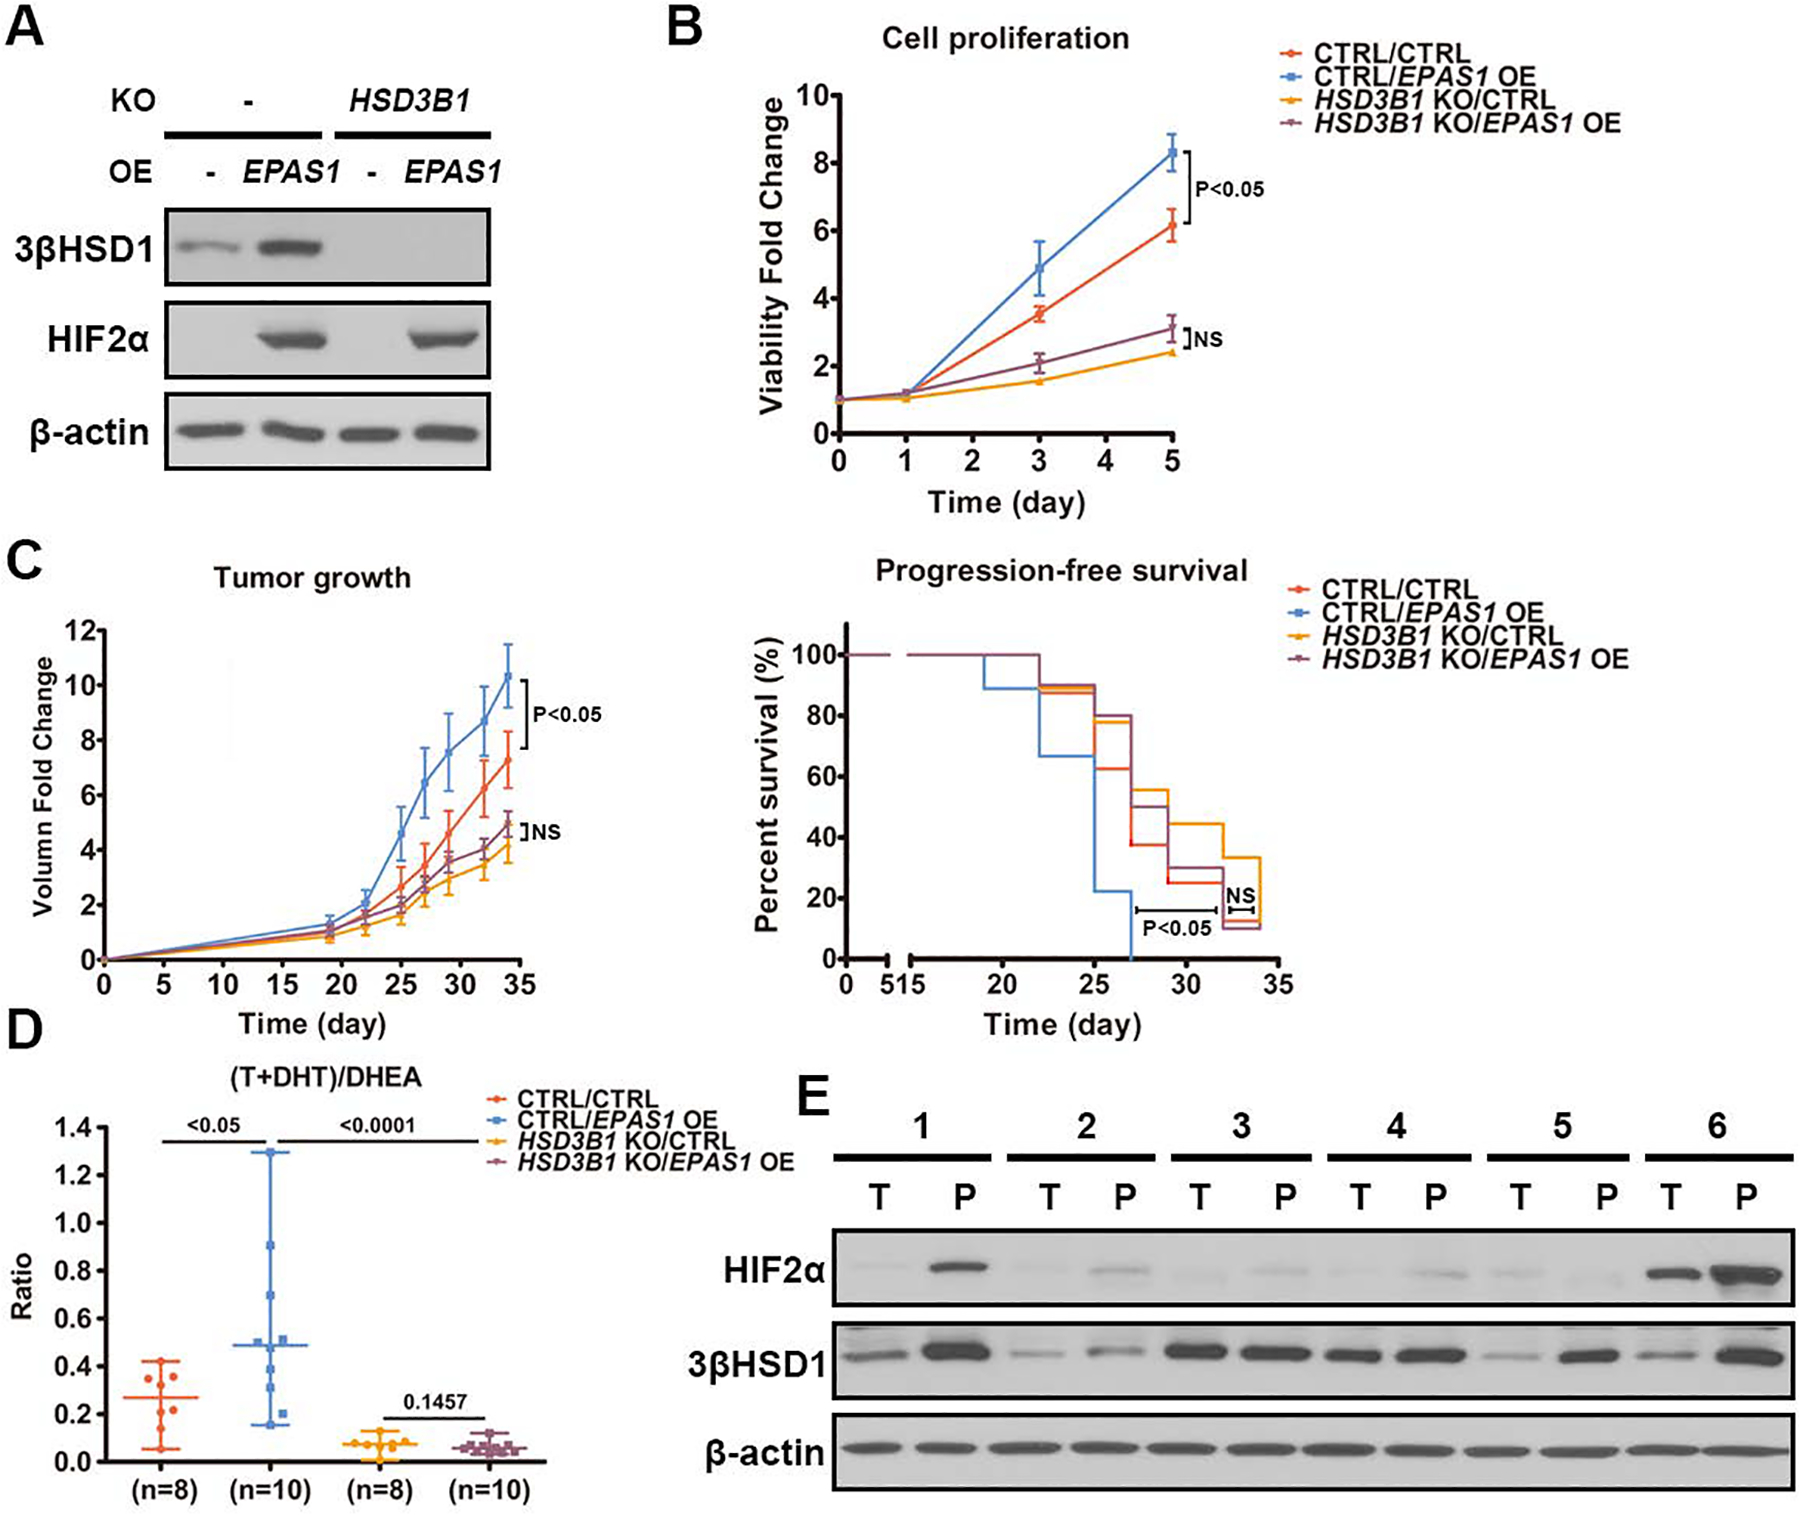
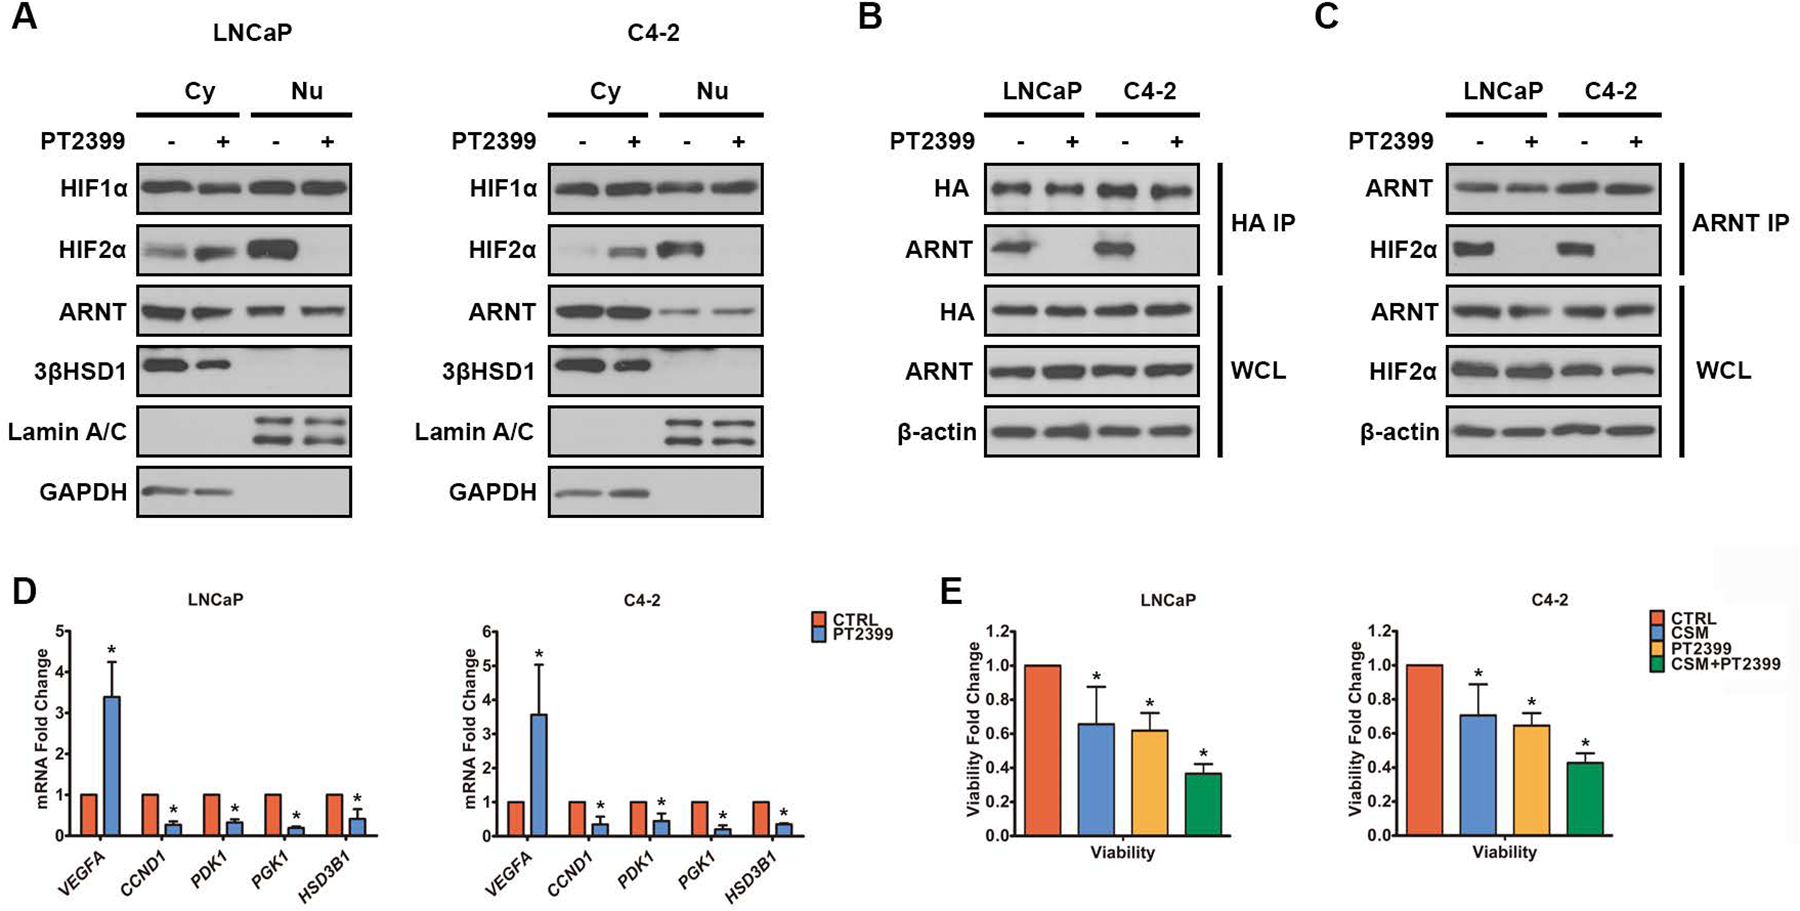
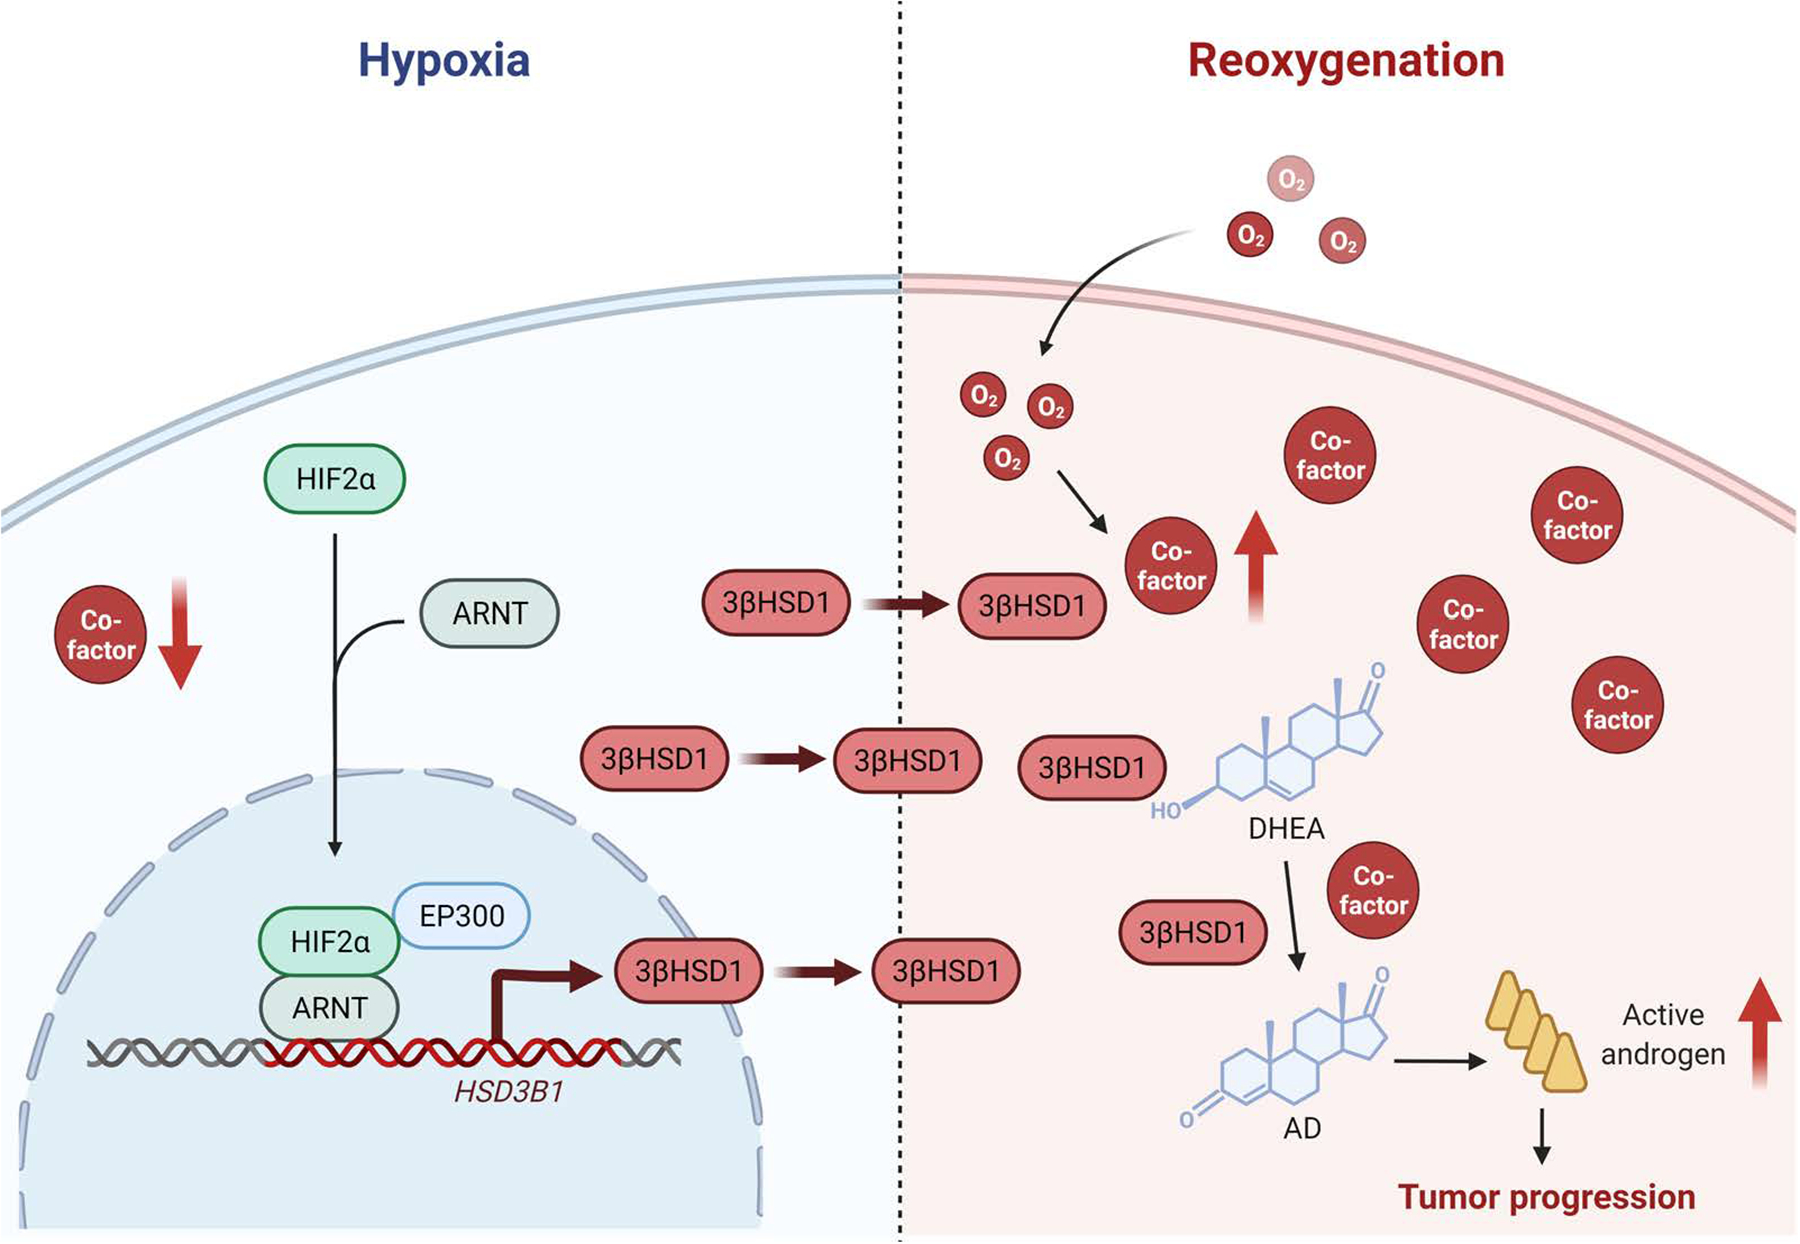
Androgen deprivation therapy suppresses tumor androgen receptor (AR) signaling by depleting circulating testosterone and is a mainstay treatment for advanced prostate cancer. Despite initial treatment response, castration-resistant prostate cancer nearly always develops and remains driven primarily by the androgen axis. Here we investigated how changes in oxygenation affect androgen synthesis. In prostate cancer cells, chronic hypoxia coupled to reoxygenation resulted in efficient metabolism of androgen precursors to produce androgens and activate AR. Hypoxia induced 3βHSD1, the rate-limiting androgen synthesis regulator, and reoxygenation replenished necessary cofactors, suggesting that hypoxia and reoxygenation both facilitate potent androgen synthesis. The EGLN1/VHL/HIF2α pathway induced 3βHSD1 expression through direct binding of HIF2α to the 5' regulatory region of HSD3B1 to promote transcription. Overexpression of HIF2α facilitated prostate cancer progression, which largely depended on 3βHSD1. Inhibition of HIF2α with the small-molecule PT2399 prevented prostate cancer cell proliferation. These results thus identify HIF2α as a regulator of androgen synthesis and potential therapeutic target in prostate cancer.

Significance: Hypoxia followed by reoxygenation in prostate cancer drives androgen deprivation therapy resistance via increasing the rate-limiting enzyme and cofactors for androgen synthesis, revealing HIF2α as a therapeutic target to subvert resistance.


Conflict of interest statement

Conflict of interest

None of the authors have a conflict of interest associated with the work presented here.

Figures

Fig. 1
Fig. 1. Survey of androgen metabolism under acute reoxygenation.
A. Androgen synthesis from DHEA. Gray indicates the main pathway of DHT synthesis in CRPC. B. Hypoxia-resistant (HR) cell line generation from hypoxia-sensitive (HS) cells. C-D. Metabolism of DHEA (C) and AD (D) was determined by mass spectrometry in HR cells with and without reoxygenation. Time 0 represents the point of DHEA (C) and AD (D) addition, and hypoxia or reoxygenation. Both groups of cells were under hypoxia before time 0. E. The enzymes involved in androgen metabolism were quantified by Western blot in HS cells under normoxia and in HR cells with and without reoxygenation. β-actin was a loading control. F. The cofactors were quantified in HR cells with and without reoxygenation. Error bars represent mean ± SEM. *, P<0.05 using an unpaired two-tailed t test.
Fig. 2
Fig. 2. Chronic hypoxia reversibly upregulates 3βHSD1.
A-B. Metabolism of DHEA (A) and AD (B) was determined by mass spectrometry in both HS and HR cells under normoxia. Time 0 represents the point of DHEA (A) and AD (B) addition. HR cells were under reoxygenation for 48h before time 0. C. AR-regulated transcripts were determined by qPCR in both HS and HR cells under normoxia with or without 8h DHEA treatment. HR cells were under reoxygenation for 48h before DHEA treatment. The numbers above the columns denote fold change. D. The enzymes involved in androgen metabolism were quantified by Western blot in HS cells under normoxia and HR cells with and without reoxygenation. β-actin was a loading control. “Back to Hyp.” indicates HR cells that, after 7-day reoxygenation, were transferred back to hypoxia for 2 days. E. The cofactors were quantified in HS cells under normoxia and HR cells after 48h reoxygenation. Error bars represent mean ± SEM. *, P<0.05 using an unpaired two-tailed t test.
Fig. 3
Fig. 3. 3βHSD1 is upregulated by hypoxia via VHL inhibition.
A-B. VHL, HIF, 3βHSD1, and HIF target proteins (A) and mRNA (B) were determined by Western blot (A) and qPCR (B) in cells with siRNA-mediated VHL knockdown and control cells under normoxia. β-actin was a loading control. C. DHEA metabolism was determined by mass spectrometry in cells with VHL knockdown and control cells under normoxia. Time 0 represents the point of DHEA addition, which was 48 hours after transfection with VHL or control siRNA. D. AR-regulated transcripts were determined by qPCR in cells with or without 8h DHEA treatment, which was 48 hours after transfection with VHL or control siRNA under normoxia. The numbers above the columns denote fold change. *P<0.05 using an unpaired two-tailed t test. Error bars represent mean ± SEM.
Fig. 4
Fig. 4. HIF2α upregulates 3βHSD1.
A. HIF, VHL and HSD3B1 mRNA was quantified by qPCR in cells with shRNA-mediated HIF and/or siRNA-mediated VHL knockdown (KD) and control cells under normoxia. EPAS1 is the gene encoding HIF2α. B-C. HIF, 3βHSD1, and HIF target proteins (B) and mRNA (C) were determined by Western blot (B) and qPCR (C) in cells with HA-tagged HIF overexpression (OE) and control cells under normoxia. D-E. HIF and 3βHSD1 protein (D) and mRNA (E) were determined by Western blot (D) and qPCR (E), respectively, in HR cells with and without shRNA-mediated HIF knockdown under hypoxia. β-actin was a loading control. F. DHEA metabolism was determined by mass spectrometry in cells with and without HA-tagged HIF2α overexpression under normoxia. Time 0 represents the point of DHEA addition, at 48 hours after transfection with HA-tagged HIF2α or control plasmid. G. AR-regulated transcripts were determined by qPCR in cells with or without 8h DHEA treatment, which was 48 hours after transfection with HA-tagged HIF2α or control plasmid under normoxia. The numbers above the columns denote fold change. *P<0.05 using an unpaired two-tailed t test. Error bars represent mean ± SEM.
Fig. 5
Fig. 5. HIF2α directly targets the 5’ regulatory region of HSD3B1.
A. HSD3B1 mRNA was quantified by qPCR in cells with HA-tagged HIF2α overexpression (OE) and control cells at different time points following actinomycin D treatment under normoxia. Time 0 represents the point of actinomycin D addition. B. HA-tagged HIF2α was overexpressed in both control cells and cells with shRNA-mediated ARNT knockdown (KD) under normoxia. EPAS1 and HSD3B1 mRNA was quantified by qPCR. The numbers above the asterisks denote fold change. C. HA-tagged HIF2α was overexpressed in cells with and without siRNA-mediated HIF knockdown under normoxia, and HIF and 3βHSD1 protein expression was determined by Western blot. β-actin was a loading control. D. The 5’ regulatory region of HSD3B1 for the scanning ChIP assay. Six regions were amplified by six pairs of primers (P1 to P6). E. The six regions of the 5’ regulatory region of HSD3B1 were measured by qPCR in cells with HA-tagged HIF2α overexpression under normoxia. qPCR was performed on the fragmented chromatin precipitated by anti-HA or control IgG antibody. The primers targeting the promoter region of PDK1, which has been reported to bind HIF2, were used as a positive control. Human negative control primer set 1 (71001) from Active Motif was used as negative ChIP control (NC.). F-G. The P6 region of the HSD3B1 5’ regulatory region was measured by qPCR in HR cells under hypoxia. qPCR was performed on the fragmented chromatin precipitated by anti-HIF2α (F), anti-ARNT (G), or control IgG antibody. The primers targeting the promoter region of PDK1 were used as a positive control. Human negative control primer set 1 (71001) from Active Motif was used as negative ChIP control (NC.). H. The 5’ regulatory region of HSD3B1 was fused to a luciferase reporter to generate a promoter-luciferase construct that was then transfected into cells with HA-tagged HIF2α overexpression and control cells under normoxia. Error bars represent mean ± SEM. *P<0.05 using an unpaired two-tailed t test.
Fig. 6
Fig. 6. In vivo analysis of tumors with HIF2α overexpression.
A. 3βHSD1 and HA-tagged HIF2α protein expression in HSD3B1 knockout (KO) and control C4-2 cells with and without HA-tagged HIF2α overexpression was determined by Western blot. β-actin was a loading control. B. The proliferation of the cells in Fig. 6A was measured by luciferase assay. The cells were treated with DHEA (100nM). The proliferation was compared using an unpaired two-tailed t test on day 5. C. Change in tumor volume and progression-free survival in a xenograft study using the cells in Fig. 6A with DHEA treatment after castration. Castration and DHEA pellet implantation was performed 19 days after cell injection. Tumor volume was compared using an unpaired two-tailed t test on day 34. Progression-free survival was assessed as time from cell injection to tumor volume of 800 mm3, and compared using a log-rank (Mantel-Cox) test. D. T, DHT and DHEA were measured in xenograft tumor samples from Fig. 6C using mass spectrometry and the ratio of (T+DHT)/DHEA is shown in each xenograft group. E. 3βHSD1 and HIF2α protein expression in radical prostatectomy tissues from 6 patients with localized prostate cancer was determined by Western blot. β-actin was a loading control. “T” and “P” represent transitional zone and peripheral zone, respectively. Error bars represent mean ± SEM.
Fig. 7
Fig. 7. PT2399 suppresses cell growth via inhibiting transactivation activity of HIF2.
A. HIF and 3βHSD1 in cytoplasm (Cy) and nucleus (Nu) in HR cells treated with either PT2399 (50μM) or DMSO for 24h under hypoxia were determined by Western blot. Lamin A/C and GAPDH were determined as markers of the nucleus and cytoplasm, respectively. B. Cells with HA-tagged HIF2α overexpression were treated with either PT2399 (50μM) or DMSO for 24h under normoxia. HA-tagged HIF2α and ARNT were coimmunoprecipitated by anti-HA antibody. C. ARNT and HIF2α were coimmunoprecipitated by anti-ARNT antibody in HR cells treated with either PT2399 (50μM) or DMSO for 24h under hypoxia. D. HSD3B1 and HIF targets mRNA was determined by qPCR in HR cells treated with either PT2399 (50μM) or DMSO for 24h under hypoxia. E. HR cells were pre-cultured in either complete media or charcoal-stripped media (CSM) for 48h, and then treated with either DMSO (CTRL) or PT2399 (50μM) for 24h under hypoxia. The cell viability was measured using a Promega luciferase assay. Error bars represent mean ± SEM. *P<0.05 using an unpaired two-tailed t test.
Fig. 8
Fig. 8. Proposed regulation of androgen synthesis by cyclic hypoxia-reoxygenation in CRPC.
Hypoxia stabilizes HIF2α, which translocates to the nucleus and dimerizes with HIF1β to induce the transcription of HSD3B1. Then reoxygenation increases androgen production by rapidly increasing the cofactors without reducing 3βHSD1 protein in the short term.

Comment in

  • Uro-Science.
    Atala A. Atala A. J Urol. 2023 Apr;209(4):801-802. doi: 10.1097/JU.0000000000003161. Epub 2023 Jan 19. J Urol. 2023. PMID: 36655472 No abstract available.

Similar articles

Cited by

References

    1. Wang G, Zhao D, Spring DJ, DePinho RA. Genetics and biology of prostate cancer. Genes Dev 2018;32:1105–40 - PMC - PubMed
    1. Attard G, Parker C, Eeles RA, Schröder F, Tomlins SA, Tannock I, et al. Prostate cancer. Lancet (London, England) 2016;387:70–82 - PubMed
    1. Litwin MS, Tan HJ. The Diagnosis and Treatment of Prostate Cancer: A Review. Jama 2017;317:2532–42 - PubMed
    1. Desai K, McManus JM, Sharifi N. Hormonal Therapy for Prostate Cancer. Endocrine reviews 2021;42:354–73 - PMC - PubMed
    1. Sharifi N Minireview: Androgen metabolism in castration-resistant prostate cancer. Molecular endocrinology (Baltimore, Md) 2013;27:708–14 - PMC - PubMed

Publication types