. 2022 May 10;18(5):e1010150.
doi: 10.1371/journal.ppat.1010150. eCollection 2022 May.

Australia as a global sink for the genetic diversity of avian influenza A virus

Affiliations

Australia as a global sink for the genetic diversity of avian influenza A virus

Michelle Wille et al. PLoS Pathog. .

Abstract

Most of our understanding of the ecology and evolution of avian influenza A virus (AIV) in wild birds is derived from studies conducted in the northern hemisphere on waterfowl, with a substantial bias towards dabbling ducks. However, relevant environmental conditions and patterns of avian migration and reproduction are substantially different in the southern hemisphere. Through the sequencing and analysis of 333 unique AIV genomes collected from wild birds collected over 15 years we show that Australia is a global sink for AIV diversity and not integrally linked with the Eurasian gene pool. Rather, AIV are infrequently introduced to Australia, followed by decades of isolated circulation and eventual extinction. The number of co-circulating viral lineages varies per subtype. AIV haemagglutinin (HA) subtypes that are rarely identified at duck-centric study sites (H8-12) had more detected introductions and contemporary co-circulating lineages in Australia. Combined with a lack of duck migration beyond the Australian-Papuan region, these findings suggest introductions by long-distance migratory shorebirds. In addition, on the available data we found no evidence of directional or consistent patterns in virus movement across the Australian continent. This feature corresponds to patterns of bird movement, whereby waterfowl have nomadic and erratic rainfall-dependant distributions rather than consistent intra-continental migratory routes. Finally, we detected high levels of virus gene segment reassortment, with a high diversity of AIV genome constellations across years and locations. These data, in addition to those from other studies in Africa and South America, clearly show that patterns of AIV dynamics in the Southern Hemisphere are distinct from those in the temperate north.


Conflict of interest statement

The authors have declared that no competing interests exist.

Figures

Fig 1
Fig 1. Spatial and temporal distribution of avian influenza genomes used in this study.
(A) Map of Australia illustrating regional sampling locations. Where sampling locations were within 500km, they were merged into a single location. The value within the circle corresponds to the number of unique viral genomes comprising at least one segment from each location. States and Territories are as follows: VIC Victoria, NSW New South Wales, QLD Queensland, NT Northern Territory, WA Western Australia, SA South Australia and TAS Tasmania. Map shapefile from mapsvg, distributed under a CC BY 4.0 licence. https://mapsvg.com/maps/australia (B) Number of genomes per state per year. Colours from panel B correspond to the fill colour of the state in panel A. This figure includes genomes comprising one or more segments and contains no duplicates. This figure includes all sequences generated as part of the National Avian Influenza Wild Bird Surveillance Program, including those recently published in [40,41]. Further metadata is available in S1 Table and S2 and S3 Figs.
Fig 2
Fig 2. HA-NA subtype linkage in data generated for this study.
(A) The number of each HA-NA subtype combinations (values) and the proportion of the total data set these values represent (shading). (B) A plot of the Pearson residuals of Chi-squared tests. For a given cell, the size of the circle is proportional to the amount of the cell contribution. Positive residuals are in blue and identify HA and NA subtypes for which there is a strong positive association in the data set. Negative residuals are in light pink and show a weak negative association, that is, they are underrepresented in the data set. This figure comprises unique viral genomes with at least one segment. Plots of subtype data by location and time are presented in S3 Fig.
Fig 3
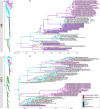
Fig 3. Phylogenetic trees of subtypes H4 and H11.
(A, C) Phylogenetic trees comprising global diversity. Branches of reference sequences are coloured by continent. Sequences from Australia are coloured in pink (2005 and later) and in purple (pre-2005), with 2005 marking the year of the oldest sequence in the data set generated in this study. (B, D) Time structured phylogenetic trees. The trees comprise Australian lineages (as indicated by grey boxes in A, C) and closest relatives (retrieved by BLAST searches). Branches are coloured by year and geography as above. Branch labels correspond to posterior clade probabilities of each node, node bars correspond to the 95% HPD of node height. We selected H4 as it is the only HA subtype for which there is clear introduction of an Australian lineage virus into Asia (indicated in square parenthesis), and is an example of an HA segment for which there is only a single contemporary lineage. We selected H11 as it is the subtype with the largest number of contemporary Australian lineages (4), of which 2 are represented by a single sequence. Trees for all other HA subtypes can be found in S4–S15 Figs.
Fig 4
Fig 4. The time-scale of LPAIV evolution by subtype in Australia.
(A) A schematic phylogeny demonstrating the differences between the tMRCA of Australian lineages and the dates of divergence from reference sequences. (B) The tMRCA distribution of contemporary Australian lineages of the HA segments and (C) dates of divergence from the reference sequences of all HA lineages. Points represent the node date and bars the 95% HPD. For segments with multiple lineages, multiple estimates have been provided. Where a novel introduction is represented by a single sequence the tMRCA was not estimated (here, represented by “*singleton) but the date of divergence from reference sequences is shown. For H7, we did not estimate the date of divergence from the closest reference sequences. (D) The time difference between the tMRCA of the Australian lineages and the date of separation for all HA and NA segments and lineages. Lineages with time differences of more than 10 years are labelled. All HA and NA trees are presented in Figs 3 and S4–S24.
Fig 5
Fig 5. Viruses sequenced in this study that have signatures of recent introduction.
For each segment, coloured tiles correspond to three different statuses: singletons, first detections and well-established lineages. Singletons represent the only detections of the lineage in Australia. In cases where two viruses from the same sampling effort were identical and were the only detections of that lineage, they were still considered a singleton (e.g. the NA segment of the NT/2015 viruses or the NA segment of the 8 H12N2 Ruddy Turnstone viruses from 2019, which have only ever been detected during that sampling event). Only the A allele NS segment was detected in these viruses. Phylogenetic examples (here excerpts from N8 and N5) are provided for each status, and branches are coloured as in Fig 3.
Fig 6
Fig 6. Inferred migration events of avian influenza viruses within Australia.
Locations included in each tree are marked by a white circle. Specific location names are presented in Fig 1A, and all state names are presented in the first panel and are as follows: VIC Victoria, NSW New South Wales, QLD Queensland, NT Northern Territory, WA Western Australia, SA South Australia and TAS Tasmania. Grey lines correspond potential migration events that were not detected in the analysis (i.e. migration event <1). Blue lines indicate migration events are derived from calculations of state changes (Markov Jumps), ranging from light to dark. Arrows connecting locations merely represent the direction from X to Y, and do not infer actual routes between two locations. As NP has more than a single discrete Australian lineage, we have generated two independent maps reflecting the 2 largest Australian lineages of NP (S25 Fig). Maps illustrating Bayes Factors, also generated using BSSVS can be found in S27 Fig, and Markov rewards also generated in this analysis are presented in S28 Fig. Map shapefile from mapsvg, distributed under a CC BY 4.0 licence. https://mapsvg.com/maps/australia.
Fig 7
Fig 7. Genome constellations of (A) H5 and (B) H7 viruses.
The phylogenies presented are time-scaled Maximum Clade Credibility Trees. Tips are coloured according to Australian state or territory. Scale bar denotes the year of sample collection. Node bars are the 95% HPD of node height, and posterior clade probability is presented on each branch. Adjacent to each tree are coloured tiles where each column of tiles refers to a segment, arranged according to size: PB2, PB1, PA, HA, NP, M, NS. We only included tiles for viruses sequenced in this study and in cases where the tiles are blank, no sequence was available for the segment. Different colours refer to different lineages, whereby tile colour scheme is retained for both H5 and H7 trees. For example, for the NS segment, viruses with an NS B lineage are coloured in orange. The viruses here fall into five different lineage clusters of NS A, and these are presented in two different shades of blue and green and pink. If a virus is a “mixed” infection, segments with two different lineages or subtypes are split to illustrate this. Map shapefile from mapsvg, distributed under a CC BY 4.0 licence. https://mapsvg.com/maps/australia.

References

    1. Bennett CE, Thomas R, Williams M, Zalasiewicz J, Edgeworth M, Miller H, et al.. The broiler chicken as a signal of a human reconfigured biosphere. R Soc Open Sci. 2018;5: doi: 10.1098/rsos.180325 - DOI - PMC - PubMed
    1. Bar-On YM, Phillips R, Milo R. The biomass distribution on Earth. Proc Natl Acad Sci USA. 2018;115(25):6506–11. doi: 10.1073/pnas.1711842115 - DOI - PMC - PubMed
    1. Lycett SJ, Duchatel F, Digard P. A brief history of bird flu. Philos Trans R Soc Lond, B, Biol Sci. 2019;374(1775):20180257. doi: 10.1098/rstb.2018.0257 - DOI - PMC - PubMed
    1. Gilbert M, Xiao XM, Robinson TP. Intensifying poultry production systems and the emergence of avian influenza in China: a ’One Health/Ecohealth’ epitome. Arch Public Health. 2017;75:48. doi: 10.1186/s13690-017-0218-4 - DOI - PMC - PubMed
    1. Global Consortium for H5N8 and Related Influenza Viruses. Role for migratory wild birds in the global spread of avian influenza H5N8. Science. 2016;354(6309):213–7. doi: 10.1126/science.aaf8852 - DOI - PMC - PubMed

Publication types