

A comparison of joint dichotomization and single dichotomization of interacting variables to discriminate a disease outcome
- PMID: 35536987
- PMCID: PMC10198136
- DOI: 10.1515/ijb-2021-0071
A comparison of joint dichotomization and single dichotomization of interacting variables to discriminate a disease outcome
Abstract
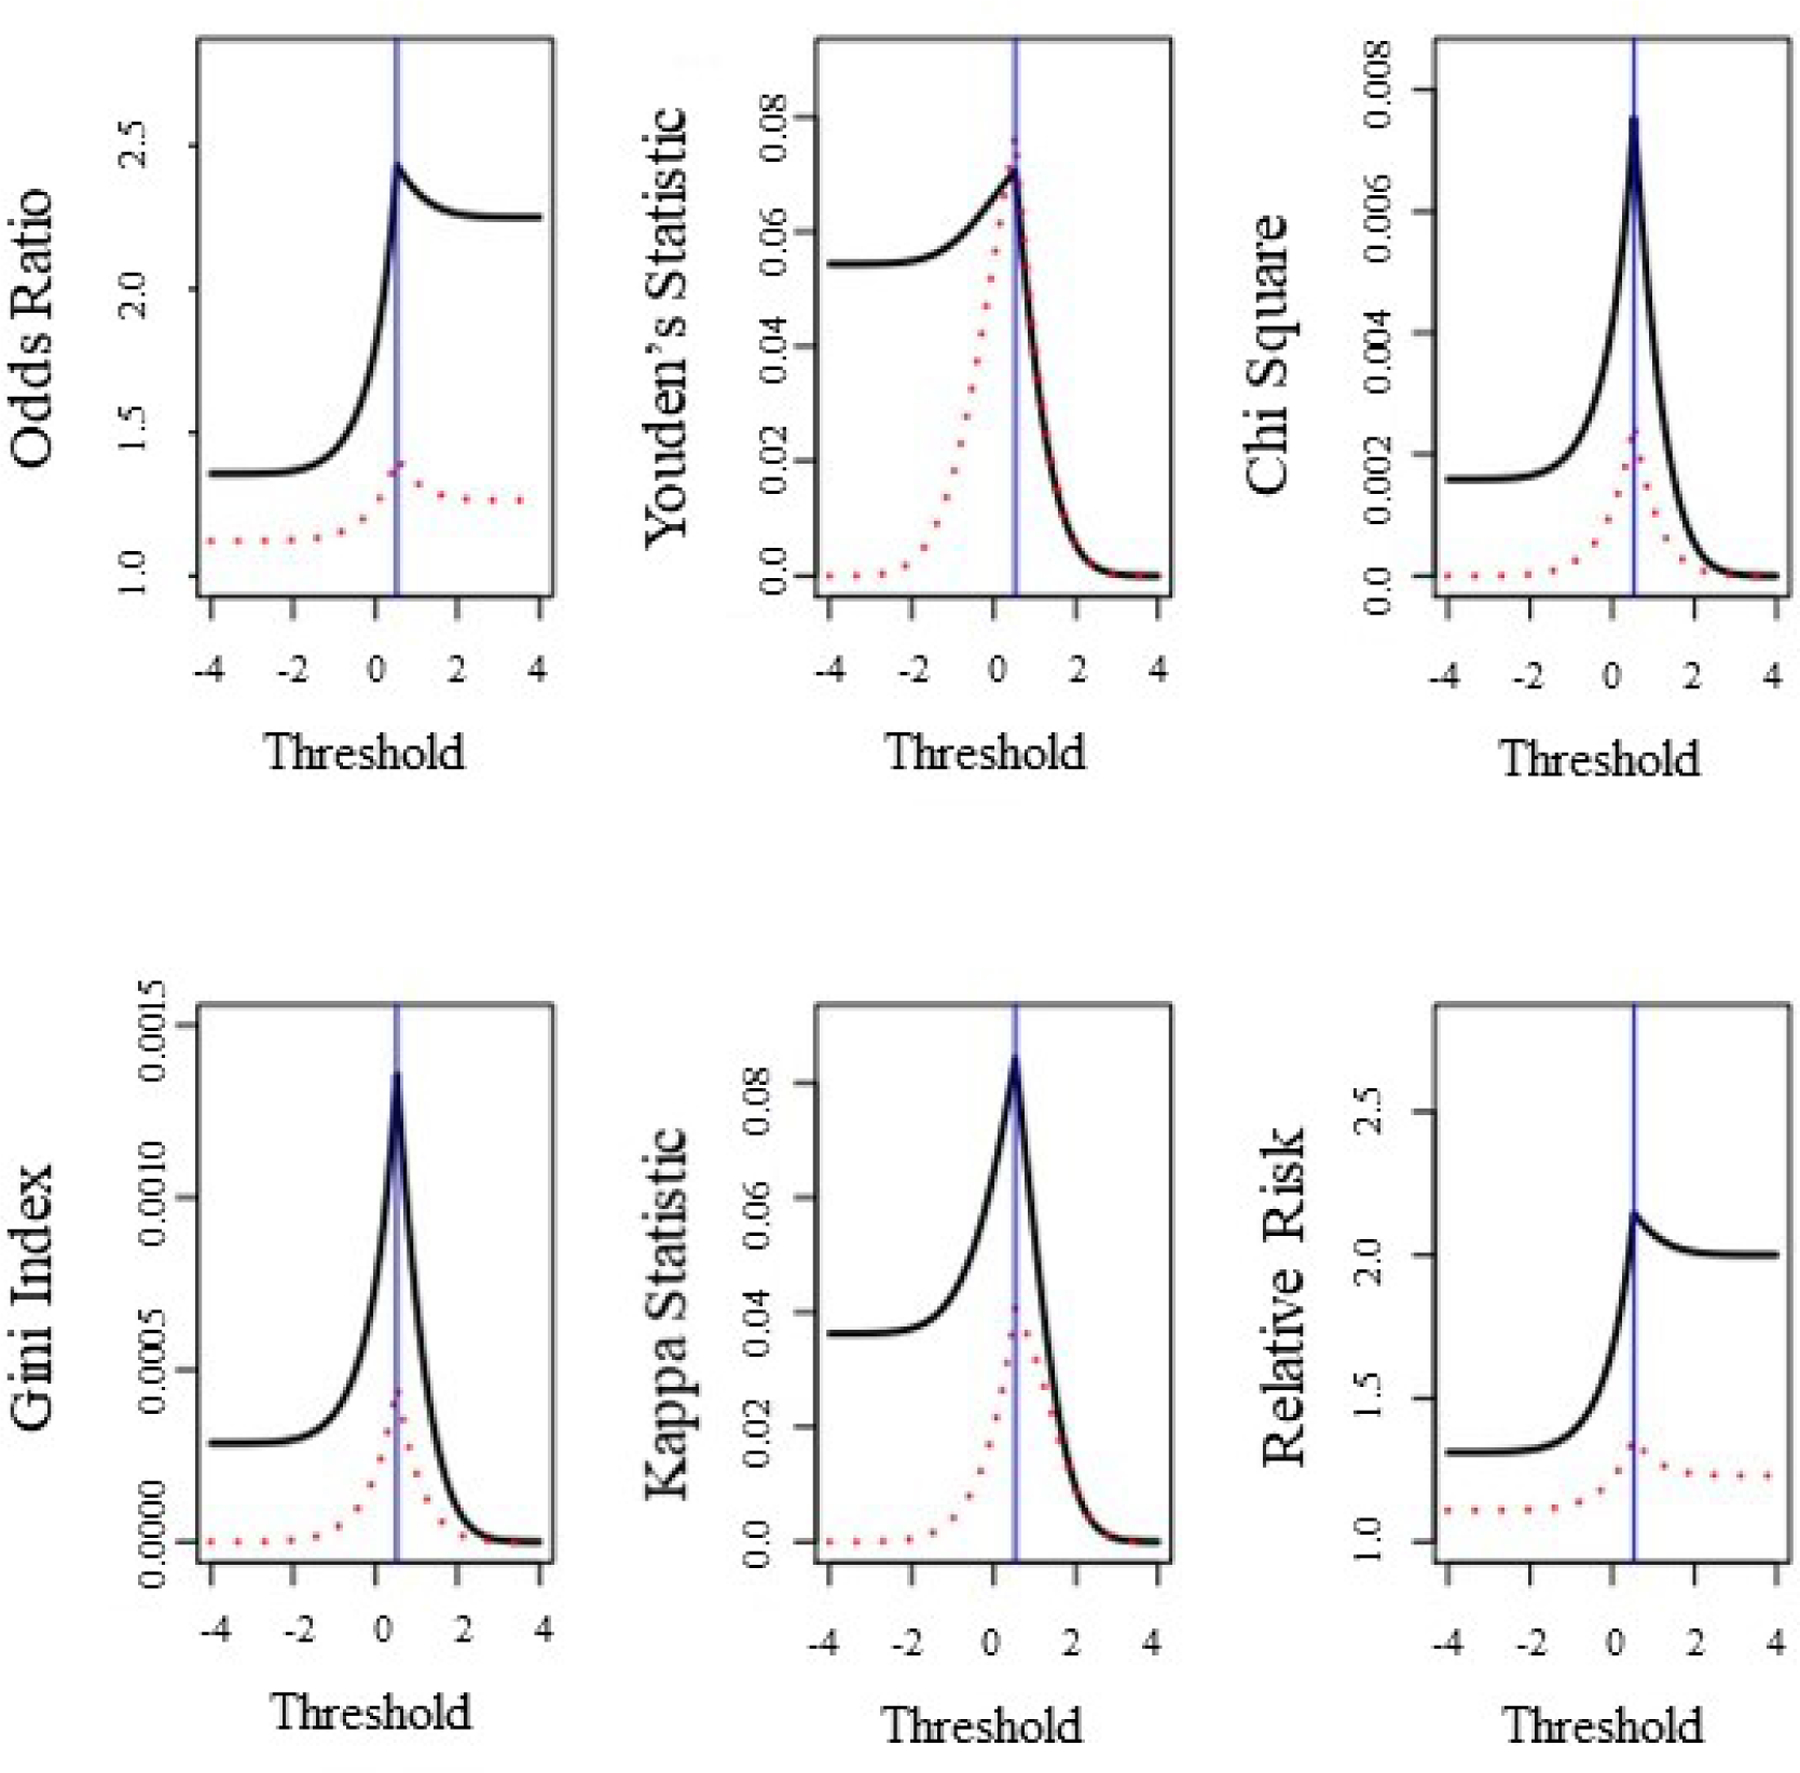
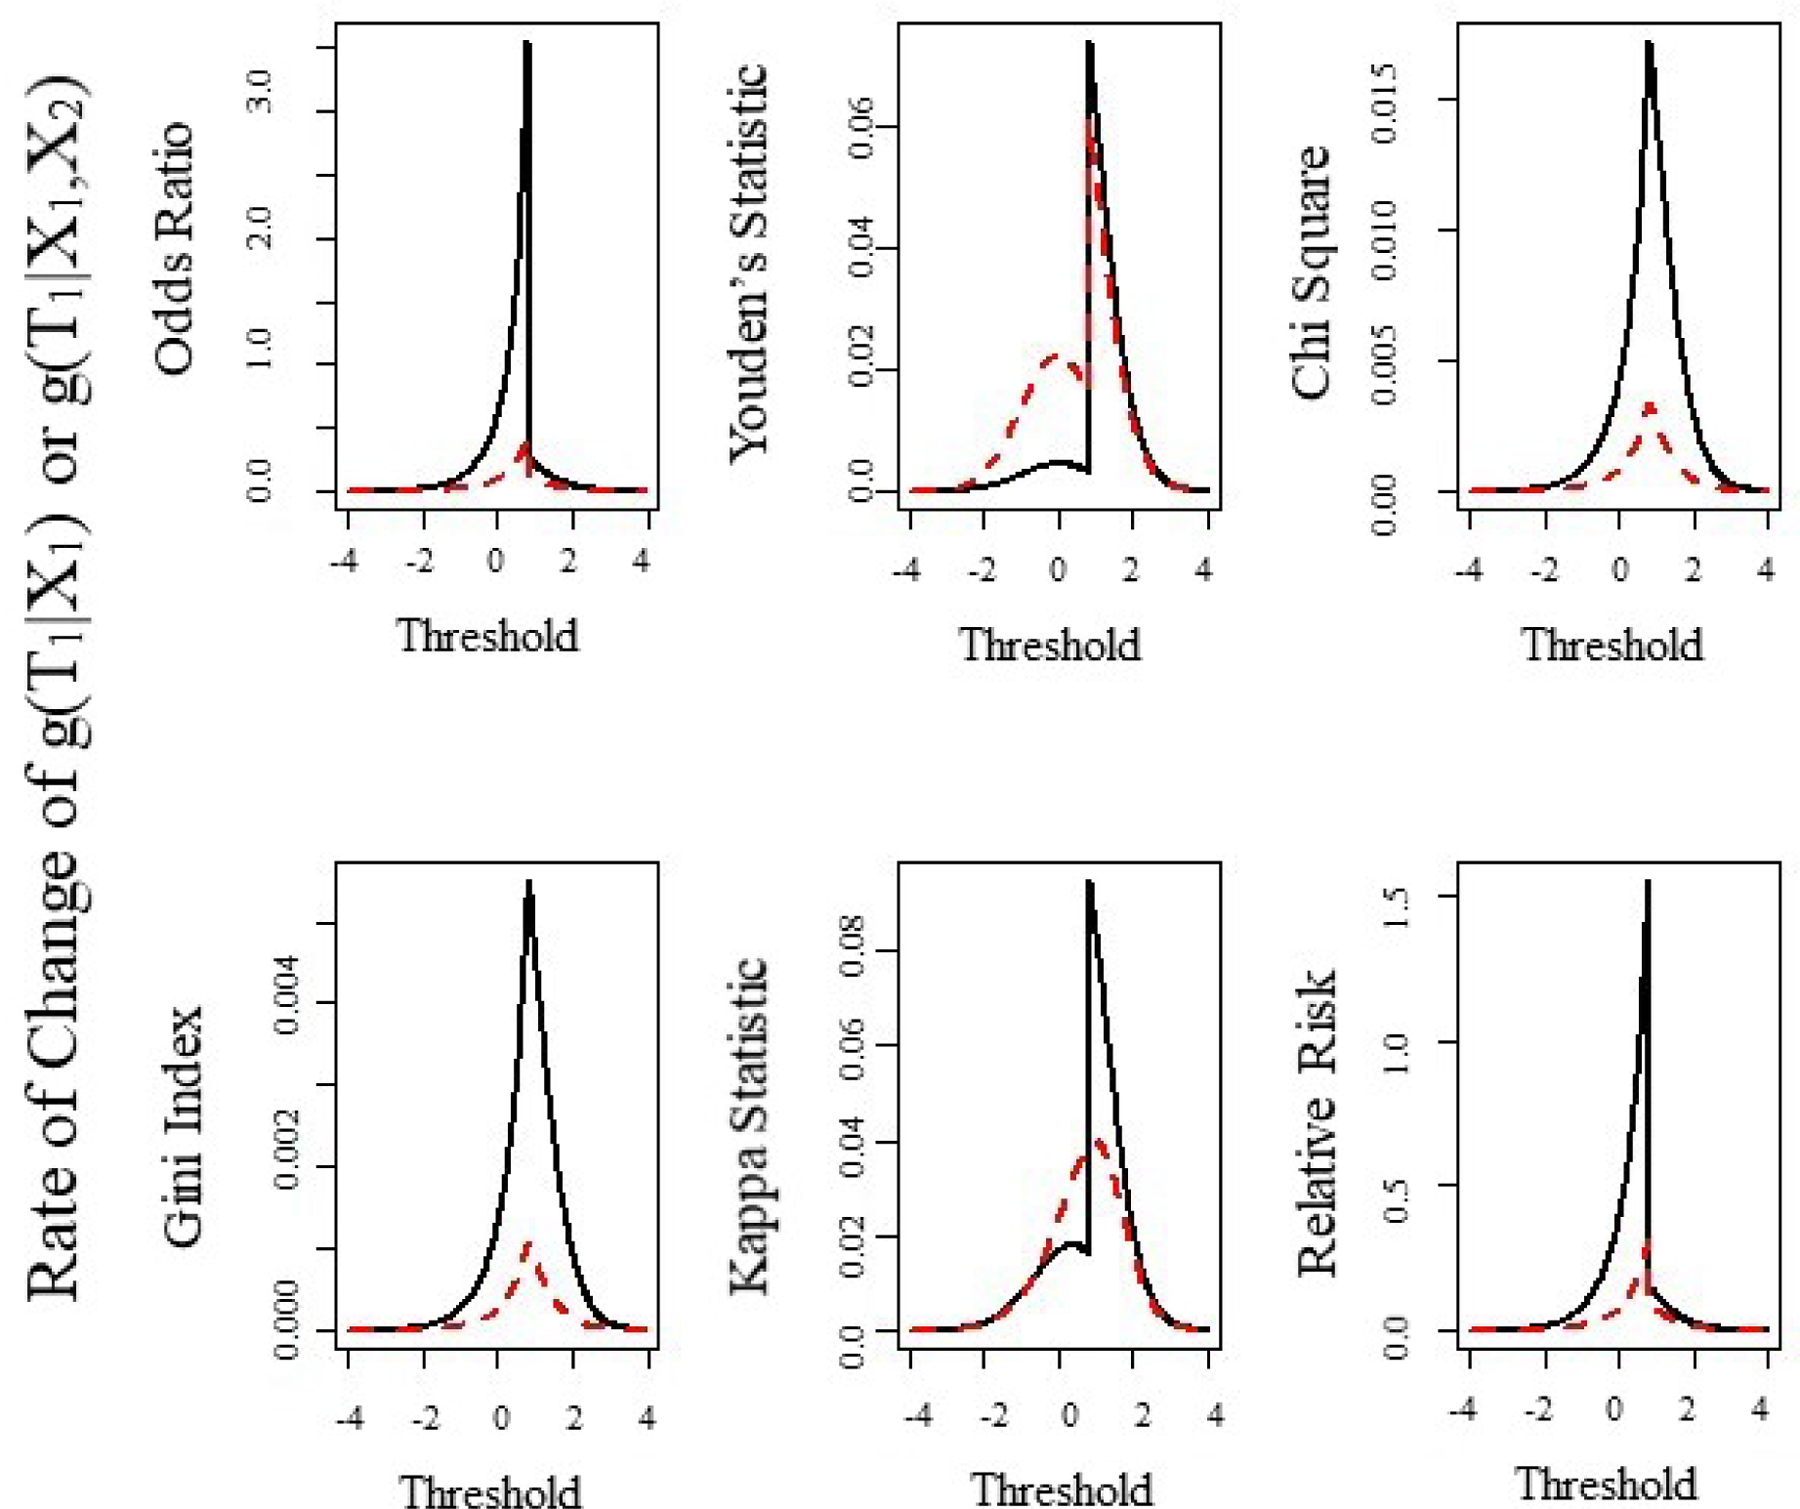
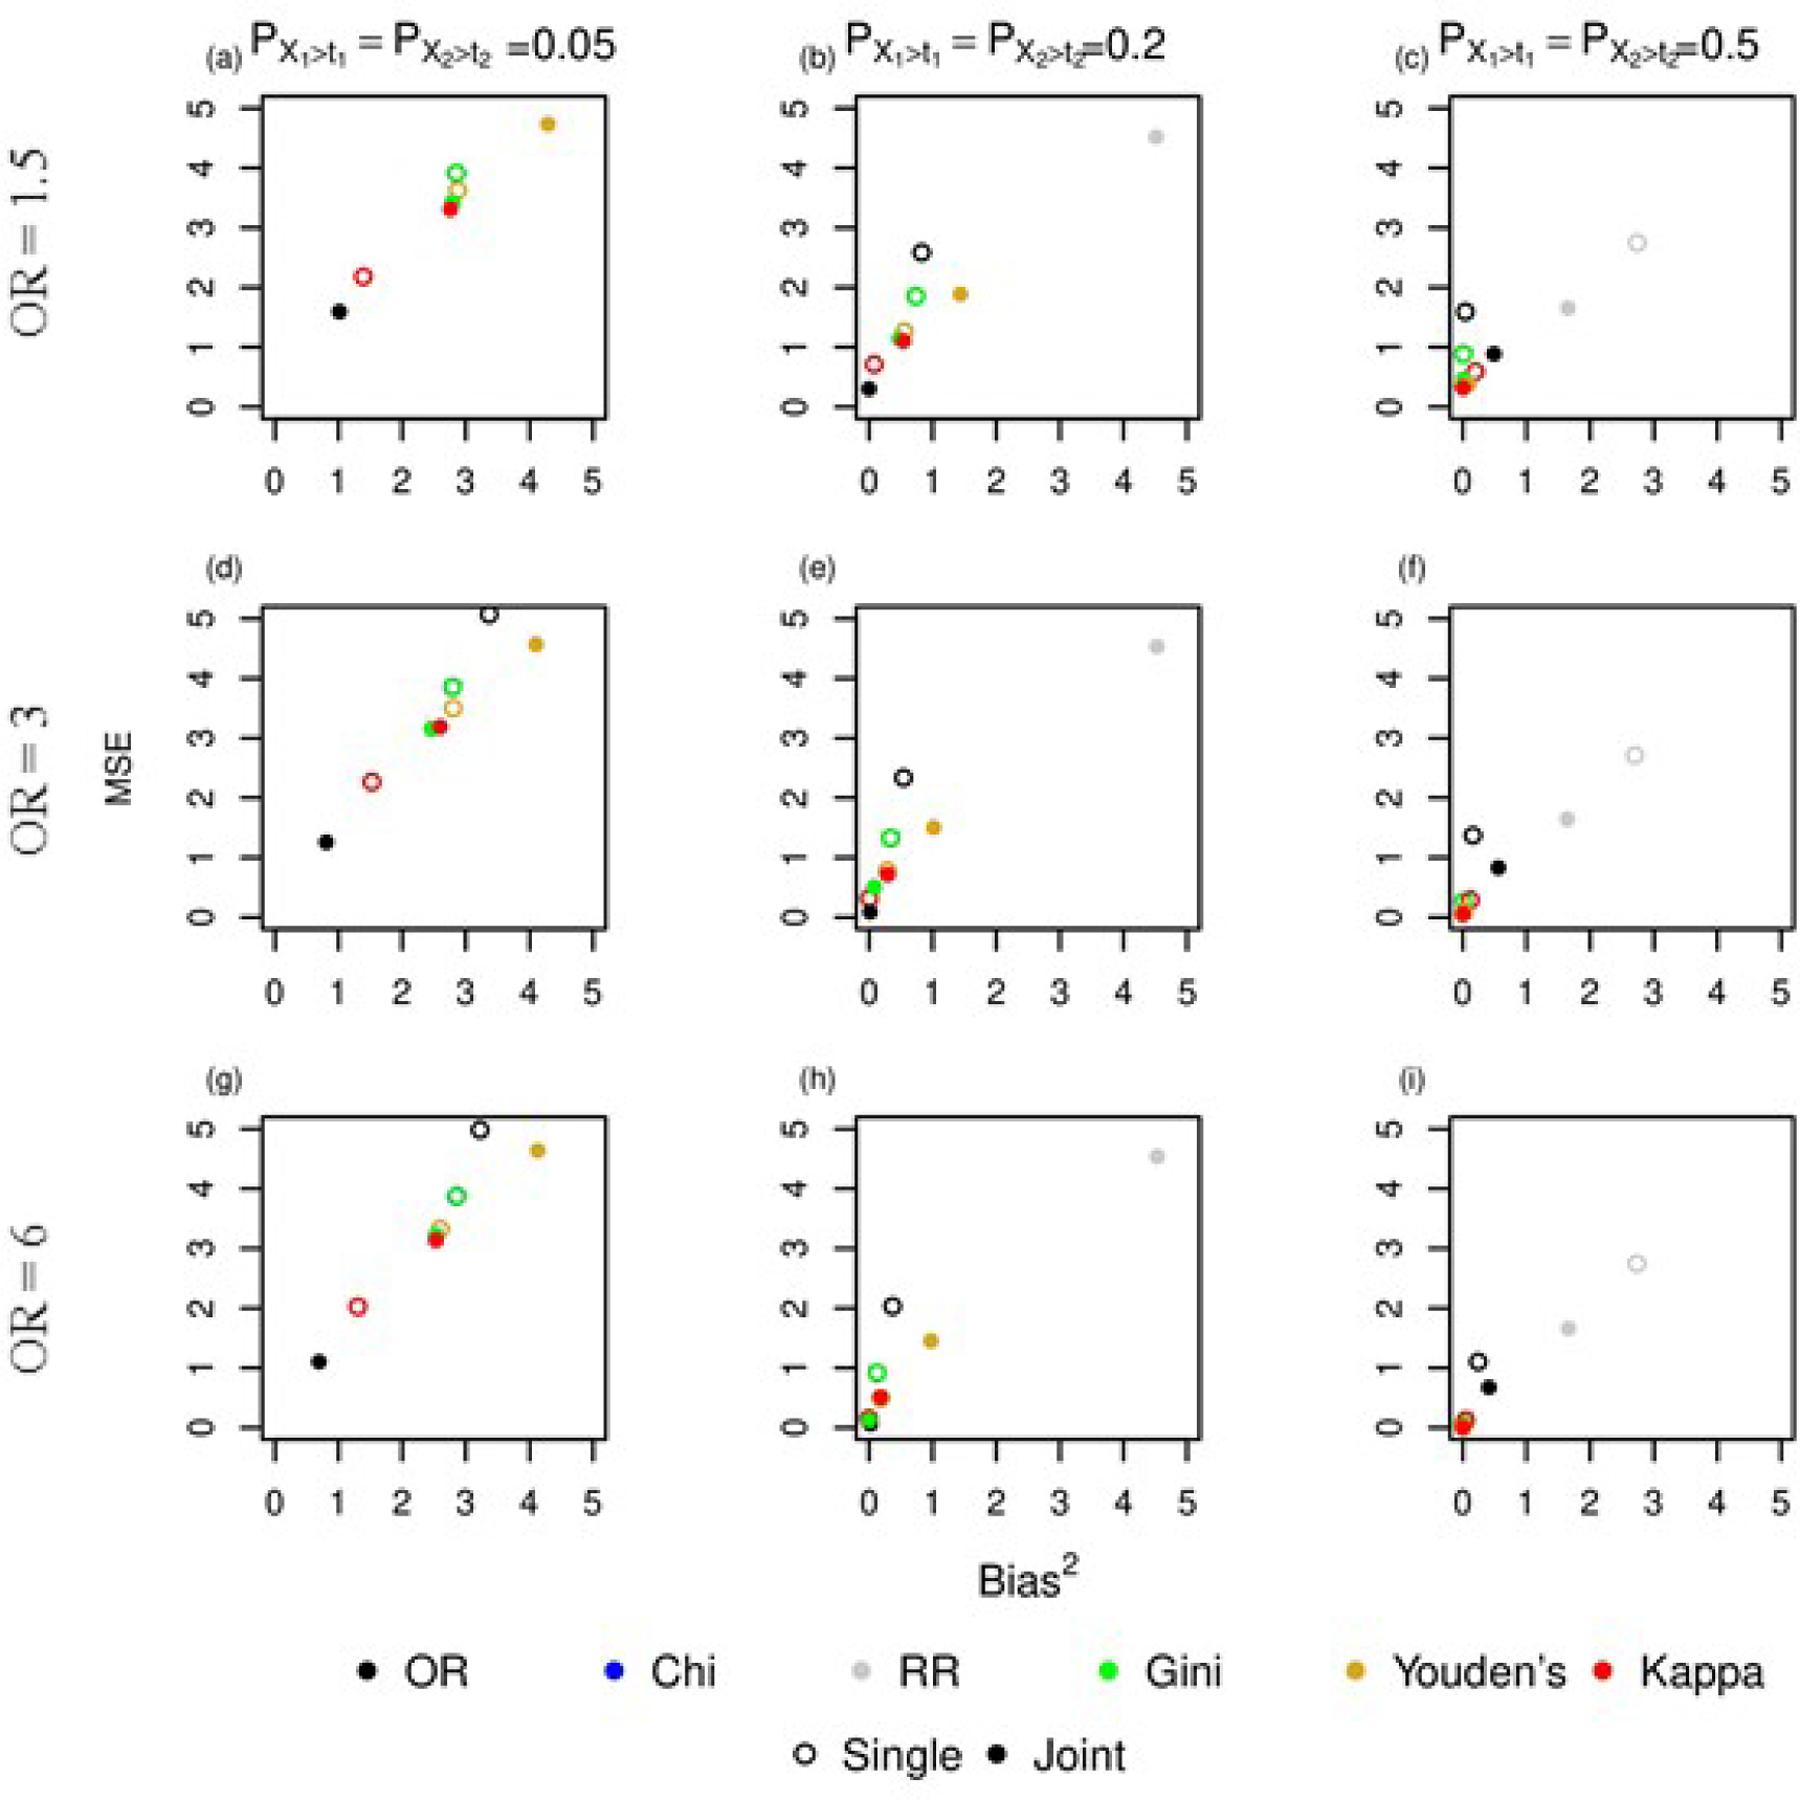
Dichotomization is often used on clinical and diagnostic settings to simplify interpretation. For example, a person with systolic and diastolic blood pressure above 140 over 90 may be prescribed medication. Blood pressure as well as other factors such as age and cholesterol and their interactions may lead to increased risk of certain diseases. When using a dichotomized variable to determine a diagnosis, if the interactions with other variables are not considered, then an incorrect threshold for the continuous variable may be selected. In this paper, we compare single dichotomization with joint dichotomization; the process of simultaneously optimizing cutpoints for multiple variables. A simulation study shows that simultaneous dichotomization of continuous variables is more accurate in recovering both 'true' thresholds given they exist.
Keywords: Youden’s; cutpoints; dichotomization; disease prediction; odds ratio.
© 2022 Walter de Gruyter GmbH, Berlin/Boston.
Figures

Similar articles
-
An evaluation of common methods for dichotomization of continuous variables to discriminate disease status.Commun Stat Theory Methods. 2017;46(21):10823-10834. doi: 10.1080/03610926.2016.1248783. Epub 2017 Aug 2. Commun Stat Theory Methods. 2017. PMID: 29962658 Free PMC article.
-
Inference for causal interactions for continuous exposures under dichotomization.Biometrics. 2011 Dec;67(4):1414-21. doi: 10.1111/j.1541-0420.2011.01629.x. Epub 2011 Jun 20. Biometrics. 2011. PMID: 21689079 Free PMC article.
-
[Dichotomization of continuous variables in logistic regression models].Rev Med Chil. 1996 Jul;124(7):836-42. Rev Med Chil. 1996. PMID: 9138372 Spanish.
-
The Impact of Item Misspecification and Dichotomization on Class and Parameter Recovery in LCA of Count Data.Multivariate Behav Res. 2019 Jan-Feb;54(1):113-145. doi: 10.1080/00273171.2018.1499499. Epub 2018 Dec 31. Multivariate Behav Res. 2019. PMID: 30595072 Review.
-
Mobile phone-based interventions for improving adherence to medication prescribed for the primary prevention of cardiovascular disease in adults.Cochrane Database Syst Rev. 2021 Mar 26;3(3):CD012675. doi: 10.1002/14651858.CD012675.pub3. Cochrane Database Syst Rev. 2021. PMID: 33769555 Free PMC article.
References
-
- Aoki K, Misumi J, Kimura T, Zhao W, Xie T, “Evaluation of Cutoff Levels for Screening of Gastric Cancer Using Serum Pepsinogens and Distributions of Levels of Serum Pepsinogen I, II and of PG I / PG II Ratios in a Gastric Cancer Case-Control Study”, Journal of Epidemiology volume 7, number 3, pages 143–151, (1997), DOI: 10.2188/jea.7.143 - DOI - PubMed
-
- Benjamin O, Lappin SL “End-Stage Renal Disease”, StatPearls[Internet], 2021. Sep 16. Treasure Island (FL): StatPearls Publishing; 2021 Jan–. - PubMed
-
- Boehning D, Holling H, Patilea V, “ A limitation of the diagnostic-odds ratio in determining an optimal cut-off value for a continuous diagnostic test”, Statistical Methods in Medical Research, volume 20, number 5, pages 541–550, (2011) - PubMed
-
- Breiman L, Friedman J, Stone CJ, Olshen RA, “ Classification and regression trees”, CRC press; (1984)
-
- Greiner M, Pfeiffer D, Smith R.D.t, “ Principles and practical application of the receiver operating characteristic analysis for diagnostic tests”, Preventive Veterinary Medicine volume 45, pages 23–41, (2000) - PubMed
Publication types
MeSH terms
Grants and funding
LinkOut - more resources
Full Text Sources