. 2022 May 24;119(21):e2202016119.
doi: 10.1073/pnas.2202016119. Epub 2022 May 10.

Autophagy in PDGFRα+ mesenchymal cells is essential for intestinal stem cell survival

Affiliations

Autophagy in PDGFRα+ mesenchymal cells is essential for intestinal stem cell survival

Yang Yang et al. Proc Natl Acad Sci U S A. .

Abstract

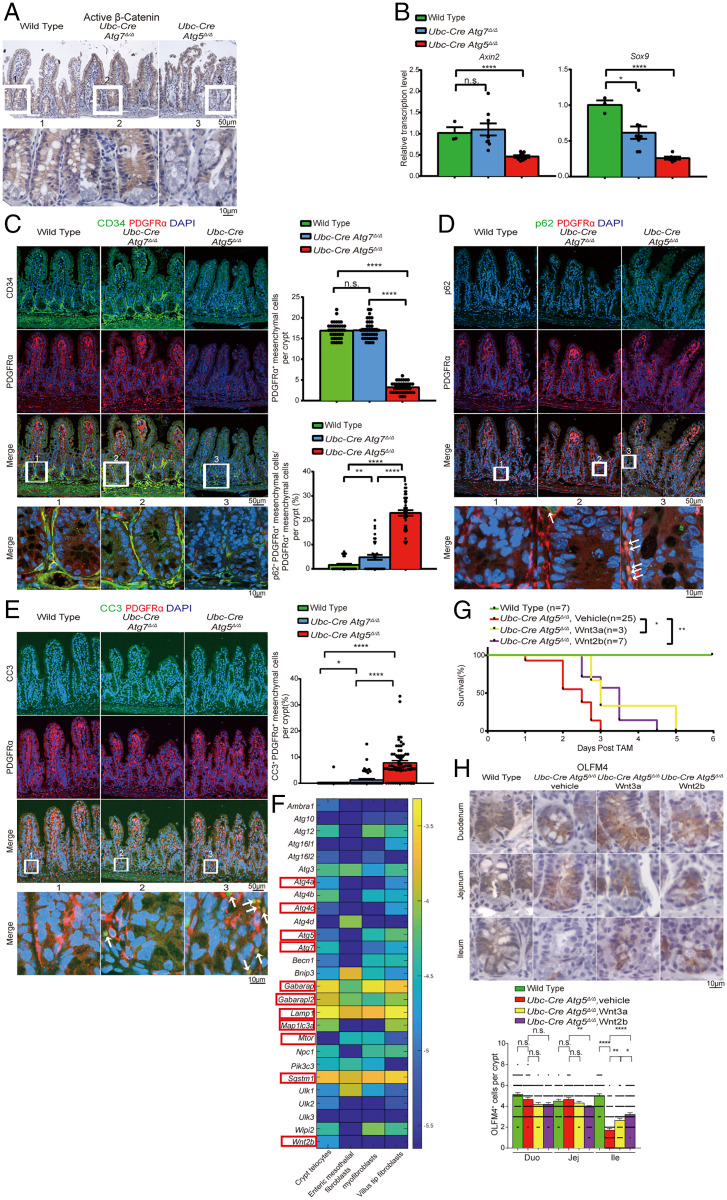
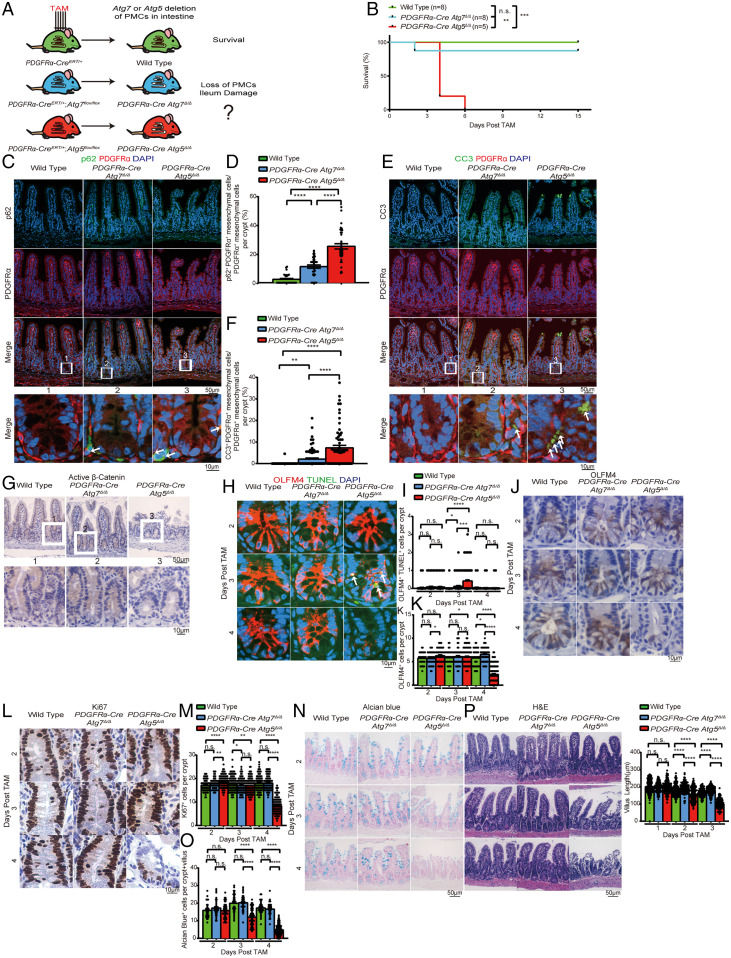
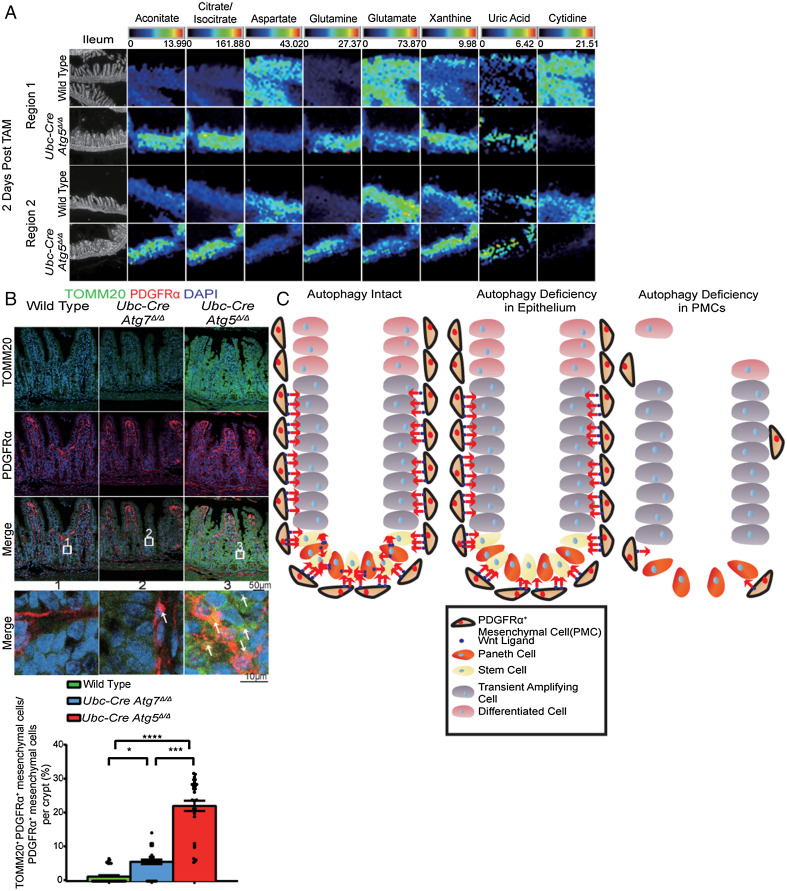
Autophagy defects are a risk factor for inflammatory bowel diseases (IBDs) through unknown mechanisms. Whole-body conditional deletion of autophagy-related gene (Atg) Atg7 in adult mice (Atg7Δ/Δ) causes tissue damage and death within 3 mo due to neurodegeneration without substantial effect on intestine. In contrast, we report here that whole-body conditional deletion of other essential Atg genes Atg5 or Fip200/Atg17 in adult mice (Atg5Δ/Δ or Fip200Δ/Δ) caused death within 5 d due to rapid autophagy inhibition, elimination of ileum stem cells, and loss of barrier function. Atg5Δ/Δ mice lost PDGFRα+ mesenchymal cells (PMCs) and Wnt signaling essential for stem cell renewal, which were partially rescued by exogenous Wnt. Matrix-assisted laser desorption ionization coupled to mass spectrometry imaging (MALDI-MSI) of Atg5Δ/Δ ileum revealed depletion of aspartate and nucleotides, consistent with metabolic insufficiency underlying PMC loss. The difference in the autophagy gene knockout phenotypes is likely due to distinct kinetics of autophagy loss, as deletion of Atg5 more gradually extended lifespan phenocopying deletion of Atg7 or Atg12. Thus, autophagy is required for PMC metabolism and ileum stem cell and mammalian survival. Failure to maintain PMCs through autophagy may therefore contribute to IBD.

Keywords: IBD; autophagy; intestine; metabolism; stem cells.


Conflict of interest statement

Competing interest statement: E.W. owns stock in Forma Therapeutics and is a founder of Vescor LLC, neither of which has anything to do with this manuscript. Note that K.R. was a coauthor on a 2021 Autophagy Guidelines paper with hundreds of others in the field, including several coauthors here.

Figures

Fig. 1.
Fig. 1.
Conditional, whole-body Atg5 deletion in adult mice leads to ileum damage and death. (A) Experimental design for generation of Atg7Δ/Δ mice and Atg5Δ/Δ mice. (B) Kaplan–Meier survival curve of TAM-treated wild-type, Atg7Δ/Δ, and Atg5Δ/Δ mice. ****P < 0.0001 (log-rank test). (C) Representative ileum hematoxylin and eosin-stained (H&E) histology with villus length quantification at indicated times from wild-type, Atg7Δ/Δ, and Atg5Δ/Δ mice. (D) Body weight of wild-type, Atg7Δ/Δ, and Atg5Δ/Δ mice at 3 d post-TAM. (E and F) Blood glucose (E) and FITC–dextran (F) concentration measured in milligrams per deciliter from wild-type, Atg7Δ/Δ, and Atg5Δ/Δ mice at indicated times. (G) Western blotting for ATG5, ATG7, and LC3 at indicated times with relative fold change of band intensity normalized to actin from the wild-type, Atg7Δ/Δ, and Atg5Δ/Δ ileum. All images represent one of three biological replicates. All quantification data represent mean ± SEM. *P < 0.05; **P < 0.01; ***P < 0.001; ****P < 0.0001; n.s., not significant (unpaired t test). n ≥ 3 mice per group. See also SI Appendix, Figs. S1 and S2.
Fig. 2.
Fig. 2.
Ileum stem cells are lost in Atg5Δ/Δ mice. (AF) Representative ileum IHC staining of p62 (A) with quantification (B), Alcian blue staining (C), IHC staining of Ki67 (D), OLFM4 (E), and lysozyme (F) with quantification at indicated times from wild-type, Atg7Δ/Δ, and Atg5Δ/Δ mice. Red arrows indicate p62 aggregates. (G and H) Representative ileum IF costaining of p62 (G) and TUNEL (H) with OLFM4 and quantification at indicated times from wild-type, Atg7Δ/Δ, and Atg5Δ/Δ mice. White arrows indicate p62 or TUNEL colocalized with OLFM4. All images represent one of three biological replicates. All quantification data represent mean ± SEM. *P < 0.05; **P < 0.01; ***P < 0.001; ****P < 0.0001; n.s., not significant (unpaired t test). n ≥ 3 mice per group. See also SI Appendix, Figs. S3–S6.
Fig. 3.
Fig. 3.
Atg5 is required to maintain PMCs. (A) Representative ileum IHC staining of stabilized β-catenin at 3 d post-TAM from wild-type, Atg7Δ/Δ, and Atg5Δ/Δ mice. (B) qRT-PCR of Axin2 and Sox9 for the ileum from wild-type, Atg7Δ/Δ, and Atg5Δ/Δ mice. Data represent mean ± SEM. *P < 0.05; ****P < 0.0001; n.s., not significant (unpaired t test). n ≥ 3 mice per group and represents one of three biological replicates. (CE) Representative ileum IF costaining of CD34 and PDGFRα at 3 d post-TAM (C), p62 and PDGFRα (D), and CC3 and PDGFRα at 2 d post-TAM (E) with quantification from wild-type, Atg7Δ/Δ, and Atg5Δ/Δ mice. White arrows indicate colocalization of p62 or CC3 with PDGFRα. (F) Single-cell RNA-sequencing expression map of essential autophagy genes. Color bar is the log10 of the fraction of cellular messenger RNA (averaged over all the sequenced cells from the indicated cluster). Selected autophagy genes and Wnt2b are marked with red rectangles. (G and H) Kaplan–Meier survival curve (G) and representative intestine IHC of OLFM4 at 3 d post-TAM with quantification (H) from Atg5Δ/Δ and Atg5Δ/Δ mice supplemented with Wnt3a or Wnt2b. Wnt3a or Wnt2b was administered to the mice by intraperitoneal injection with an amount of 50 mg/kg per mouse, two injections per day starting from the last day of TAM injection. *P < 0.05; **P < 0.01 (log-rank test) in G. All images represent one of three biological replicates. All quantification data except in G represent mean ± SEM. *P < 0.05; **P < 0.01; ***P < 0.001; ****P < 0.0001; n.s., not significant (unpaired t test). n ≥ 3 mice per group. See also SI Appendix, Figs. S9 and S10. Duo, duodenum; Ile, ileum; Jej, jejunum.
Fig. 4.
Fig. 4.
Deletion of Atg5 in PMCs causes loss of ileum stem cells. (A) Experimental design for generation of PDGFRαCreERT/+ Atg5Δ/Δ and Atg7Δ/Δ mice. (B) Kaplan–Meier survival curve of wild-type, PDGFRαCre Atg7Δ/Δ, and PDGFRαCre Atg5Δ/Δ mice. **P< 0.01, ***P < 0.001; n.s., not significant (log-rank test). (CF) Representative ileum IF costaining of p62 and PDGFRα (C and D) and costaining of CC3 and PDGFRα (E and F) with quantification at 3 d post-TAM from wild-type, PDGFRαCre Atg7Δ/Δ, and PDGFRαCre Atg5Δ/Δ mice. White arrows indicate colocalization of p62 or CC3 with PDGFRα. (GP) Representative ileum IHC staining of stabilized β-catenin (G) at 4 d post-TAM, costaining of OLFM4 and TUNEL (H and I), OLFM4 (J and K), Ki67 (L and M), Alcian blue staining (N and O), and H&E histology with villus length quantification (P) at the indicated times from wild-type, PDGFRαCre Atg7Δ/Δ, and PDGFRαCre Atg5Δ/Δ mice. All images represent one of three biological replicates. All quantification data represent mean ± SEM. *P < 0.05; **P < 0.01; ***P < 0.001; ****P < 0.0001; n.s., not significant (unpaired t test). n ≥ 3 mice per group. See also SI Appendix, Fig. S11.
Fig. 5.
Fig. 5.
Autophagy maintains ileum aspartate and nucleotide pools. (A) MALDI-MSI data from the wild-type and Atg5Δ/Δ ileum at 2 d post-TAM from two different regions. The scale bar on the top of each image set represents the intensity range of ions detected for each metabolite. The white pixels represent the PMCs. (B) Representative ileum IF costaining of TOMM20 and PDGFRα with quantification at 2 d post-TAM from wild-type, Atg7Δ/Δ, and Atg5Δ/Δ mice. All images represent one of three biological replicates. (C) Mechanism by which autophagy is required for PMC survival to maintain intestinal homeostasis. All images represent one of three biological replicates. All quantification data were a combination of three biological replicates and represent mean ± SEM. *P < 0.05; ***P < 0.001; ****P < 0.0001; n.s., not significant (unpaired t test). n > 3 mice per group. See also SI Appendix, Fig. S12.
Fig. 6.
Fig. 6.
Gradual Atg5 deletion rescues ileum function, prolongs survival, and causes death from neurodegeneration. (A) Experimental design for generation of Atg7Δ/Δ and Atg5Δ/Δ mice by slow deletion. (B) Kaplan–Meier survival curve of TAM-treated wild-type, Atg7Δ/Δ, and Atg5Δ/Δ mice. *P < 0.05; ****P < 0.0001 (log-rank test). (C) Representative ileum H&E histology from wild-type, Atg7Δ/Δ, and Atg5Δ/Δ mice by slow deletion at the indicated times. (DF) Western blotting for ATG5, ATG7, and LC3 (D) and representative ileum IHC staining of p62 (E) and OLFM4 (F) with quantification at 3 d post-TAM from wild-type, Atg7Δ/Δ, and Atg5Δ/Δ mice by slow deletion. Red arrows indicate p62 aggregates. (GJ) Representative ileum IF costaining of CD34 and PDGFRα with quantification (G and H) and costaining of p62 and PDGFRα with quantification (I and J) at 3 d post-TAM from wild-type, Atg7Δ/Δ, and Atg5Δ/Δ mice by slow deletion. White arrows indicate colocalization of p62 with PDGFRα, and we magnified the crypt region to focus on PMCs, which are adjacent to stem cells. All images represent one of three biological replicates. All quantification data represent mean ± SEM. *P < 0.05; **P < 0.01; ***P < 0.001; ****P < 0.0001; n.s., not significant (unpaired t test). n ≥ 3 mice per group. All the time points were counted from the fourth injection of TAM (day 0). See also SI Appendix, Fig. S13.

Similar articles

Cited by

References

    1. Kaur J., Debnath J., Autophagy at the crossroads of catabolism and anabolism. Nat. Rev. Mol. Cell Biol. 16, 461–472 (2015). - PubMed
    1. Dikic I., Elazar Z., Mechanism and medical implications of mammalian autophagy. Nat. Rev. Mol. Cell Biol. 19, 349–364 (2018). - PubMed
    1. Mizushima N., Komatsu M., Autophagy: Renovation of cells and tissues. Cell 147, 728–741 (2011). - PubMed
    1. Johansen T., Lamark T., Selective autophagy mediated by autophagic adapter proteins. Autophagy 7, 279–296 (2011). - PMC - PubMed
    1. Okamoto K., Organellophagy: Eliminating cellular building blocks via selective autophagy. J. Cell Biol. 205, 435–445 (2014). - PMC - PubMed

Publication types

Substances