. 2022 May 17;119(20):e2115709119.
doi: 10.1073/pnas.2115709119. Epub 2022 May 10.

Induction of human trophoblast stem-like cells from primed pluripotent stem cells

Affiliations

Induction of human trophoblast stem-like cells from primed pluripotent stem cells

Yu Jin Jang et al. Proc Natl Acad Sci U S A. .

Abstract

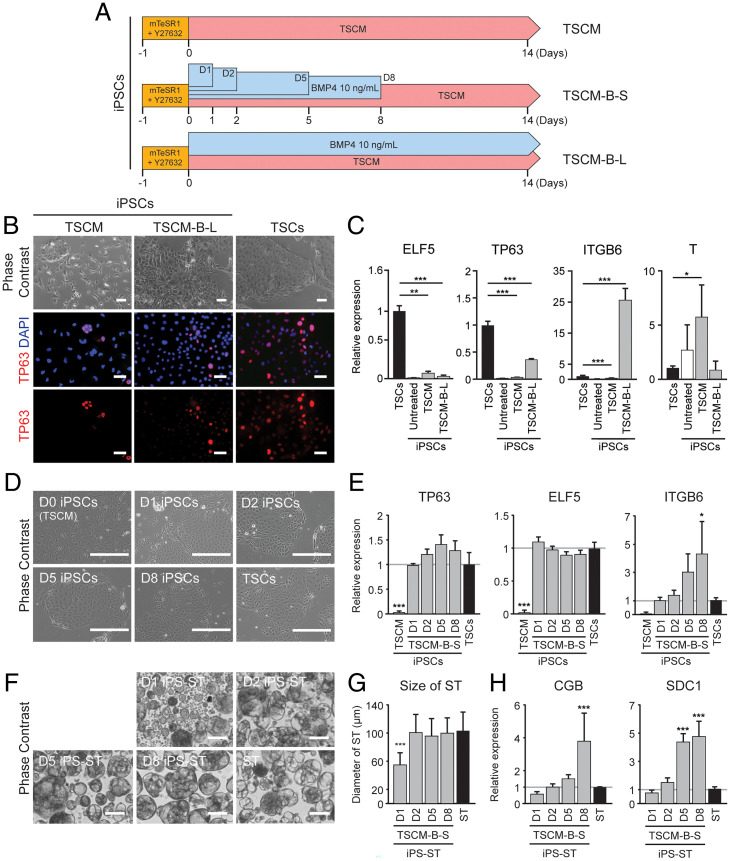
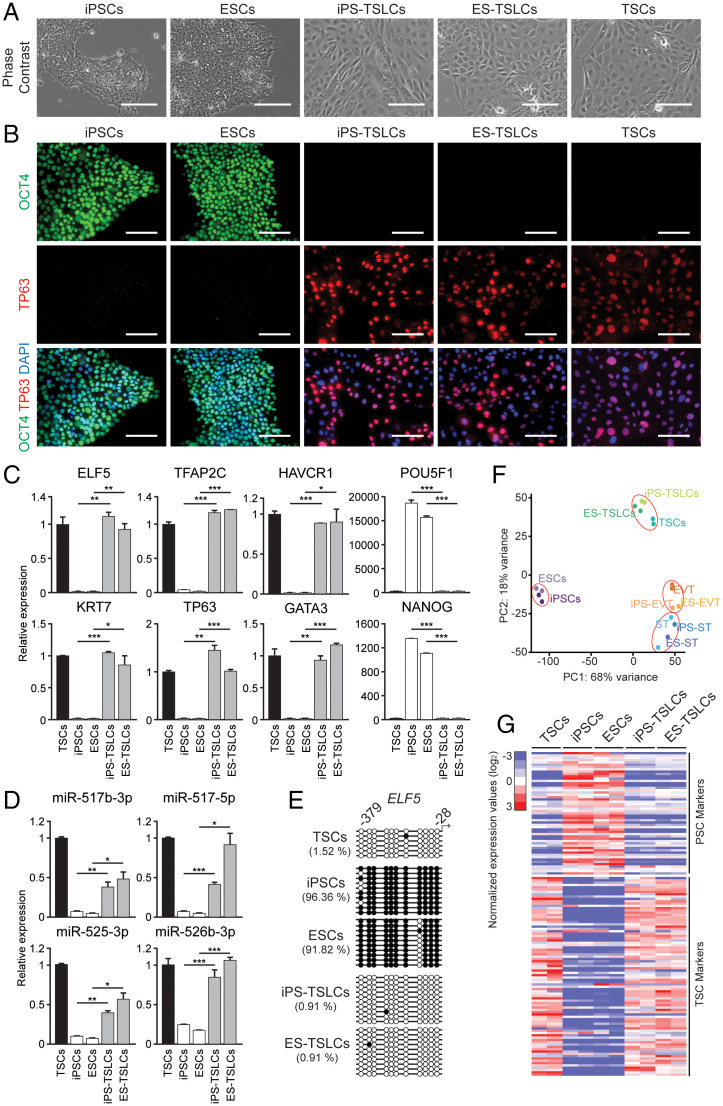
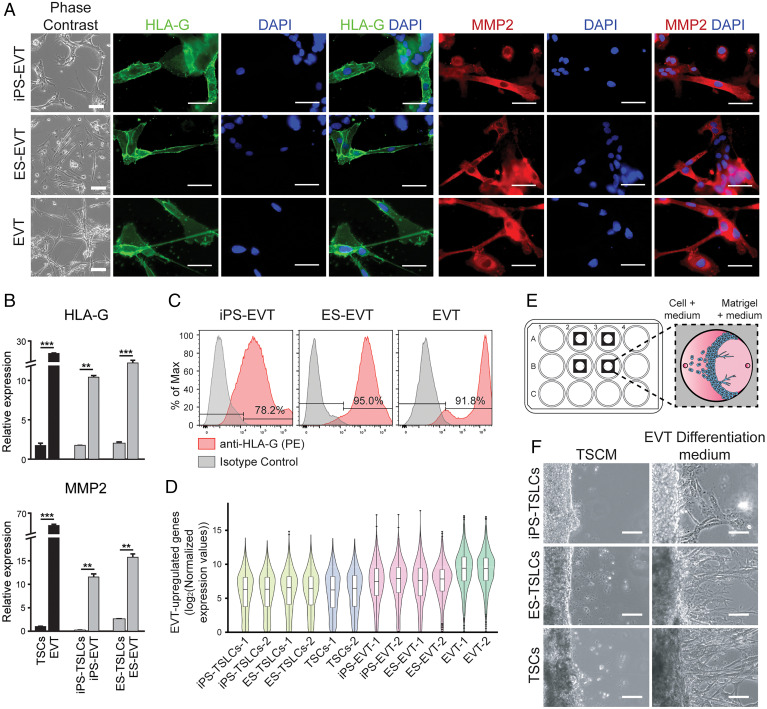
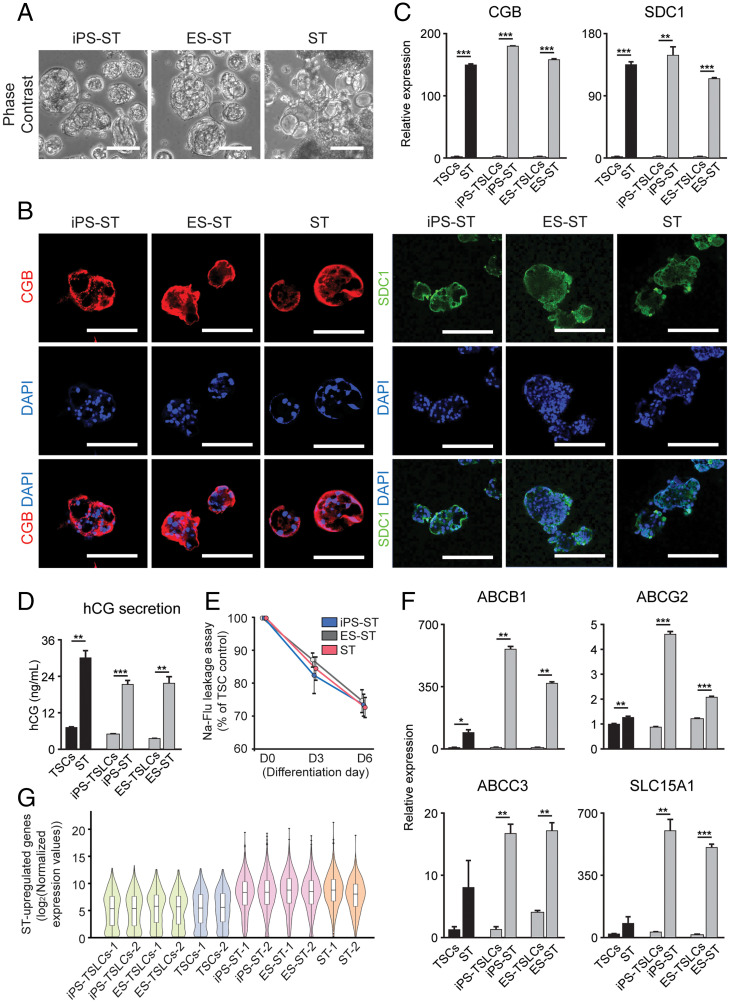
The placenta is a transient but important multifunctional organ crucial for healthy pregnancy for both mother and fetus. Nevertheless, limited access to human placenta samples and the paucity of a proper in vitro model system have hampered our understanding of the mechanisms underlying early human placental development and placenta-associated pregnancy complications. To overcome these constraints, we established a simple procedure with a short-term treatment of bone morphogenetic protein 4 (BMP4) in trophoblast stem cell culture medium (TSCM) to convert human primed pluripotent stem cells (PSCs) to trophoblast stem-like cells (TSLCs). These TSLCs show not only morphology and global gene expression profiles comparable to bona fide human trophoblast stem cells (TSCs) but also long-term self-renewal capacity with bipotency that allows the cells to differentiate into functional extravillous trophoblasts (EVT) and syncytiotrophoblasts (ST). These indicate that TSLCs are equivalent to genuine human TSCs. Our data suggest a straightforward approach to make human TSCs directly from preexisting primed PSCs and provide a valuable opportunity to study human placenta development and pathology from patients with placenta-related diseases.

Keywords: BMP4; human pluripotent stem cells; human trophoblast stem cells; primed pluripotency; trophoblast stem-like cells.


Conflict of interest statement

The authors declare no competing interest.

Figures

Fig. 1.
Fig. 1.
Two days of BMP4 treatment with long-term culture in TSCM is sufficient to establish TSLCs from PSCs. (A) Schematic diagram of induction protocol. TSCM is used as a basal medium. There are three conditions tested to induce TSCs from human iPSCs. One is to culture the iPSCs in TSCM for over 14 d (TSCM), another is to culture the iPSCs in TSCM with BMP4 10 ng/mL for the first 1, 2, 5, or 8 d and replace TSCM without BMP4 (TSCM-B-S; D1, D2, D5, and D8), and the other is to culture the iPSCs in TSCM with BMP4 10 ng/mL for the entire duration (TSCM-B-L). (B) Representative phase contrast (Top) and immunofluorescent (IF) images (Middle and Bottom) of iPSCs cultured in TSCM or TSCM-B-L conditions and TSCs. Red indicates the protein expression of TP63. Blue (DAPI) indicates the nuclei. Overlayed images are shown in the Middle. Scale bars indicate 100 μm. (C) Relative transcript levels of TSCs (ELF5 and TP63), amnion (ITGB6), and mesendoderm (T) marker genes in the indicated cells. Error bars indicate SEM (biological repeats n = 3). Significance was indicated with *P < 0.05, **P < 0.01 and ***P < 0.001. (D) Representative phase contrast images of iPSCs cultured in TSCM or TSCM-B-S conditions (D1, D2, D5, and D8). TSCs were shown as a control. Scale bars indicate 400 μm. (E) Relative transcript levels of TSCs (TP63 and ELF5) and amnion (ITGB6) marker genes in the indicated conditions. Error bars indicate SEM (biological repeats n = 4). Significance was indicated with *P < 0.05 and ***P < 0.001. (F) Representative phase contrast images of iPS-ST from the indicated conditions. The ST were differentiated from TSCs. Scale bars indicate 100 μm. (G) Bar graph showing diameter of 3D-cultured iPS-ST and ST from each condition. Error bars indicate SEM (biological repeats n = 3). Significance was indicated with ***P < 0.001. (H) Relative transcript levels of ST marker genes (CGB and SDC1) in the indicated conditions. Error bars indicate SEM (biological repeats n = 3). Significance was indicated with ***P < 0.001.
Fig. 2.
Fig. 2.
TSLCs derived from primed iPSCs and ESCs show comparable gene expression signatures to TSCs. (A) Representative phase contrast images of iPSCs, ESCs (H9), iPS-TSLCs, ES-TSLCs, and control TSCs. Scale bars indicate 100 μm; all images taken at the same magnification. (B) Immunofluorescent (IF) staining images showing the protein expression of PSC marker OCT4 (green, Top) and TSC marker TP63 (red, Middle) in the indicated cell types. Overlayed images of OCT4 and TP63 are shown in the Bottom with the nuclei staining with DAPI (blue). Scale bars indicate 100 μm. (C and D) Relative transcript levels of TSC markers (ELF5, TFAP2C, HAVCR1, KRT7, TP63, and GATA3) and PSC markers (POU5F1 and NANOG) (C) and TSC-specific miRNA clusters (miR-525-3p, miR-526b-3p, miR-517b-3p, and miR-517-5p) (D) in the indicated cell types. Error bars indicate SEM (biological repeats n = 3). Significance was indicated with *P value < 0.05, **P value < 0.01, and ***P value < 0.001. (E) Distribution of methylated CpG sites (filled circles) at the ELF5 promoter in the indicated cell types. The relative percentage of methylated CpG sites is indicated with cell types. (F) PCA for gene expression of the indicated cell types. Each dot is one biological replicate. (G) A heatmap showing normalized relative expression of PSC (31) and TSC markers (21) (Dataset S1) in the indicated cell types indicated. y axis shows representative PSC and TSC markers. Each cell type is represented by 2 biological replicates in each column. Relative expression was calculated by dividing the level of a gene with average gene expression of all cell types.
Fig. 3.
Fig. 3.
TSLCs can differentiate into EVT-like cells. (A) Representative phase contrast (Left) and immunofluorescent (IF) images of indicated cell types. Green indicates the protein expression of HLA-G. Red indicates the protein expression of MMP2. Blue (DAPI) indicates nuclei. Overlayed images are shown on the Right. Scale bars indicate 100 μm. (B) Relative transcript levels of EVT marker genes (HLA-G and MMP2) in indicated cell types to control TSCs. Error bars indicate SEM (biological repeats n = 3). Significance was indicated with **P < 0.01 and ***P < 0.001. (C) Flow cytometry analysis of surface HLA-G expression was performed with iPSC-EVT, ES-EVT, and EVT at 8 d, which were differentiated from iPS-TSLCs, ES-TSLCs, and TSCs. The expression was compared with an isotype control of each cell type. (D) Violin plots showing the expression distribution of 833 EVT-up-regulated genes (3) (Dataset S2) in the indicated cell types. The box indicates 25th, 50th, and 75th percentiles. (E) Schematic illustration of imaging chamber (32). Imaging chambers were adhered to the bottom of a 12-well plate. The Matrigel and medium (TSCM or EVT differentiation medium) mix was added to one of the open ports and allowed to equilibrate at 37 °C. After 1 h, the TSLCs or TSCs were seeded into another port with 30 μL of TSCM or EVT differentiation medium. One milliliter of TSCM or EVT differentiation medium was added to each well. (F) Representative phase contrast images of invading cells in TSCM or EVT differentiation medium at 8 d. Scale bars indicate 100 μm.
Fig. 4.
Fig. 4.
TSLCs can differentiate into ST-like cells. (A) Representative phase contrast of indicated cell types. Scale bars indicate 100 μm. (B) Representative immunofluorescent (IF) images of indicated cell types. Red indicates the protein expression of CGB. Green indicates the protein expression of SDC1. Blue (DAPI) indicates the nuclei. Overlayed images are shown at Bottom. Scale bars indicate 100 μm. (C) Relative transcript levels of ST marker genes (CGB and SDC1) in indicated cell types to control TSCs. Error bars indicate SEM (biological repeats n = 3). Significance was indicated with **P < 0.01 and ***P < 0.001. (D) The protein level of secreted hCG in indicated cell types. Error bars indicate SEM (biological repeats n = 3). Significance was indicated with **P < 0.01 and ***P < 0.001. (E) Leakage of sodium fluorescein (Na-Flu) through iPS-ST, ES-ST, and ST differentiated on 3 d and 6 d post seeding. Data are presented as mean ± SD for 5 biological repeats and calculated as % of each 0 d control. (F) Relative transcript levels of multiple ABC transporters (ABCB1, ABCG2, and ABCC3) and carrier transporter (SLC15A1) in indicated cell types to control TSCs. Error bars indicate SEM (biological repeats n = 3). Significance was indicated with *P < 0.05, **P < 0.01 and ***P < 0.001. (G) Violin plots showing the expression distribution of 911 ST-up-regulated genes (3) (Dataset S3) in the indicated cell types. The box indicates 25th, 50th, and 75th percentiles.

Similar articles

Cited by

References

    1. Lewis R. M., Cleal J. K., Hanson M. A., Review: Placenta, evolution and lifelong health. Placenta 33 (suppl.), S28–S32 (2012). - PubMed
    1. Guttmacher A. E., Maddox Y. T., Spong C. Y., The Human Placenta Project: Placental structure, development, and function in real time. Placenta 35, 303–304 (2014). - PMC - PubMed
    1. Okae H., et al. , Derivation of human trophoblast stem cells. Cell Stem Cell 22, 50–63.e6 (2018). - PubMed
    1. Fisher S. J., The placental problem: Linking abnormal cytotrophoblast differentiation to the maternal symptoms of preeclampsia. Reprod. Biol. Endocrinol. 2, 53 (2004). - PMC - PubMed
    1. Lacroix M., Kina E., Hivert M.-F., Maternal/fetal determinants of insulin resistance in women during pregnancy and in offspring over life. Curr. Diab. Rep. 13, 238–244 (2013). - PubMed

Publication types