. 2022 May 17;119(20):e2123511119.
doi: 10.1073/pnas.2123511119. Epub 2022 May 10.

α1B/D-adrenoceptors regulate chemokine receptor-mediated leukocyte migration via formation of heteromeric receptor complexes

Affiliations

α1B/D-adrenoceptors regulate chemokine receptor-mediated leukocyte migration via formation of heteromeric receptor complexes

Garrett A Enten et al. Proc Natl Acad Sci U S A. .

Abstract

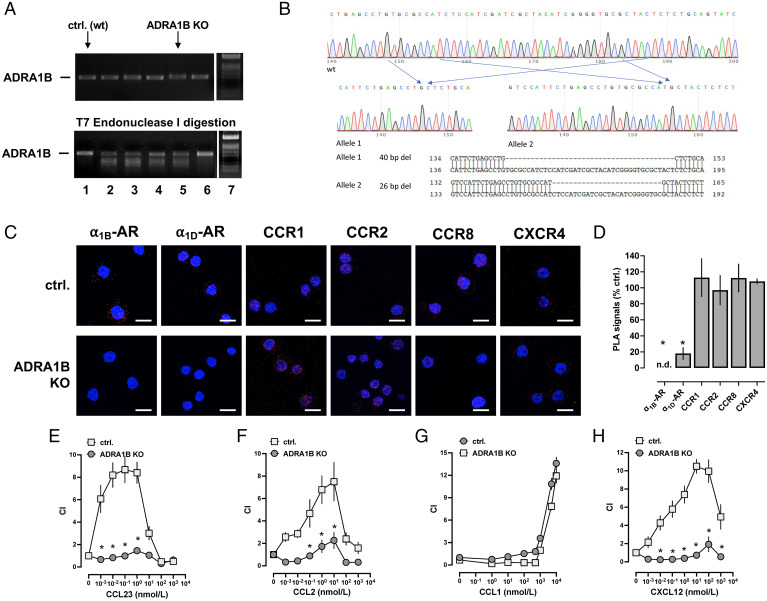
It is known that catecholamines regulate innate immune functions. The underlying mechanisms, however, are not well understood. Here we show that at least 20 members of the human chemokine receptor (CR) family heteromerize with one or more members of the α1-adrenergic receptor (AR) family in recombinant systems and that such heteromeric complexes are detectable in human monocytes and the monocytic leukemia cell line THP-1. Ligand binding to α1-ARs inhibited migration toward agonists of the CR heteromerization partners of α1B/D-ARs with high potency and 50 to 77% efficacy but did not affect migration induced by a noninteracting CR. Incomplete siRNA knockdown of α1B/D-ARs in THP-1 cells partially inhibited migration toward agonists of their CR heteromerization partners. Complete α1B-AR knockout via CRISPR-Cas9 gene editing in THP-1 cells (THP-1_ADRA1BKO) resulted in 82% reduction of α1D-AR expression and did not affect CR expression. Migration of THP-1_ADRA1BKO cells toward agonists of CR heteromerization partners of α1B/D-ARs was reduced by 82 to 95%. Our findings indicate that CR:α1B/D-AR heteromers are essential for normal function of CR heteromerization partners, provide a mechanism underlying neuroendocrine control of leukocyte trafficking, and offer opportunities to modulate leukocyte and/or cancer cell trafficking in disease processes.

Keywords: CRISPR-Cas9 gene editing; G protein–coupled receptor hetero-oligomers; chemokine receptors; chemotaxis; α1-adrenergic receptors.


Conflict of interest statement

The authors declare no competing interest.

Figures

Fig. 1.
Fig. 1.
BRET screening to identify CR heteromerization partners of α1a/b/d-ARs. HEK293T cells were transfected with α1a/b/d-AR-RLuc plus each CR-YFP in triplicate. YFP fluorescence and luminescence were read as described in Methods. Net BRET (528/460 nm) was plotted against YFP fluorescence/luminescence (YFP/Lum). Net BRET signals are mean ± SD. Cells transfected with α1a/b/d-AR-RLuc and YFP or mGlu1R-YFP at various acceptor:donor ratios served as nonspecific controls; nonspecific BRET signals were analyzed by linear regression analysis. The black line shows the regression line, and dashed lines indicate 99% prediction bands. The gray area indicates the expected distribution of nonspecific BRET signals. BRET signals above the 99% prediction band for nonspecific interactions were considered positive signals for interactions between CRs (colored symbols) and α1a/b/d-AR. Graphs represent one of three screening experiments for interactions between CRs and α1a-AR (A and B), α1b-AR (C), or α1d-AR (D and E). ctrl., control.
Fig. 2.
Fig. 2.
Saturation BRET confirms CR heteromerization partners of α1a/b/d-ARs. HEK293T cells were transfected with a fixed amount of α1a/b/d-RLuc and with increasing amounts of CR-YFP or YFP. Figures show saturation BRET signals representative of n = 3 independent experiments per receptor-receptor combination. YFP fluorescence and luminescence were read as described in Methods. Net BRET (528/460 nm) was plotted against YFP/Lum. (AE) Saturation BRET between α1a-AR and CCR1 (A), CXCR4 and YFP (B), CXCR5 (C), XCR1 (D), or ACKR4 (E). (FM). Saturation BRET between α1b-AR and CCR1 and YFP (F), CCR2 (G), CCR4 (H), CCR10 (I), CXCR4 (J), ACKR1 (K), ACKR2 (L), or CCR8 (M). (NP). Saturation BRET between α1d-AR and CCR6 and YFP (N), CXCR2 (O), or CCR9 (P).
Fig. 3.
Fig. 3.
CR:α1A/B/D-AR heteromers are detectable in THP-1 cells and in human monocytes. Representative PLA images for the detection of individual receptors (A and C) and receptor-receptor interactions (B and D) in THP-1 cells (A and B) and freshly isolated monocytes (C and D). Images show merged DAPI (nuclear counterstain) and PLA signals (red, λexcitation/emission 598/634 nm) acquired from z stack images (n = 10; thickness = 0.5 µm, Bottom to Top) and are representative of n = 3 independent experiments. As controls, cells were incubated with IgG (A and C) or with a combination of IgG and anti-CR (B and D). Scale bars, (A and B) 10 µm and (C and D) 5 µm.
Fig. 4.
Fig. 4.
Ligands of α1-ARs inhibit chemotaxis mediated via CR heteromerization partners of α1B/D-ARs. CI (mean ± SE). (A and B). THP-1 cells (A) or freshly isolated human monocytes (B) were exposed to various concentrations of phenylephrine (PE), and chemotaxis toward CCL23 (10 nM), CCL2 (10 nM), CCL1 (1 μM), or CXCL12 (100 nM) was tested. CI(%), chemotactic index in the percentage of cells not exposed to PE. n = 3–4 independent experiments. (C) THP-1 cells were exposed to various concentrations of phentolamine, and chemotaxis toward CCL23 (10 nM), CCL2 (10 nM), CCL1 (1 μM), or CXCL12 (100 nM) was tested. CI(%), chemotactic index in the percentage of cells not exposed to phentolamine. n = 3 independent experiments. (DF). THP-1 cells were exposed to various concentrations of 5-methylurapidil, L-786314, or BMY7378, and chemotaxis toward CCL23 (10 nM, D), CCL2 (10 nM, E), or CXCL12 (100 nM, F) was tested. CI(%), chemotactic index in the percentage of cells not exposed to inhibitors. n = 3 independent experiments. (GI) Chemotactic dose-responses for CCL23 (G, n = 3), CCL2 (H, n = 6), and CXCL12 (I, n = 3) in THP-1 cells exposed to 10 μM PE, 10 μM phentolamine, or vehicle. *P < 0.05 for PE vs. vehicle, #P < 0.05 for phentolamine vs. vehicle (two-way ANOVA with Dunnett’s multiple comparisons test). (J) Radioligand competition binding assays with crude membrane preparations from THP-1 cells exposed to vehicle, 10 μM PE, or 10 μM phentolamine. Specific [125I]-CCL2 binding (as a percentage): (counts per minute [cpm] − nonspecific cpm at bottom plateau) / (cpm in absence of CCL2 − nonspecific cpm) × 100. Data are mean ± SE from n = 3 independent experiments performed in duplicate.
Fig. 5.
Fig. 5.
Depletion of α1B/D-ARs by siRNA gene silencing does not affect CR expression. THP-1 cells were incubated with NT, α1B-AR, or α1D-AR siRNA, and receptor expression was measured by PLA. Images show merged DAPI/PLA signals for the detection of individual receptors, as indicated, and are representative of n = 3 independent experiments. Scale bars, 10 μm. Bottom row: Quantification of the number of PLA signals per cell for individual receptors in THP-1 cells after NT siRNA (ctrl., black bars), α1B-AR siRNA (light gray bars), or α1D-AR siRNA (dark gray bars) treatment (n = 3). Data (mean ± SE) are expressed as the percentage of cells treated with NT siRNA. *P < 0.05 vs. cells treated with NT siRNA (one-way ANOVA with Dunnett’s multiple comparisons test).
Fig. 6.
Fig. 6.
CR:α1B/D-AR heteromers after α1B/D-AR siRNA knockdown. THP-1 cells were incubated with NT, α1B-AR, or α1D-AR siRNA (same cells as in Fig. 5), and receptor-receptor interactions were measured by PLA. Images show merged DAPI/PLA signals for the detection of receptor-receptor interactions, as indicated, and are representative of n = 3 independent experiments. Scale bars, 10 μm. Bottom row: Quantification of the number of PLA signals per cell for receptor-receptor interactions in THP-1 cells after NT siRNA (ctrl., black bars), α1B-AR siRNA (light gray bars), or α1D-AR siRNA (dark gray bars) treatment (n = 3). Data (mean ± SE) are expressed as the percentage of cells treated with NT siRNA. *P < 0.05 vs. cells treated with NT siRNA (one-way ANOVA with Dunnett’s multiple comparisons test).
Fig. 7.
Fig. 7.
α1B/D-AR siRNA knockdown partially inhibits chemotaxis mediated via CR heteromerization partners of α1b/d-ARs. THP-1 cells were treated as in Figs. 5 and 6, and chemotaxis toward CCL23 (A and E), CCL2 (B and F), CCL1 (C and G), and CXCL12 (D and H) was tested. CI (mean ± SE, n = 3–4/condition). *P < 0.05 vs. cells incubated with NT siRNA (two-way ANOVA with Dunnett’s multiple comparisons test).
Fig. 8.
Fig. 8.
CR heteromerization partners of α1B/D-ARs require α1B/D-ARs to mediate chemotactic responses. (A and B) CRISPR-Cas9 gene editing to generate a THP-1 cell line that lacks α1B-AR, designated THP-1_ADRA1BKO. (A) T7 surveyor assay to confirm gene modification in the targeted region of ADRA1B. Images from agarose gel electrophoresis for the detection of PCR-amplified ADRA1B genomic DNA before (Top) and after (Bottom) T7EI digestion from a wild-type (WT) THP-1 cell clone (lane 1, ctrl. [WT]) and from puromycin-selected THP-1 cell clones that were transduced with lentivirus encoding sgRNA targeting α1B-AR and Cas9 (lanes 2 to 6). Lane 7: DNA ladder. (B) Scheme depicting the modified genomic region of ADRA1B in THP-1_ADRA1BKO cells. (C) Detection of individual receptors in a WT THP-1 clone (ctrl., Top) and in THP-1_ADRA1BKO cells (Bottom) by PLA. Images show merged DAPI/PLA signals and are representative of n = 3 independent experiments. Scale bars, 10 μm. (D) Quantification of PLA signals per cell for the detection of individual receptors in THP-1_ADRA1BKO cells. Data (mean ± SE) are expressed as the percentage of a WT THP-1 cell clone (% ctrl.). *P < 0.05 vs. ctrl. (unpaired Student’s t test). (EH) Chemotaxis of THP-1_ADRA1BKO cells and WT THP-1 cells toward CCL23 (E), CCL2 (F), CCL1 (G), and CXCL12 (H). CI (mean ± SE, n = 3–4 independent experiments). *P < 0.05 for THP-1_ADRA1BKO cells vs. WT THP-1 cells (two-way ANOVA with Dunnett’s multiple comparisons test).

Similar articles

Cited by

References

    1. Scanzano A., Cosentino M., Adrenergic regulation of innate immunity: A review. Front. Pharmacol. 6, 171 (2015). - PMC - PubMed
    1. Pongratz G., Straub R. H., The sympathetic nervous response in inflammation. Arthritis Res. Ther. 16, 504 (2014). - PMC - PubMed
    1. Tracey K. J., Reflex control of immunity. Nat. Rev. Immunol. 9, 418–428 (2009). - PMC - PubMed
    1. Dhabhar F. S., Effects of stress on immune function: The good, the bad, and the beautiful. Immunol. Res. 58, 193–210 (2014). - PubMed
    1. Barnes M. A., Carson M. J., Nair M. G., Non-traditional cytokines: How catecholamines and adipokines influence macrophages in immunity, metabolism and the central nervous system. Cytokine 72, 210–219 (2015). - PMC - PubMed

Publication types

Substances