. 2022 May 17;119(20):e2111051119.
doi: 10.1073/pnas.2111051119. Epub 2022 May 10.

Synaptotagmin-1 is a bidirectional Ca2+ sensor for neuronal endocytosis

Affiliations

Synaptotagmin-1 is a bidirectional Ca2+ sensor for neuronal endocytosis

Yang Chen et al. Proc Natl Acad Sci U S A. .

Abstract

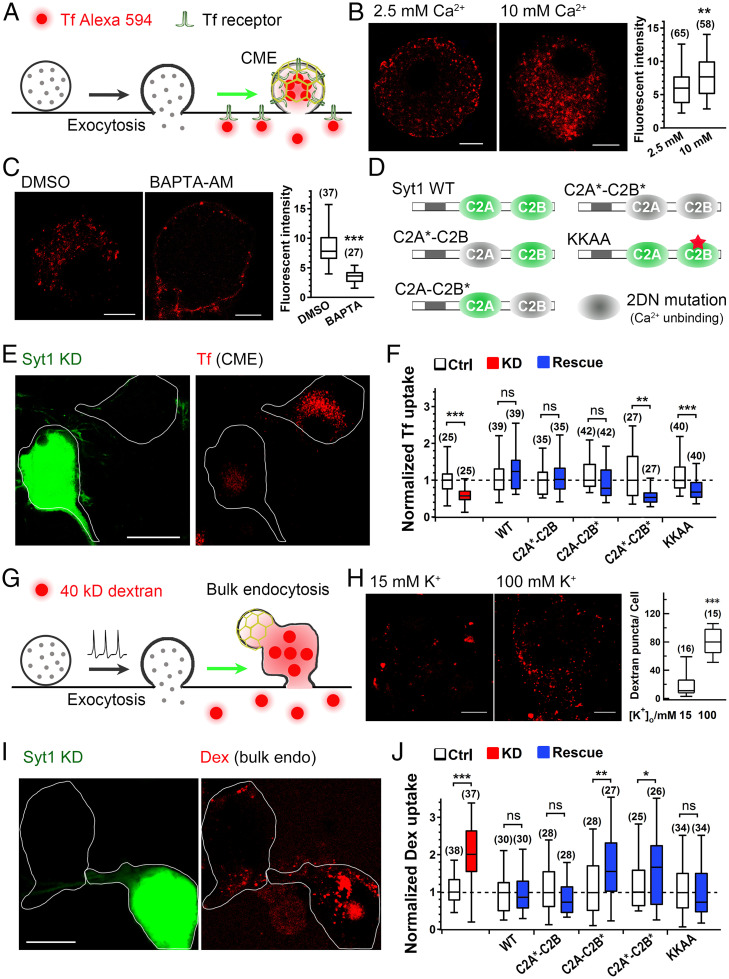
Exocytosis and endocytosis are tightly coupled. In addition to initiating exocytosis, Ca2+ plays critical roles in exocytosis–endocytosis coupling in neurons and nonneuronal cells. Both positive and negative roles of Ca2+ in endocytosis have been reported; however, Ca2+ inhibition in endocytosis remains debatable with unknown mechanisms. Here, we show that synaptotagmin-1 (Syt1), the primary Ca2+ sensor initiating exocytosis, plays bidirectional and opposite roles in exocytosis–endocytosis coupling by promoting slow, small-sized clathrin-mediated endocytosis but inhibiting fast, large-sized bulk endocytosis. Ca2+-binding ability is required for Syt1 to regulate both types of endocytic pathways, the disruption of which leads to inefficient vesicle recycling under mild stimulation and excessive membrane retrieval following intense stimulation. Ca2+-dependent membrane tubulation may explain the opposite endocytic roles of Syt1 and provides a general membrane-remodeling working model for endocytosis determination. Thus, Syt1 is a primary bidirectional Ca2+ sensor facilitating clathrin-mediated endocytosis but clamping bulk endocytosis, probably by manipulating membrane curvature to ensure both efficient and precise coupling of endocytosis to exocytosis.

Keywords: Ca2+; bulk endocytosis; clathrin-mediated endocytosis; membrane tubulation; synaptotagmin.


Conflict of interest statement

The authors declare no competing interest.

Figures

Fig. 1.
Fig. 1.
Syt1 bidirectionally regulates the fast and slow phases of endocytosis in synaptic boutons. (A) Sample images showing Syp–pH fluorescence in presynaptic boutons of scrambled shRNA control (Ctrl) or Syt1-KD hippocampal neurons 15 s before, 15 s, 30 s, 120 s, and 180 s after KCl stimulation. (Scale bars, 5 μm.) (B) Cartoon illustration and fluorescence changes (ΔF/F0) showing the real-time imaging of Syp–pH during exocytosis and endocytosis as in A. (CE) Normalized fluorescence changes (mean ± SEM) of Syp–pH in control (C; n = 178), Syt1-KD (D; n = 180), and rescue (E; n = 236) hippocampal synapses in response to 70 mM KCl stimulation (30 s). (F) The overlaid fluorescence endocytic decay as in CE. The traces were fitted to a double-exponential function (solid traces). (G and H) Fast (G) and slow (H) time constants of endocytosis recorded as in CE. (I and J) Representative fluorescence trace (I) and statistics (J) of endocytic overshoot in hippocampal neurons. Error bars indicate SEM. In the box plots, the central line of each box represents the median, the edges of the box represent the 25th and 75th percentiles, and the whiskers extend to the 5th and 95th data points. Data were collected from six independent experiments. A one-way ANOVA (G and H) or Fisher’s exact test (J) was performed; ***P < 0.001.
Fig. 2.
Fig. 2.
Syt1 bidirectionally regulates small- and large-sized endocytosis in synaptic boutons. (A and B) Cartoon illustration and sample images showing the confocal and STED imaging of Syp–pH and endocytosed dextran (10 kDa) in hippocampal synaptic boutons following KCl stimulation. Endocytic vesicles were identified as dextran-positive (red) Syp–pH rings (green) as indicated in B (Bottom). (Scale bars, 20 μm [A], 1 μm [B, Top], and 200 nm [B, Bottom]). (CF) Representative micrographs and histogram showing the size of endocytic vesicles (dextran-positive) in scrambled control, Syt1-KD, and rescue boutons following 70 mM KCl stimulation (2 min). (Scale bar, 100 nm.) The dashed and solid traces in DF are the individual and overall fits to single or multiple (KD with KCl stimulation) Gaussian functions. A single peak at ∼50 nm in D and F and multiple peaks at ∼50 and ∼105 nm in E are shown. (G and H) Statistics of small (G; Φ ≤ 65 nm) and large (H; Φ > 65 nm) endocytic vesicles in scrambled control, Syt1-KD, and rescue boutons following 70 mM KCl stimulation as in CF. Data were collected from four independent experiments and were analyzed by one-way ANOVA; ***P < 0.001.
Fig. 3.
Fig. 3.
Syt1 promotes slow-phase small-sized endocytosis but inhibits fast-phase large-sized endocytosis in synaptic boutons. (A) Cartoon illustration of viral infection for the Cre-dependent knockout of Syt1 and specific expression of Syp–pH in Syt1f/f hippocampal neurons. (B and C) Normalized fluorescence changes (mean ± SEM) of Syp–pH in control (B) and Syt1-cKO (C) synapses in response to 45 mM KCl stimulation. The traces were fitted to an exponential function (solid traces). (D) The time constant of endocytosis recorded as in B and C. (E and F) Normalized fluorescence changes (mean ± SEM) of Syp–pH in control (E) and Syt1-cKO (F) synapses in response to 70 mM KCl stimulation. The traces were fitted to a double-exponential function (solid traces). (G and H) Fast (G) and slow (H) time constants of endocytosis recorded as in E and F. (I) Representative micrographs showing the STED imaging of Syp–pH and endocytosed dextran (10 kDa) in Syt1-cKO hippocampal synaptic boutons following 70 mM KCl stimulation (2 min). (Scale bar, 1 µm.) (J and K) Histograms showing the diameter distribution of endocytic vesicles (dextran-positive) in control (J) and Syt1-cKO (K) boutons as in I. The dashed and solid traces are the individual and overall fits to single (control) or multiple (cKO) Gaussian functions. (L and M) Statistics of small (L; Φ ≤ 65 nm) and large (M; Φ > 65 nm) endocytic vesicles in control and Syt1-cKO boutons following 70 mM KCl stimulation as in IK. (N) Representative electron micrographs of HRP uptake following 2-min 100 mM K+ stimulation. (Scale bar, 500 nm.) (O and P) Statistics of small endocytic vesicles (Φ ≤ 65 nm, arrows) and large endosomes (Φ > 65 nm, arrowheads) in control and Syt1-cKO boutons as in N. In the box plots, the central line of each box represents the median, the edges of the box represent the 25th and 75th percentiles, and the whiskers extend to the most extreme data points. Data were collected from four to five independent experiments and were analyzed by Mann–Whitney U test; **P < 0.01, ***P < 0.001.
Fig. 4.
Fig. 4.
Syt1 is a Ca2+ sensor facilitating CME but inhibiting bulk endocytosis in neuronal somata. (A) Cartoon illustration of Tf uptake through CME. (B) Tf uptake in DRG neurons in 2.5 or 10 mM [Ca2+]o. Right, quantification of Tf fluorescence density. (C) As in B, but with 0.1% dimethyl sulfoxide (DMSO; control) or BAPTA-AM (with DMSO) in the 2.5 mM Ca2+ solution. (D) Diagram of the mutant forms of Syt1 used for rescue experiments (wild-type, 2DN [*] mutants in C2A and/or C2B, or KKAA mutant). (E and F) Representative images (E) and quantification (F) of Tf uptake in control and Syt1-KD DRG neurons with or without rescue by the indicated forms of Syt1. (G) Cartoon illustration of large dextran (40 kDa) uptake through bulk endocytosis. (H) Representative z-projected fluorescence images (Left) showing 40-kDa dextran uptake in DRG neurons stimulated with 15 or 100 mM K+. Quantification is shown on the Right. (I and J) Representative z-projected fluorescence images (I) and statistics (J) of large dextran (Dex) uptake by control and Syt1-KD DRG neurons with or without rescue by the indicated forms of Syt1. (Scale bars, 5 µm [B and C], 10 µm [H], and 20 µm [E and I]). In the box plots, the central line of each box represents the median, the edges of the box represent the 25th and 75th percentiles, and the whiskers extend to the most extreme data points. Data were collected from three to five independent experiments and were analyzed by Mann–Whitney U test; *P < 0.05, **P < 0.01, ***P < 0.001; ns, not significant.
Fig. 5.
Fig. 5.
Syt1 is a Ca2+ sensor facilitating CME but inhibiting bulk endocytosis in synaptic boutons. (A) Cartoon illustration of STED imaging of Syp–pH and endocytosed dextran (10 kDa) in Syt1-KD hippocampal synaptic boutons with the rescue of indicated Syt1 mutants. (BF) Histograms showing the diameter distribution of endocytic vesicles (dextran-positive) in Syt1-KD boutons with the rescue of indicated Syt1 mutants following 70 mM KCl stimulation (2 min). The dashed and solid traces are the individual and overall fits to single or multiple (C2A–C2B*, C2A*–C2B*, KKAA) Gaussian functions. (GL) Statistics of small (Φ ≤ 65 nm) and large (Φ > 65 nm) endocytic vesicles in Syt1-KD and rescue boutons as in BF. Data were collected from four independent experiments and analyzed by one-way ANOVA; **P < 0.01, ***P < 0.001.
Fig. 6.
Fig. 6.
Syt1 Ca2+-dependently mediates membrane invagination. (A) Electron micrographs of liposomes incubated with the indicated Syt fragments in the presence or absence of Ca2+. Two types of tubules were observed, long thinner tubules (Φ∼26 nm) and short thicker tubules (Φ∼56 nm, double arrows). (Scale bars, 400 nm.) (BD) Quantification of tubulated liposomes (B), thick tubule–containing liposomes (C), and length of thick tubules (D) obtained under the indicated conditions. (E) Working model showing bidirectional roles of Syt1 as a Ca2+ sensor to regulate neural endocytosis. Syt1 functions as a primary Ca2+ sensor facilitating CME to ensure highly efficient vesicle recycling but inhibiting bulk endocytosis probably through membrane manipulation to achieve both efficient and precise exocytosis–endocytosis coupling during neurotransmission; AP, action potential; TMD, transmembrane domain. In the box plots, the central line of each box represents the median, the edges of the box represent the 25th and 75th percentiles, and the whiskers extend to 5% and 95% the most extreme data points. Data were collected from three independent experiments and were analyzed by Pearson’s χ2 analysis for B and C and one-way ANOVA for D; *P < 0.05, **P < 0.01, ***P < 0.001.

Similar articles

Cited by

References

    1. Saheki Y., De Camilli P., Synaptic vesicle endocytosis. Cold Spring Harb. Perspect. Biol. 4, a005645 (2012). - PMC - PubMed
    1. Wu L. G., Hamid E., Shin W., Chiang H. C., Exocytosis and endocytosis: Modes, functions, and coupling mechanisms. Annu. Rev. Physiol. 76, 301–331 (2014). - PMC - PubMed
    1. Xie Z., et al. , Molecular mechanisms for the coupling of endocytosis to exocytosis in neurons. Front. Mol. Neurosci. 10, 47 (2017). - PMC - PubMed
    1. Leitz J., Kavalali E. T., Ca2+ dependence of synaptic vesicle endocytosis. Neuroscientist 22, 464–476 (2016). - PubMed
    1. Südhof T. C., Calcium control of neurotransmitter release. Cold Spring Harb. Perspect. Biol. 4, a011353 (2012). - PMC - PubMed

Publication types

LinkOut - more resources