

A Framework for Modeling and Interpreting Patient Subgroups Applied to Hospital Readmission: Visual Analytical Approach
- PMID: 35537203
- PMCID: PMC9773032
- DOI: 10.2196/37239
A Framework for Modeling and Interpreting Patient Subgroups Applied to Hospital Readmission: Visual Analytical Approach
Abstract
Background: A primary goal of precision medicine is to identify patient subgroups and infer their underlying disease processes with the aim of designing targeted interventions. Although several studies have identified patient subgroups, there is a considerable gap between the identification of patient subgroups and their modeling and interpretation for clinical applications.
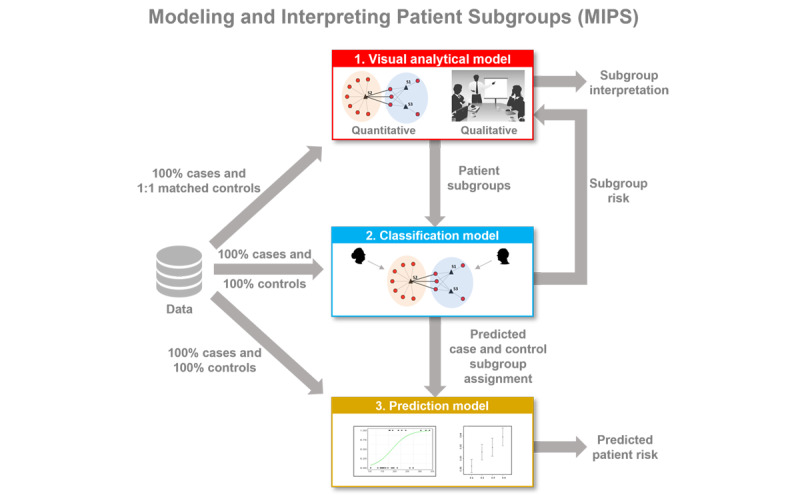
Objective: This study aimed to develop and evaluate a novel analytical framework for modeling and interpreting patient subgroups (MIPS) using a 3-step modeling approach: visual analytical modeling to automatically identify patient subgroups and their co-occurring comorbidities and determine their statistical significance and clinical interpretability; classification modeling to classify patients into subgroups and measure its accuracy; and prediction modeling to predict a patient's risk of an adverse outcome and compare its accuracy with and without patient subgroup information.
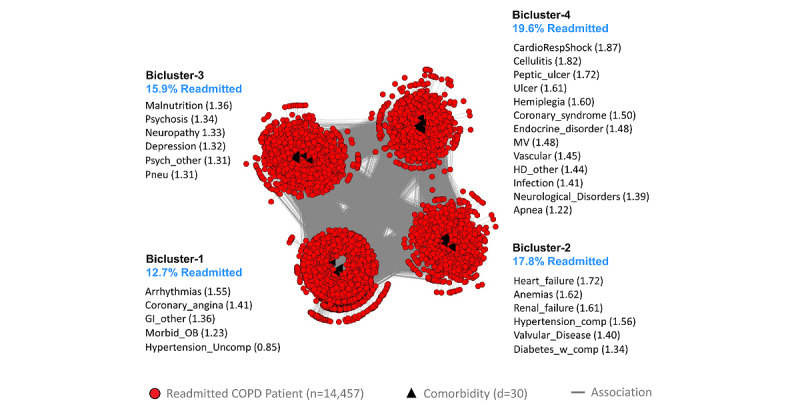
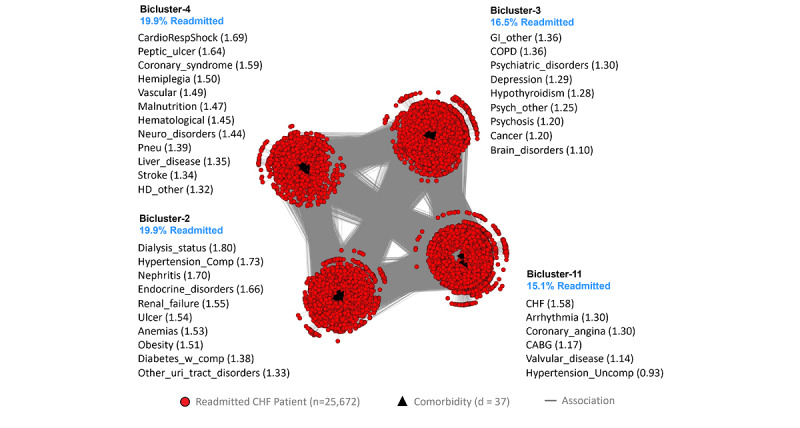
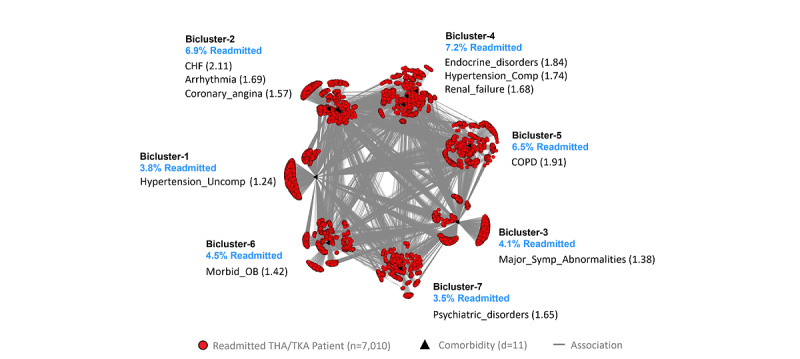
Methods: The MIPS framework was developed using bipartite networks to identify patient subgroups based on frequently co-occurring high-risk comorbidities, multinomial logistic regression to classify patients into subgroups, and hierarchical logistic regression to predict the risk of an adverse outcome using subgroup membership compared with standard logistic regression without subgroup membership. The MIPS framework was evaluated for 3 hospital readmission conditions: chronic obstructive pulmonary disease (COPD), congestive heart failure (CHF), and total hip arthroplasty/total knee arthroplasty (THA/TKA) (COPD: n=29,016; CHF: n=51,550; THA/TKA: n=16,498). For each condition, we extracted cases defined as patients readmitted within 30 days of hospital discharge. Controls were defined as patients not readmitted within 90 days of discharge, matched by age, sex, race, and Medicaid eligibility.
Results: In each condition, the visual analytical model identified patient subgroups that were statistically significant (Q=0.17, 0.17, 0.31; P<.001, <.001, <.05), significantly replicated (Rand Index=0.92, 0.94, 0.89; P<.001, <.001, <.01), and clinically meaningful to clinicians. In each condition, the classification model had high accuracy in classifying patients into subgroups (mean accuracy=99.6%, 99.34%, 99.86%). In 2 conditions (COPD and THA/TKA), the hierarchical prediction model had a small but statistically significant improvement in discriminating between readmitted and not readmitted patients as measured by net reclassification improvement (0.059, 0.11) but not as measured by the C-statistic or integrated discrimination improvement.
Conclusions: Although the visual analytical models identified statistically and clinically significant patient subgroups, the results pinpoint the need to analyze subgroups at different levels of granularity for improving the interpretability of intra- and intercluster associations. The high accuracy of the classification models reflects the strong separation of patient subgroups, despite the size and density of the data sets. Finally, the small improvement in predictive accuracy suggests that comorbidities alone were not strong predictors of hospital readmission, and the need for more sophisticated subgroup modeling methods. Such advances could improve the interpretability and predictive accuracy of patient subgroup models for reducing the risk of hospital readmission, and beyond.
Keywords: Bipartite Network analysis; Medicare; hospital readmission; modeling; precision medicine; visual analytics.
©Suresh K Bhavnani, Weibin Zhang, Shyam Visweswaran, Mukaila Raji, Yong-Fang Kuo. Originally published in JMIR Medical Informatics (https://medinform.jmir.org), 07.12.2022.
Conflict of interest statement
Conflicts of Interest: None declared.
Figures


Similar articles
-
Using Visual Analytic Methods to Identify Patient Groups [Internet].Washington (DC): Patient-Centered Outcomes Research Institute (PCORI); 2021 Jun. Washington (DC): Patient-Centered Outcomes Research Institute (PCORI); 2021 Jun. PMID: 38781405 Free Books & Documents. Review.
-
How High-Risk Comorbidities Co-Occur in Readmitted Patients With Hip Fracture: Big Data Visual Analytical Approach.JMIR Med Inform. 2020 Oct 26;8(10):e13567. doi: 10.2196/13567. JMIR Med Inform. 2020. PMID: 33103657 Free PMC article.
-
Inaugural Readmission Penalties for Total Hip and Total Knee Arthroplasty Procedures Under the Hospital Readmissions Reduction Program.JAMA Netw Open. 2019 Nov 1;2(11):e1916008. doi: 10.1001/jamanetworkopen.2019.16008. JAMA Netw Open. 2019. PMID: 31755949 Free PMC article.
-
Enabling Comprehension of Patient Subgroups and Characteristics in Large Bipartite Networks: Implications for Precision Medicine.AMIA Jt Summits Transl Sci Proc. 2017 Jul 26;2017:21-29. eCollection 2017. AMIA Jt Summits Transl Sci Proc. 2017. PMID: 28815099 Free PMC article.
-
Factors associated with hospital stay length, discharge destination, and 30-day readmission rate after primary hip or knee arthroplasty: Retrospective Cohort Study.Orthop Traumatol Surg Res. 2019 Sep;105(5):949-955. doi: 10.1016/j.otsr.2019.04.012. Epub 2019 Jun 15. Orthop Traumatol Surg Res. 2019. PMID: 31208932 Review.
Cited by
-
The Role of Machine Learning in Predicting Hospital Readmissions Among General Internal Medicine Patients: A Systematic Review.Cureus. 2025 May 24;17(5):e84761. doi: 10.7759/cureus.84761. eCollection 2025 May. Cureus. 2025. PMID: 40557003 Free PMC article. Review.
-
Subtyping Social Determinants of Health in All of Us: Network Analysis and Visualization Approach.medRxiv [Preprint]. 2023 Aug 11:2023.01.27.23285125. doi: 10.1101/2023.01.27.23285125. medRxiv. 2023. Update in: J Med Internet Res. 2025 Feb 11;27:e48775. doi: 10.2196/48775. PMID: 37636340 Free PMC article. Updated. Preprint.
-
Leveraging Digital Twins for Stratification of Patients with Breast Cancer and Treatment Optimization in Geriatric Oncology: Multivariate Clustering Analysis.JMIR Cancer. 2025 May 23;11:e64000. doi: 10.2196/64000. JMIR Cancer. 2025. PMID: 40408774 Free PMC article.
-
Subtyping Social Determinants of Health in the "All of Us" Program: Network Analysis and Visualization Study.J Med Internet Res. 2025 Feb 11;27:e48775. doi: 10.2196/48775. J Med Internet Res. 2025. PMID: 39932771 Free PMC article.
References
-
- McClellan J, King MC. Genetic heterogeneity in human disease. Cell. 2010 Apr 16;141(2):210–7. doi: 10.1016/j.cell.2010.03.032. https://linkinghub.elsevier.com/retrieve/pii/S0092-8674(10)00320-X S0092-8674(10)00320-X - DOI - PubMed
-
- Rouzier R, Perou CM, Symmans WF, Ibrahim N, Cristofanilli M, Anderson K, Hess KR, Stec J, Ayers M, Wagner P, Morandi P, Fan C, Rabiul I, Ross JS, Hortobagyi GN, Pusztai L. Breast cancer molecular subtypes respond differently to preoperative chemotherapy. Clin Cancer Res. 2005 Aug 15;11(16):5678–85. doi: 10.1158/1078-0432.CCR-04-2421.11/16/5678 - DOI - PubMed
-
- Sørlie T, Perou CM, Tibshirani R, Aas T, Geisler S, Johnsen H, Hastie T, Eisen MB, van de Rijn M, Jeffrey SS, Thorsen T, Quist H, Matese JC, Brown PO, Botstein D, Lønning PE, Børresen-Dale AL. Gene expression patterns of breast carcinomas distinguish tumor subclasses with clinical implications. Proc Natl Acad Sci U S A. 2001 Sep 11;98(19):10869–74. doi: 10.1073/pnas.191367098. http://europepmc.org/abstract/MED/11553815 98/19/10869 - DOI - PMC - PubMed
-
- Fitzpatrick AM, Teague WG, Meyers DA, Peters SP, Li X, Li H, Wenzel SE, Aujla S, Castro M, Bacharier LB, Gaston BM, Bleecker ER, Moore WC, National Institutes of Health/National Heart, Lung, and Blood Institute Severe Asthma Research Program Heterogeneity of severe asthma in childhood: confirmation by cluster analysis of children in the National Institutes of Health/National Heart, Lung, and Blood Institute Severe Asthma Research Program. J Allergy Clin Immunol. 2011 Feb;127(2):382–9.e1. doi: 10.1016/j.jaci.2010.11.015.S0091-6749(10)01765-3 - DOI - PMC - PubMed
LinkOut - more resources
Full Text Sources
Miscellaneous
