. 2022 May 9;40(5):509-523.e6.
doi: 10.1016/j.ccell.2022.04.004. Epub 2022 May 9.

Interleukin-6 blockade abrogates immunotherapy toxicity and promotes tumor immunity

Affiliations

Interleukin-6 blockade abrogates immunotherapy toxicity and promotes tumor immunity

Yared Hailemichael et al. Cancer Cell. .

Abstract

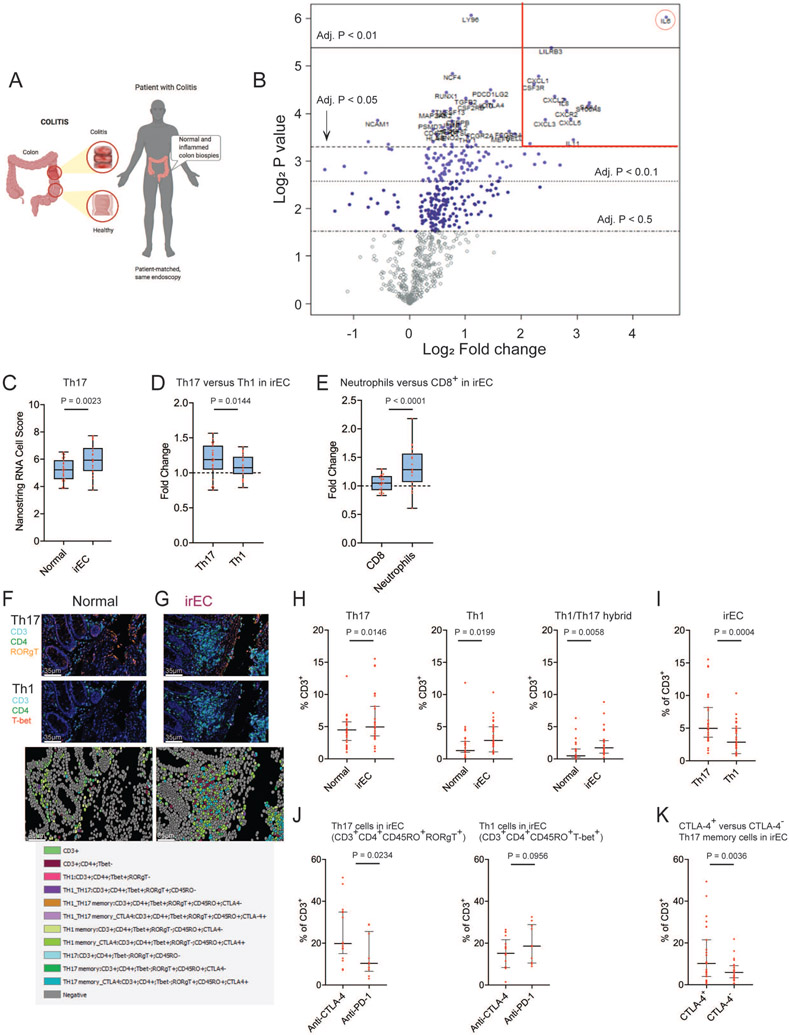
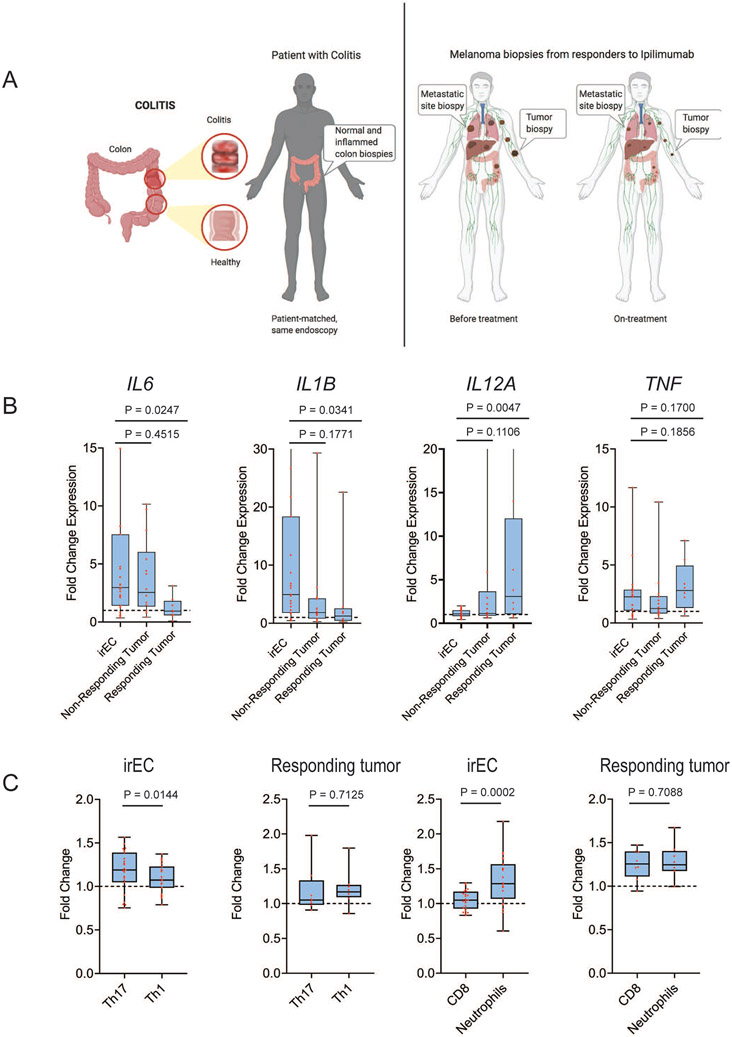
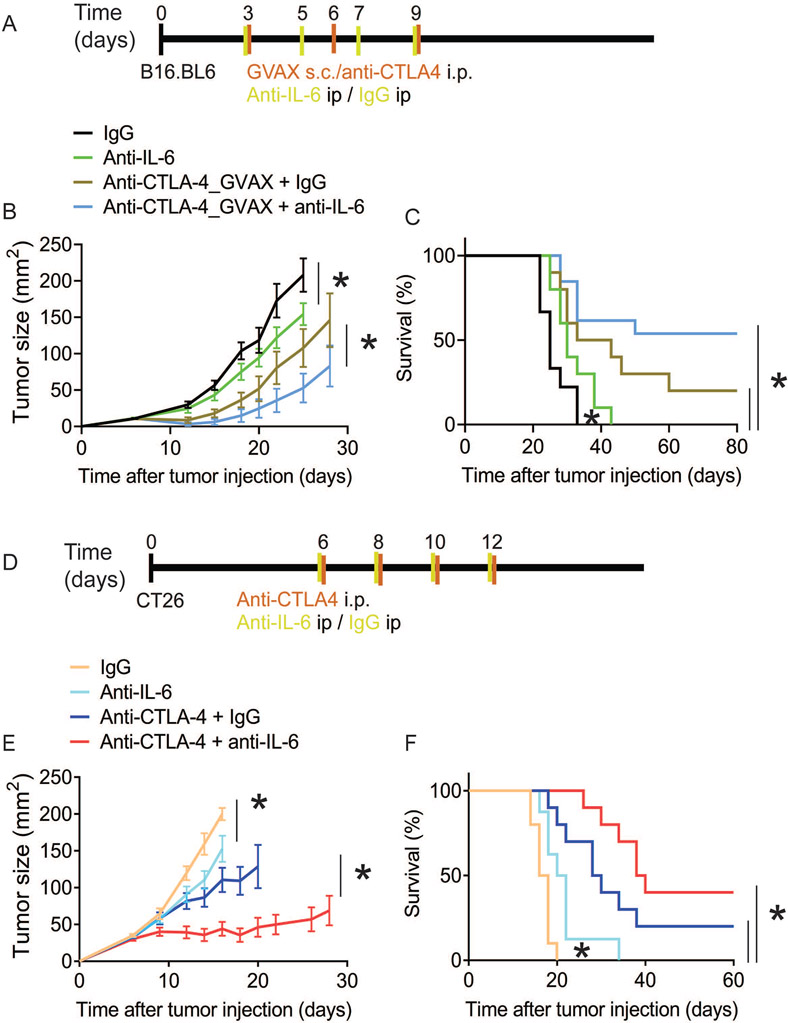
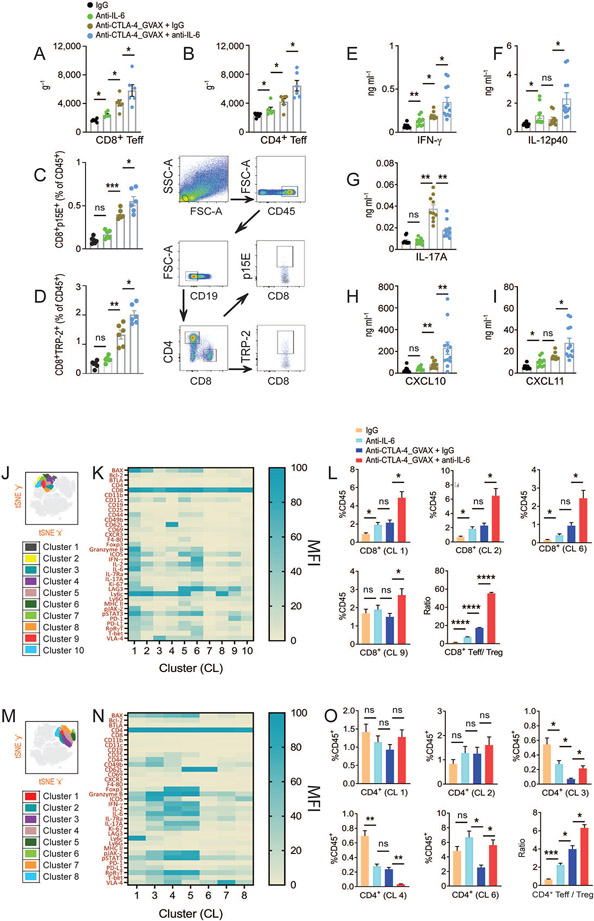
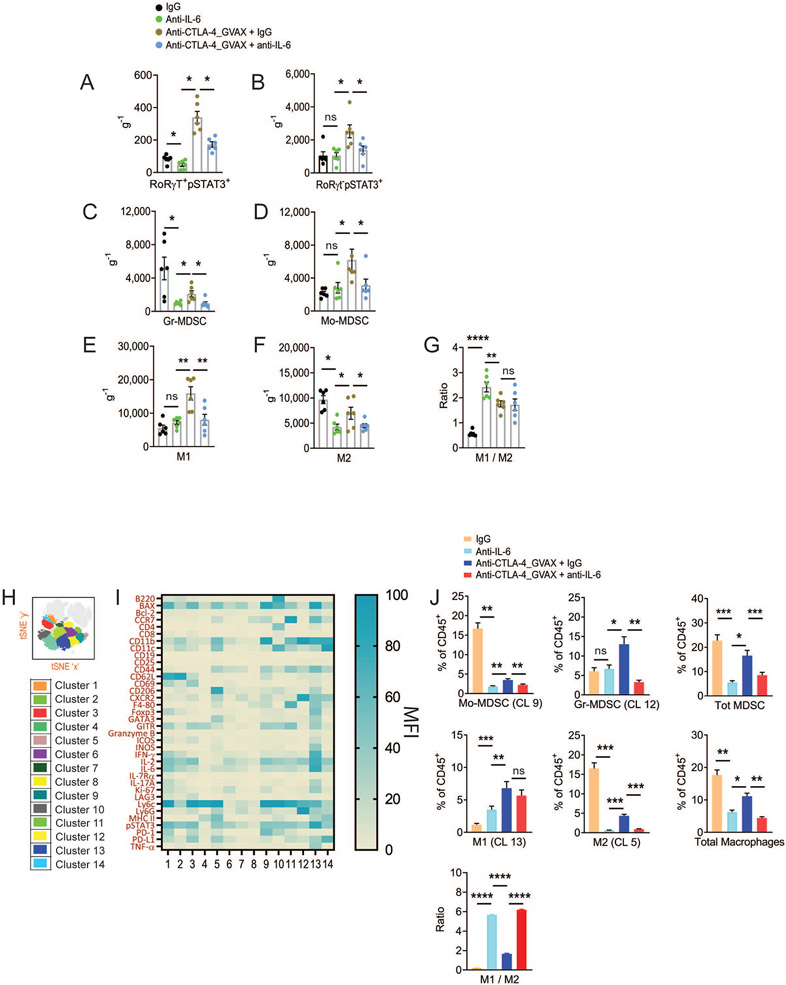
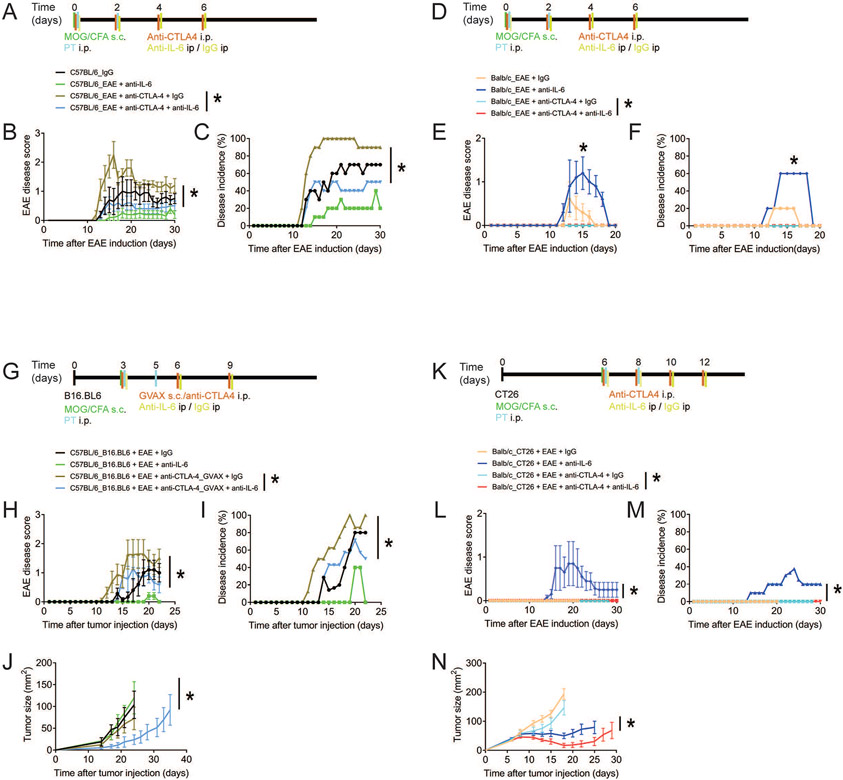
Immune checkpoint blockade (ICB) therapy frequently induces immune-related adverse events. To elucidate the underlying immunobiology, we performed a deep immune analysis of intestinal, colitis, and tumor tissue from ICB-treated patients with parallel studies in preclinical models. Expression of interleukin-6 (IL-6), neutrophil, and chemotactic markers was higher in colitis than in normal intestinal tissue; T helper 17 (Th17) cells were more prevalent in immune-related enterocolitis (irEC) than T helper 1 (Th1). Anti-cytotoxic T-lymphocyte-associated antigen 4 (anti-CTLA-4) induced stronger Th17 memory in colitis than anti-program death 1 (anti-PD-1). In murine models, IL-6 blockade associated with improved tumor control and a higher density of CD4+/CD8+ effector T cells, with reduced Th17, macrophages, and myeloid cells. In an experimental autoimmune encephalomyelitis (EAE) model with tumors, combined IL-6 blockade and ICB enhanced tumor rejection while simultaneously mitigating EAE symptoms versus ICB alone. IL-6 blockade with ICB could de-couple autoimmunity from antitumor immunity.

Trial registration: ClinicalTrials.gov NCT04940299.

Keywords: EAE; TC1/TC17; Th1/Th17; Th17 memory; arthritis; colitis; immune checkpoint blockade; immunity; interleukin-6; melanoma; toxicity.


Conflict of interest statement

Declaration of interests A.D. received Institution Research funds: Bristol Myers and Squibb, Merck, Pfizer, Nektar Therapeutics, Idera Pharmaceuticals, Apexigen and advisory board fees: Bristol Myers and Squibb, Nektar Therapeutics, Idera Pharmaceuticals, Iovance Therapeutics, Apexigen. M.A.D. has been a consultant to Roche/Genentech, Array, Pfizer, Novartis, BMS, GSK, Sanofi-Aventis, Vaccinex, Apexigen, Eisai, Iovance, and ABM Therapeutics, and he has been the PI of research grants to MD Anderson by Roche/Genentech, GSK, Sanofi-Aventis, Merck, Myriad, Oncothyreon, and ABM Therapeutics.

Figures

Figure 1.
Figure 1.. Interleukin 6 mediated inflammation was observed in immune checkpoint blockade induced immune-related enterocolitis (irEC) samples from patients with cancer.
(A) Schematic diagram for sample collection for gene expression profiling and multiplex IHC analyses. (B) Volcano plot of irEC compared with normal intestinal tissue. Significantly upregulated genes with log2 fold change >2 are shown inside the red lines. IL-6 log2 fold change (red circle). (C-E) Box plots visualize estimate of abundance of immune cell subset populations using expression of characteristic genes. (C) Th17 cells within irEC compared with normal colon tissue (D) Th17 cells compared with Th1 cells in irEC. (E) Neutrophils compared with CD8+ cells in irEC. Data are presented as median and whiskers on the box plots extend minimum to maximum points (n=23, unpaired t test). The top and bottom lines of the box plots represent the interquartile range (IQR), the mid line represents the median, and the whiskers on the box plots represent minimum and maximum values. (F,G) Example of multiplex IHC with cell type annotation and visualizations. (F) normal intestinal tissue (G) irEC tissue samples. (H) Percentage of total T cells from multiplex IHC in normal intestinal tissue compared with irEC tissue samples. (I) Percentage of Th17 cells compared with Th1 cells in irEC. (J) Percentage of Th17 or Th1 memory cells in irEC induced by anti-CTLA-4 compared with anti-PD-1 monotherapy. (K) CTLA-4 expression among Th17 memory cells in irEC. Data are presented as median and IQR (n=27, unpaired t test). See also Figure S1, Table S1 and S2.
Figure 2.
Figure 2.. Interleukin 6 inflammatory signature is higher in immune-related enterocolitis than in tumors responding to immune checkpoint blockade therapy.
(A) Schematic diagram for gene expression profiling: left, irEC samples and right, melanoma baseline and on-treatment tumor samples from patients treated with ICB. For melanoma, samples from a different cohort of melanoma patients treated with ipilimumab-based therapy were used. (B) Comparison of fold change of Th17- and Th1-differentiating cytokines and tumor necrosis factor alpha (TNF-A) in all patients from the irEC analysis and tumor response analysis. (C) Comparison of mean fold change of immune cell subset population in irEC or responding tumor. Data are presented as interquartile range and median and whiskers on the box plots extend minimum to maximum points (n=26, unpaired t test). See also Table S2.
Figure 3.
Figure 3.. Interleukin (IL)-6 blockade increases anti-CTLA-4 therapeutic efficacy.
(A-C) C57BL/6 mice were injected s.c.with B16.BL6 melanoma cells on day 0 and treated with GVAX and anti-CTLA-4 on days 3, 6, and 9, or anti-IL-6 or IgG on days 3, 5, 7, and 9. (A) Treatment scheme for B16.BL6 anti-CTLA-4 therapy in C57BL/6 mice. (B) Tumor size represented as average ± SEM, (n = 10, *P < 0.05, Multiple t test). (C) Kaplan-Meier survival curves (n=10, *P < 0.05, Log-rank test). (D-F) Balb/c mice were injected with CT26 colon carcinoma cells on day 0 and treated with anti-CTLA-4 , anti-IL-6, or IgG on days 6, 8, 10, and 12. (D) Treatment scheme for CT26 anti-CTLA-4 therapy in Balb/c mice. (E) Tumor size represented as average ± SEM (n = 10, *P < 0.05, Multiple t test). (F) Kaplan-Meier survival curves (n=10, *P < 0.05, Log-rank test). See also Figure S2.
Figure 4.
Figure 4.. Interleukin 6 blockade increases anti-CTLA-4 therapy–induced effector T cell localization.
(A-I) Mice were treated as in Fig. 3A and tumors were harvested on day 14 (A) Total number of polyclonal CD8+ Teff (B) Total number of polyclonal CD4+ Teff in B16.BL6 tumor were quantitated by flow cytometry and normalized to weight of the tumor ( g−1). (C,D) The number of (C) p15E-specific CD8+ T cells (D) TRP-2-specific CD8+ T cells detected by pentamer staining. Gating strategy for flow cytometry analysis shown to the right. (E-I) Cytokine and chemokine concentrations in supernatant from tumor site homogenates were analyzed by luminex multiplex assay 14 days after tumor injection. (E) IFN-γ (F) IL-12p40 (G) IL-17A (H) CXCL10 (I) CXCL11. (J-L) Profiling of CT26 tumor-infiltrating CD8+ Teffs by mass cytometry at day 14 in mice treated as in Fig. 3D. (J) t-SNE plots showing CD8+ T cell clusters. (K) Heatmap displaying the mean fluorescence intensity (MFI) of immune markers expressed on CD8+ T cell cluster, color coded with beryl green for lower expression and blue green for higher expression. (L) Bar graphs showing the relative frequency of representative CD8+ T cell cluster groups as a percentage of CD45+ leukocytes. (M-O) Profiling of CT26 tumor-infiltrating CD4+ Teffs (M) t-SNE plots showing CD4+ T cell clusters. (N) Heatmap displaying MFI of immune markers expressed on CD4+ T cell cluster, color coded with beryl green for lower expression and blue green for higher expression. (O) Bar graphs showing the relative frequency of representative of CD4+ T cell cluster groups as a percentage of CD45+ leukocytes. Data are represented as average ± SEM (n = 5, *P < 0.05, **P < 0.01, ***P < 0.001, ****P < 0.0001, One-way ANOVA). See also Figures. S3 and S4.
Figure 5.
Figure 5.. Interleukin 6 blockade decreases macrophages and myeloid-derived suppressor cells (MDSCs) in tumor tissue.
(A-G) Mice were treated as in Fig. 4A. Tumors were harvested on day 14. Total number of (A) CD4+ RORγT+pSTAT3+ T cells, (B) CD4+RORγTpSTAT3+ T cells, (C) Granulocytic-MDSCs, (D) Monocytic-MDSCs, (E) M1-like macrophages, (F) M2-like macrophages, and (G) M1 / M2 ratio in B16.BL6 tumor tissue quantitated by flow cytometry and normalized to weight of the tumor ( g−1). (H-I) Mice were treated as in Fig. 4J. (H) t-SNE plots showing clusters with the expression of the CD11b lineage marker. (I) Heatmap displaying MFI of immune markers expressed on CD1b+ myeloid cell cluster in CT26 tumor, color coded with beryl green for lower expression and blue green for higher expression. (J) Bar graphs showing the relative frequency of representative cluster groups as a percentage of CD45+ leukocytes are shown on the right. Data are represented as average ± SEM (n = 5, *P < 0.05, **P < 0.01, ***P < 0.001, ****P < 0.0001, One-way ANOVA). See also Figure S5.
Figure 6.
Figure 6.. Interleukin 6 blockade improves anti-CTLA-4 therapeutic activity while not exacerbating autoimmunity.
Autoimmune encephalomyelitis (EAE) was induced in C57BL/6 mice (A-C) and Balb/c mice (D-F) by subcutaneous immunization with myelin-oligodendrocyte glycoprotein (MOG)35–55 peptide in complete Freund adjuvant (CFA) containing Mycobacterium tuberculosis and intraperitoneal administration of pertussis toxin (PT) on the day of immunization and 2 days later. (A) Treatment scheme for anti-CTLA-4 and anti-IL-6 therapy in C57BL/6 mice. (B) EAE disease score average ± SEM, n = 10, *P < 0.05, multiple t test). (C) EAE at the highest peak of disease incidence (*X2 = 12.2, degrees of freedom = 3, P < 0.01). (D) Treatment scheme for anti-CTLA-4 and anti-IL-6 therapy in Balb/c mice. (E) EAE disease score (average ± SEM, n = 10, *P < 0.05, Multiple t test). (F) EAE at the highest peak of disease incidence (*X2 = 15, degrees of freedom = 3, P < 0.01). (G-J) EAE was induced as described in Figure 6A in C57BL/6 mice 3 days after mice were injected with B16.BL6 cells and treated with GVAX and anti-CTLA-4 on days 3, 6, and 9 or anti-IL-6 or IgG on days 3, 5, 7, and 9. (G) Treatment scheme for B16.BL/6 and EAE anti-CTLA-4 therapy. (H) EAE disease score average ± SEM, (n = 10, *P < 0.05 Multiple t test). (I) EAE at the highest peak of disease incidence (*X2 = 8.73, degrees of freedom = 3, P < 0.05). (J) Tumor size average ± SEM (n = 10, *P < 0.05 determined by Multiple t test). (K-N) EAE was induced as described in Figure 6D in Balb/c mice 6 days after mice were injected with CT26 cells and treated with anti-CTLA-4, anti-IL-6, or IgG on days 6, 8, 10, and 12. (K) Treatment scheme for CT26 and EAE anti-CTLA-4 therapy. (L) EAE disease score (average ± SEM, n = 10, *P < 0.05 Multiple t test). (M) EAE at the highest peak of disease incidence (X2 = 12.9, degrees of freedom = 3, *P < 0.05). (N) Tumor size average ± SEM, (n = 10, *P < 0.05, Multiple t test). See also Figures. S6, S7 and S8.

Comment in

Similar articles

Cited by

References

    1. Abromson-Leeman S, Bronson RT, and Dorf ME (2009). Encephalitogenic T cells that stably express both T-bet and ROR gamma t consistently produce IFNgamma but have a spectrum of IL-17 profiles. Journal of neuroimmunology 215, 10–24. - PMC - PubMed
    1. Abu-Sbeih H, Ali FS, Naqash AR, Owen DH, Patel S, Otterson GA, Kendra K, Ricciuti B, Chiari R, De Giglio A, et al. (2019). Resumption of Immune Checkpoint Inhibitor Therapy After Immune-Mediated Colitis. Journal of clinical oncology : official journal of the American Society of Clinical Oncology 37, 2738–2745. - PMC - PubMed
    1. Anderson R, and Rapoport BL (2018). Immune Dysregulation in Cancer Patients Undergoing Immune Checkpoint Inhibitor Treatment and Potential Predictive Strategies for Future Clinical Practice. Frontiers in oncology 8, 80. - PMC - PubMed
    1. Arra A, Lingel H, Kuropka B, Pick J, Schnoeder T, Fischer T, Freund C, Pierau M, and Brunner-Weinzierl MC (2017). The differentiation and plasticity of Tc17 cells are regulated by CTLA-4-mediated effects on STATs. Oncoimmunology 6, e1273300. - PMC - PubMed
    1. Bamias G, Delladetsima I, Perdiki M, Siakavellas SI, Goukos D, Papatheodoridis GV, Daikos GL, and Gogas H (2017). Immunological Characteristics of Colitis Associated with Anti-CTLA-4 Antibody Therapy. Cancer investigation 35, 443–455. - PubMed

Publication types

Associated data