. 2022 May 9;40(5):524-544.e5.
doi: 10.1016/j.ccell.2022.04.005. Epub 2022 May 9.

An activation to memory differentiation trajectory of tumor-infiltrating lymphocytes informs metastatic melanoma outcomes

Affiliations

An activation to memory differentiation trajectory of tumor-infiltrating lymphocytes informs metastatic melanoma outcomes

Abhinav Jaiswal et al. Cancer Cell. .

Abstract

There is a need for better classification and understanding of tumor-infiltrating lymphocytes (TILs). Here, we applied advanced functional genomics to interrogate 9,000 human tumors and multiple single-cell sequencing sets using benchmarked T cell states, comprehensive T cell differentiation trajectories, human and mouse vaccine responses, and other human TILs. Compared with other T cell states, enrichment of T memory/resident memory programs was observed across solid tumors. Trajectory analysis of single-cell melanoma CD8+ TILs also identified a high fraction of memory/resident memory-scoring TILs in anti-PD-1 responders, which expanded post therapy. In contrast, TILs scoring highly for early T cell activation, but not exhaustion, associated with non-response. Late/persistent, but not early activation signatures, prognosticate melanoma survival, and co-express with dendritic cell and IFN-γ response programs. These data identify an activation-like state associated to poor response and suggest successful memory conversion, above resuscitation of exhaustion, is an under-appreciated aspect of successful anti-tumoral immunity.

Keywords: ICB; T cell memory; TILs; immune checkpoint blockade; immune persistence; melanoma; survival; systems biology; tumor-infiltrating lymphocytes.


Conflict of interest statement

Declaration of interests N.A. is a scientific advisor and an equity holder in Shennon Biotechnologies, and is a consultant for Janssen, Immunitas, and Cellino Pharmaceuticals. B.I. is a consultant for Volastra Therapeutics Inc., Johnson & Johnson/Janssen, and received honoraria from AstraZeneca and Merck. None of these represent a conflict of interest pertaining to the presented work. O.E. is supported by Janssen, Johnson & Johnson, Astra-Zeneca, Volastra, and Eli Lilly research grants. He is scientific advisor to and equity holder in Freenome, Owkin, Volastra Therapeutics, Harmonic Discovery, and OneThree Bio, and a paid scientific advisor to Champions Oncology and Pionyr Therapeutics. O.T. is on the Scientific Advisory Board of Caris Life Sciences. V.H.E. is a consultant and shareholder for Agenus, Inc. A.R. is a founder and equity holder of Celsius Therapeutics, an equity holder in Immunitas Therapeutics and, until August 31, 2020, was a SAB member of Syros Pharmaceuticals, Neogene Therapeutics, Asimov, and Thermo Fisher Scientific. From August 1, 2020, A.R. is an employee of Genentech, a member of the Roche Group. A.R. is an inventor on multiple patents related to single-cell and spatial genomics filed by the Broad Institute.

Figures

Figure 1:
Figure 1:. Human and mouse TRM, and human metastatic melanoma TILs co-express immune activation, inhibitory checkpoint molecules, and tissue-residency markers.
A. Relative expression of immune checkpoint transcripts in murine TRM across organs and infections: influenza (lung), lymphocytic choriomeningitis virus (LCMV) (gut), herpes simplex virus (HSV) (skin) and vesicular stomatitis virus (VSV) (brain), or in dendritic epidermal T cells (DETC). Transcript levels are expressed as a normalized ratio to naive T cells from each respective data set and includes GSE47045(Mackay et al., 2013) (n=3 samples per condition) or GSE3915 (Wakim et al., 2012) (brain, n=3–5 replicates per condition). Significance values for the expression level of transcripts relative to naïve T cells were calculated using an unpaired Student’s t test. B. Left: Heat map of immune checkpoint and activation transcripts in murine TRM across tissue sites and infections generated using GSE47045 (Mackay et al., 2013). Right: Heat map of immune checkpoint and activation molecules in T cells infected with Runx3 cDNA-expressing retrovirus generated using GSE106107 (Milner et al., 2017). RNA-seq analyses of Runx3-deficient (fl/fl) or overexpressing cells (+++) (n=2 biological replicates of approximately 20 million paired-reads per sample). C. Steady-state human skin TRM from pooled patient epidermal sheets. Expression of PD-1 on epidermal CD45+CD3+ CD8+ T cells. CD8+ T cells were sub-gated further into CD69+CD103+ or CD69+CD103 TRM, or recirculating CD103CD69 T cells as defined previously (Watanabe et al., 2015). D. Analysis of 1500 human T cell melanoma TILs isolated from 13 patients including lymphoid and non-lymphoid metastases (GSE72056 (Tirosh et al., 2016)). Top: T cells rank ordered by TRM score. Bottom: Heat map of the top vs. bottom 82 TRM genes in rank ordered T cells. E. Correlation between the expression of immune checkpoint and activation markers and TILs TRM scores, based on genes upregulated or downregulated in TRM. F. Representative PD-1 flow cytometry of CD45+HLA-DR CD8+ T cells stained for CD103 and CD69 isolated from a LN melanoma metastasis. G. Percentage CD69+ CD103+ expressing CD8+ T cells isolated from the same individuals non-involved LN (NIN) or tumor involved LN (TIN) with metastatic melanoma (n=5 paired specimens). Significance values were calculated using a paired Student’s t test. H. Percent PD-1+ or percent granzyme B+ of CD3+ CD8+ T cells in each of the 4 quadrants based on CD69 and CD103 expression testing 19 patient specimens with metastatic melanoma as compared to PBMCs from 3 healthy volunteer donors (ND). Samples were taken from PBMC of healthy volunteers (n=3), NIN (n=5) and TIN (n=6), skin metastases (n=6) or small bowel metastases (n=7). Data shown as mean ± SD. Significance values were calculating using an unpaired Student’s t test. *, p≤0.05; **, p≤0.01; ***, p≤0.001; ****, p≤0.0001. See also Figure S1 and Tables S1–S2.
Figure 2:
Figure 2:. Human melanoma and other cancers show a relative enrichment of T memory and resident memory programming
A. Derivation of viral T cell signatures. Top: schema depicting derivation of non-exclusive signatures. Bottom: Venn diagram depicting removal of shared transcripts from signatures to generate exclusive signatures. For Tact and Tmem, early and late signatures were unionized before removing overlapping transcripts. B. Scoring of 2608 single cell melanoma T cells by the expression of exclusive viral T cell signatures. Cells were rank ordered by TRM scores. Scores are defined by the average expression (log2-transformed and centered) of upregulated (e.g. Tact-high) signatures minus the average expression of downregulated (e.g. Tact-low) signatures. C-D. Enrichment of exclusive viral T cell signatures in (C) primary (n=80) or metastatic (n=368) melanoma, or (D) multiple primary cancers. Data in (C) shown as boxplots, with top/middle/bottom lines indicating the 3rd quartile, median, and 1st quartile, respectively. Whiskers indicate minimum and maximum values, and dots represent outliers. Significance values are shown for the comparison between primary and metastatic melanoma using the Wilcoxon rank sum test. Data in (D) shown as a bubble plot, with both color and size of points indicating mean enrichment score. See also Figure S2 and Tables S1–S2.
Figure 3:
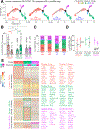
Figure 3:. Three major single cell trajectory states define responder and non-responder status
A. Pseudotime trajectory for CD8A+CD3E+ co-expressing T-cell clusters identified by pre-treatment vs. post-treatment and response status (responder vs. non-responder), respectively. Cells are colored by assigned pseudotime cluster. B. Relative percentage of cells (CD8A+CD3E+) from each pseudotime cluster in non- responder vs. responder samples. Dots represent individual samples. Differences between groups were modelled using mixed-effects modeling (MEM) (see STAR Methods), bars graphs and error bars show estimated marginal mean ± SEM. *, p≤0.05; ** p≤0.01; *** p≤0.001; **** p≤0.0001. C. Relative percentage of cells from each pseudotime cluster in all samples separated by baseline and post treatment in responders and non-responders. D. Relative percent of CD8A+CD3E+ cells derived from each cluster per patient, and averaged across all patient samples, separated by pre/post treatment status and by non-responsive/responsive sites. Differences in cluster frequencies between non-responders and responders was modelled using MEM (see STAR Methods). Data shown as estimated marginal mean ± SEM. *, p≤0.05; ** p≤0.01; *** p≤0.001; **** p≤0.0001. E. Left: heatmap depicting the expression of pseudotime cluster Differentially Expressed Genes (DEGs) in CD8A+CD3E+ co-expressing TILs (FDR <0.05). Right: top pseudotime cluster DEGs (FDR < 0.01, sorted by |logFC|) are annotated. See also Figure S3, Table S1 and Table S3.
Figure 4:
Figure 4:. Non- responder cluster most closely associates to early activation signatures while responder associated cluster 3 and 5 are most closely associated to resident and central memory respectively
A. Pathway overrepresentation analysis of DEGs defining each pseudotime cluster. Positive or negative enrichment values indicate that pathway enrichment is driven by DEGs respectively up- or downregulated in cells in that cluster. B. Changes in pseudotime cluster program expression (average z-score) during T cell differentiation in response to (L to R): LCMV Armstrong infection (GSE10239 (Sarkar et al., 2008); GSE41867 (Doering et al., 2012)), LCMV cl. 13 infection (GSE41867), autochthonous tumor induction (GSE89307 (Philip et al., 2017)), vaccinia virus infection (GSE79805 (Pan et al., 2017)), and human yellow fever vaccination (naïve → Activation: GSE26347; naïve → activation → memory: GSE100745 (Akondy et al., 2017)). Data points and error bars indicate mean and 95% CI of the relative enrichment of cluster DEGs. Black line and grey ribbon indicate the same for an equal number of random transcripts. Significance values are shown for the comparison between signature enrichment at a given timepoint and the timepoint immediately preceding it, which was carried out using mixed-effects modeling (see statistics section). For vaccinia virus infection, a linear regression model was fitted (shaded) and the change in cluster program activity from d0 to d90 is annotated along with significance of the rate of change. For GSE100745, significance values for enrichment at a given timepoint vs the timepoint preceding it were calculated using a Student’s t test. *, p≤0.05; ** p≤0.01; *** p≤0.001; **** p≤0.0001. See also Figure S4 and Tables S1, S4, and S5.
Figure 5:
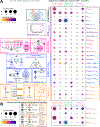
Figure 5:. Human melanoma TILs associated to ICB non-response/response show higher overlap with early viral activation and resident memory signatures than multiple exhaustion, dysfunction, anergy models.
A-B. Left: schemas depicting generation of (A) murine T cell signatures, or (B) human vaccine response signatures. Right: Over-representation analysis of pseudotime cluster DEGs with corresponding signatures. Size indicates significance of enrichment (−log10(p value)). Color indicates magnitude of signature overlap (log2(Odds Ratio)). Grey squares indicate non-significant enrichment (FDR < 0.05). See also Figure S5, Tables S1, S6 and S7
Figure 6:
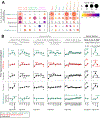
Figure 6:. Human TILs classified as dysfunctional/exhausted from independent datasets associate to pseudotime cluster 1, and early activation over terminal exhaustion.
A. Overrepresentation analysis of human TILs signatures with left: pseudotime cluster DEGs, or right: exclusive viral T cell signatures and human vaccine response signatures. Size indicates significance of enrichment (−log10(p value)). Color indicates magnitude of signature overlap (log2(Odds Ratio)). Grey squares indicate non-significant enrichment (FDR < 0.05). B. Relative enrichment of human TILs signatures in timecourses of T cell differentiation. Signatures from TILs labeled as dysfunctional/exhausted are bracketed. Data points and error bars indicate mean and 95% CI of the relative enrichment of TILs signatures. Black line and grey ribbon indicate the same for an equal number of random transcripts. Significance values are shown for the comparison between signature enrichment at a given timepoint and the timepoint immediately preceding it, which was carried out using mixed-effects modeling (see statistics section). For vaccinia virus infection, the slope of DEG enrichment over the 90 day timecourse (shaded) was calculated using lm, with slopes and significance values annotated. For GSE100745, significance values for enrichment at a given timepoint vs the timepoint preceding it were calculated using a Student’s t test. *, p≤0.05; ** p≤0.01; *** p≤0.001; **** p≤0.0001. See also Figure S6, Tables S1 and S8.
Figure 7:
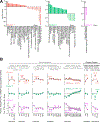
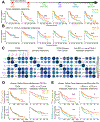
Figure 7:. Late persistent memory states and exhaustion positively stratify overall melanoma survival, and the response to ICB, and correlate with each other.
A-B. Patient survival stratification testing non-exclusive T cell signatures in (A) metastatic melanoma specimens (n=355), or (B) metastatic melanoma patients treated with αPD-1 (n = 121). High, medium, and low expression of each signature was used to stratify patient survival. C. Correlation scores between exclusive T cell signatures, a DC maturation signature and an IFN-γ response signature, comparing samples across metastatic melanomas irrespective of metastatic site (n=367, Pearson), primary cutaneous melanomas (n=103, Pearson), all primary cancers (n = 9127, Pearson), and in metastatic melanoma patients treated with αPD-1 (n = 121, Spearman). D-E. Patient survival stratification testing d. human yellow fever effectors and TD-like TILs from kidney/bladder/prostate cancer, or e. yellow fever memory and stem-like TILs signatures from kidney/bladder/prostate cancer in left: metastatic melanoma specimens (n=355), or right: metastatic melanoma patients treated with αPD-1 (n = 121). Survival statistics represent Mantel-Cox analysis. *, p≤0.05; **, p≤0.01; ***, p≤0.001. See also Figure S7.

Comment in

Similar articles

Cited by

References

    1. Ahmadzadeh M, Johnson LA, Heemskerk B, Wunderlich JR, Dudley ME, White DE, and Rosenberg SA (2009). Tumor antigen-specific CD8 T cells infiltrating the tumor express high levels of PD-1 and are functionally impaired. Blood 114, 1537–1544. 10.1182/blood-2008-12-195792. - DOI - PMC - PubMed
    1. Ahn E, Araki K, Hashimoto M, Li W, Riley JL, Cheung J, Sharpe AH, Freeman GJ, Irving BA, and Ahmed R (2018). Role of PD-1 during effector CD8 T cell differentiation. Proc Natl Acad Sci U S A 115, 4749–4754. 10.1073/pnas.1718217115. - DOI - PMC - PubMed
    1. Akondy RS, Fitch M, Edupuganti S, Yang S, Kissick HT, Li KW, Youngblood BA, Abdelsamed HA, McGuire DJ, Cohen KW, et al. (2017). Origin and differentiation of human memory CD8 T cells after vaccination. Nature 552, 362–367. 10.1038/nature24633. - DOI - PMC - PubMed
    1. Alfei F, Kanev K, Hofmann M, Wu M, Ghoneim HE, Roelli P, Utzschneider DT, von Hoesslin M, Cullen JG, Fan Y, et al. (2019). TOX reinforces the phenotype and longevity of exhausted T cells in chronic viral infection. Nature 571, 265–269. 10.1038/s41586-019-1326-9. - DOI - PubMed
    1. Angelosanto JM, Blackburn SD, Crawford A, and Wherry EJ (2012). Progressive Loss of Memory T Cell Potential and Commitment to Exhaustion during Chronic Viral Infection. Journal of Virology 86, 8161–8170. 10.1128/jvi.00889-12. - DOI - PMC - PubMed

Publication types

Substances