. 2022 Jul 7;82(13):2472-2489.e8.
doi: 10.1016/j.molcel.2022.04.015. Epub 2022 May 9.

NSD1 mediates antagonism between SWI/SNF and polycomb complexes and is required for transcriptional activation upon EZH2 inhibition

Affiliations

NSD1 mediates antagonism between SWI/SNF and polycomb complexes and is required for transcriptional activation upon EZH2 inhibition

Yiannis Drosos et al. Mol Cell. .

Abstract

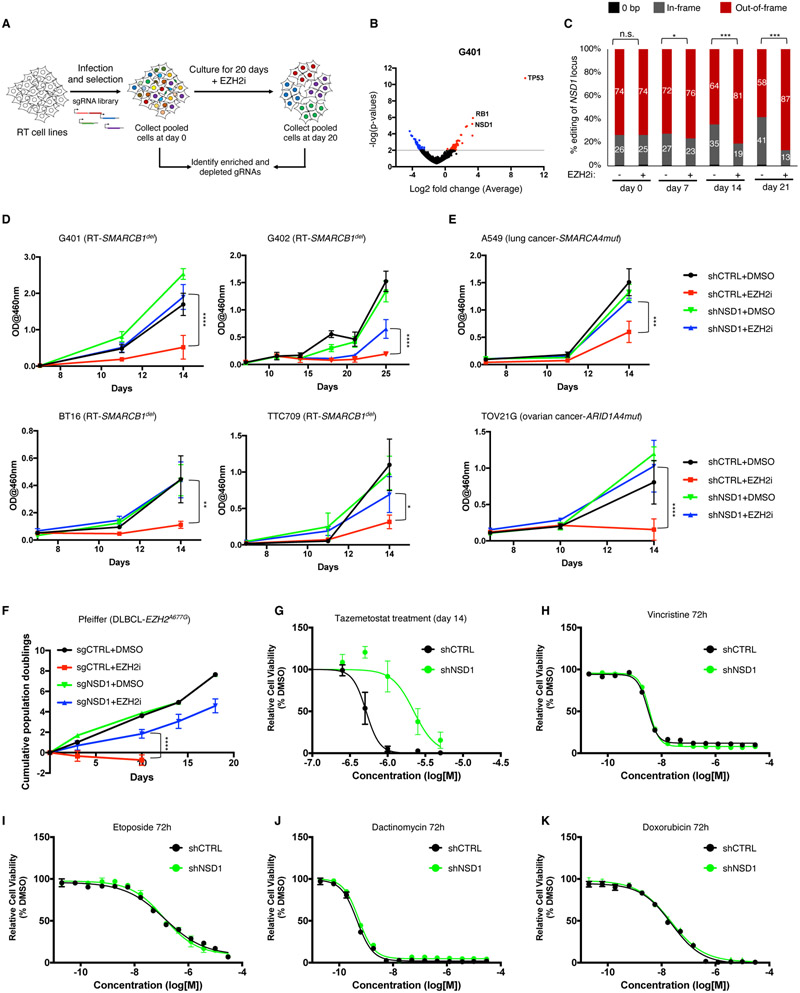
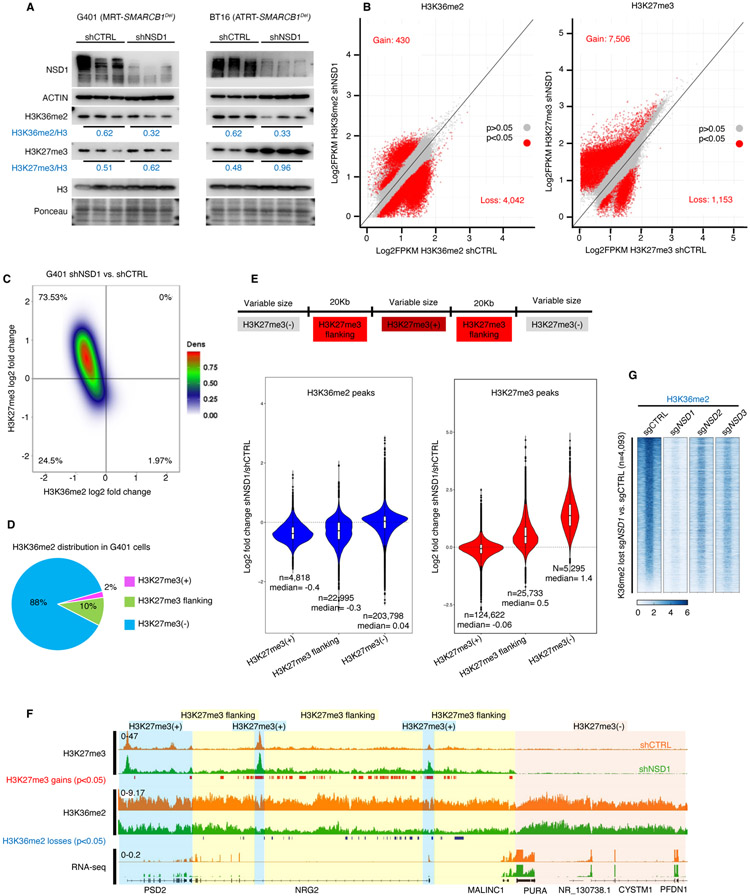
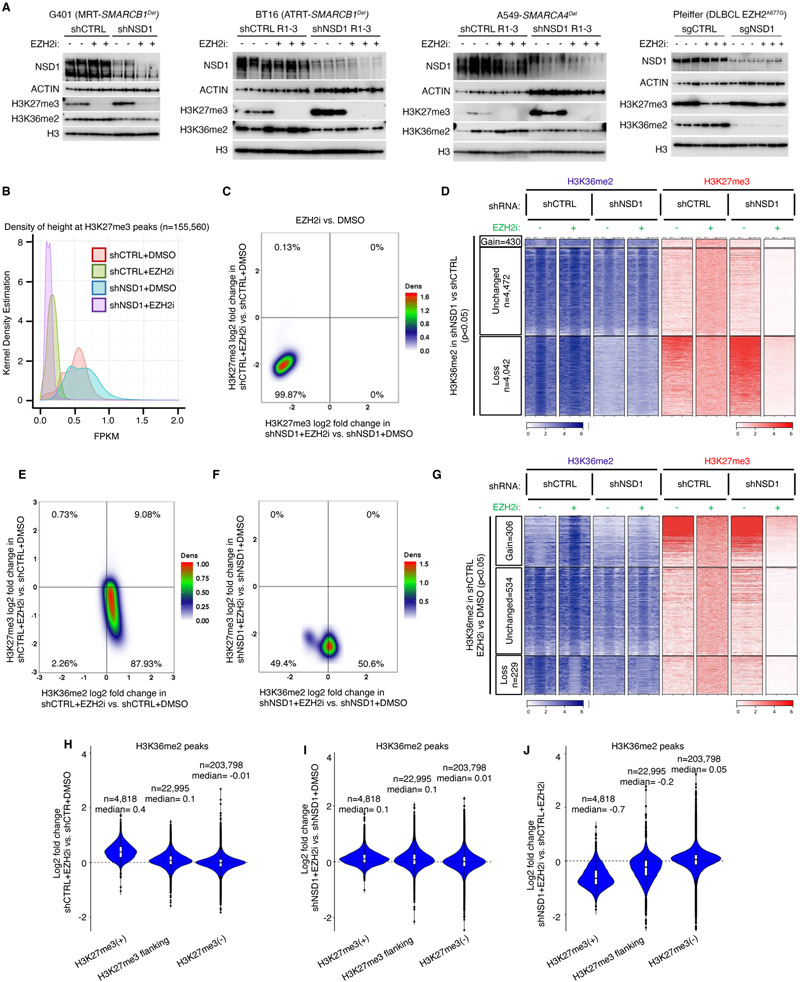
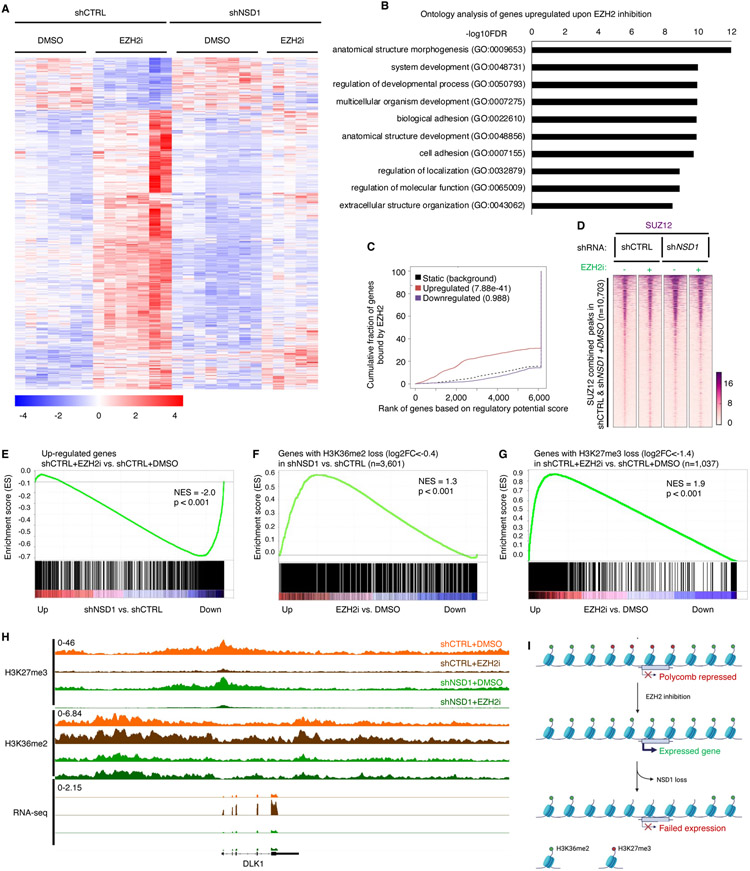
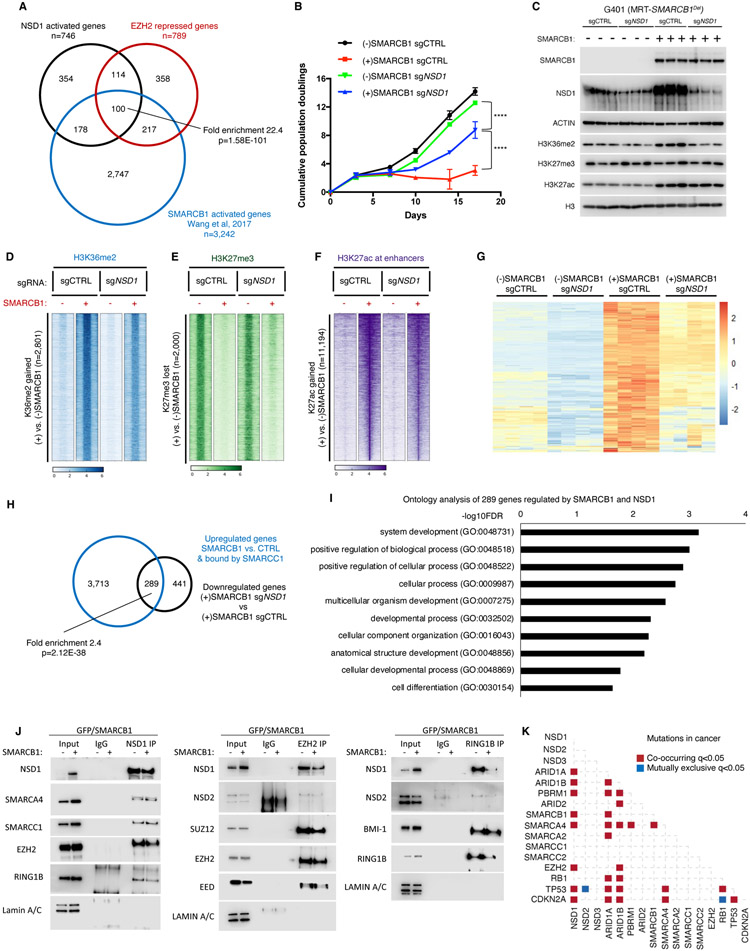
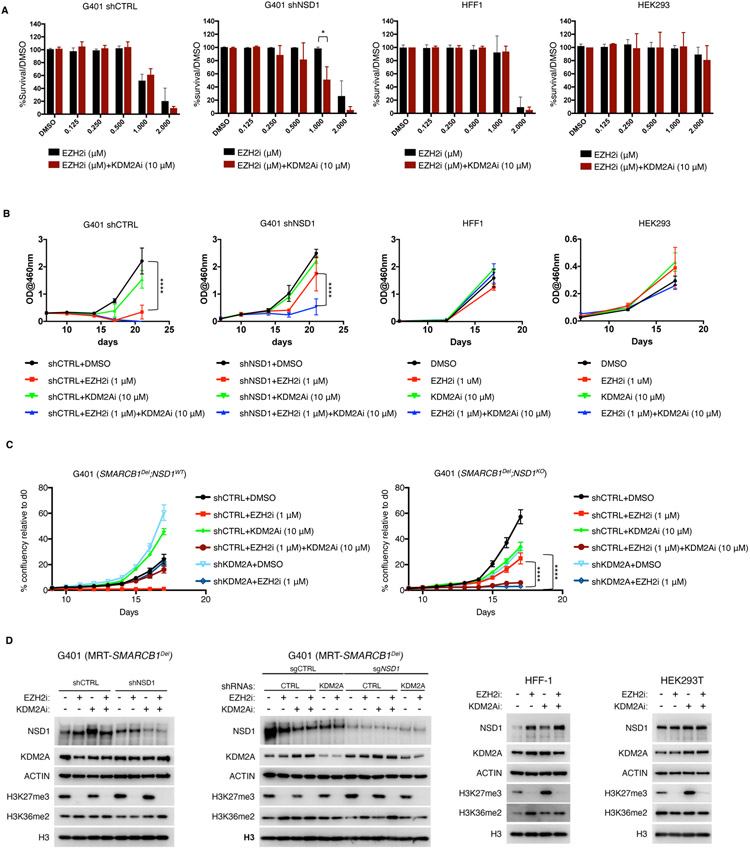
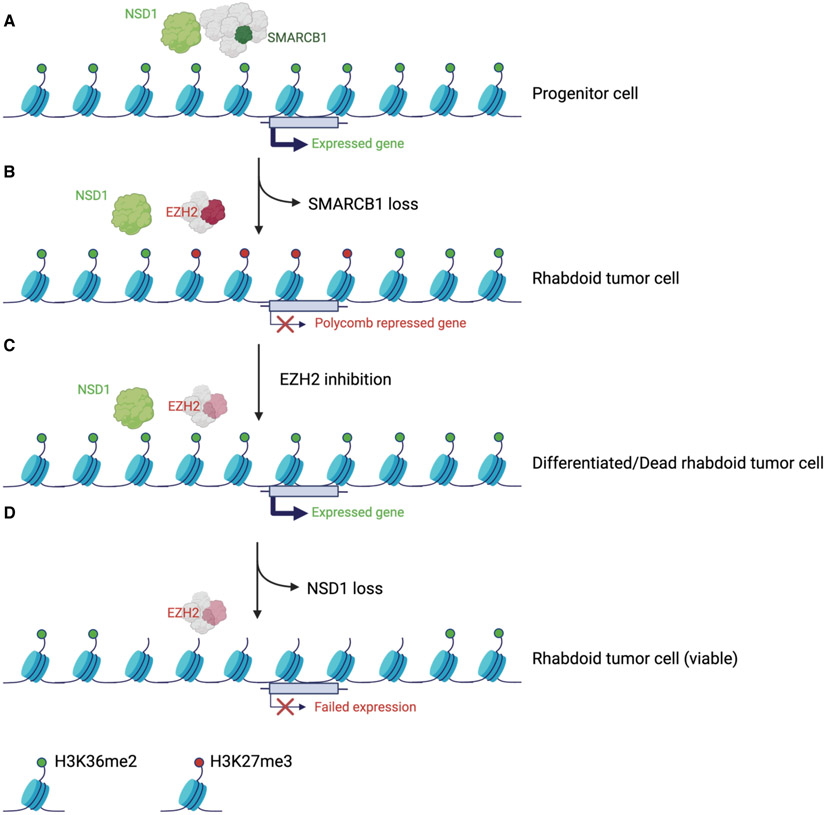
Disruption of antagonism between SWI/SNF chromatin remodelers and polycomb repressor complexes drives the formation of numerous cancer types. Recently, an inhibitor of the polycomb protein EZH2 was approved for the treatment of a sarcoma mutant in the SWI/SNF subunit SMARCB1, but resistance occurs. Here, we performed CRISPR screens in SMARCB1-mutant rhabdoid tumor cells to identify genetic contributors to SWI/SNF-polycomb antagonism and potential resistance mechanisms. We found that loss of the H3K36 methyltransferase NSD1 caused resistance to EZH2 inhibition. We show that NSD1 antagonizes polycomb via cooperation with SWI/SNF and identify co-occurrence of NSD1 inactivation in SWI/SNF-defective cancers, indicating in vivo relevance. We demonstrate that H3K36me2 itself has an essential role in the activation of polycomb target genes as inhibition of the H3K36me2 demethylase KDM2A restores the efficacy of EZH2 inhibition in SWI/SNF-deficient cells lacking NSD1. Together our data expand the mechanistic understanding of SWI/SNF and polycomb interplay and identify NSD1 as the key for coordinating this transcriptional control.

Keywords: BAF; EZH2 inhibition; NSD1; SWI/SNF; chromatin; epigenetics; polycomb; transcription.


Conflict of interest statement

Declaration of interests The authors declare no competing interests.

Figures

Figure 1.
Figure 1.. NSD1 loss confers resistance to EZH2 inhibition.
(A) Schematic overview of the CRISPR screen. (B) Differential enrichment of gRNAs in the CRISPR-Cas9 screen of EZH2i treated G401 cells. The x-axis represents the log fold change of targets based on averaged sgRNA abundance at day 20 vs. day 0 in the presence of GSK126. Positive (red) values represent genes that when deleted provide resistance to GSK126 whereas negative (blue) values represent gene deletions that sensitize cells to GSK126 treatment. The screen was performed with two RT cell lines (G401 and G402) with n=3 biological replicates. (C) CRISPR-based competitive fitness. NSD1 was targeted with sgRNA in G401 cells and genomic DNA sequenced after 0, 7, 14- and 21-days treatment with GSK126. All indels were binned into in-frame, out-of-frame, or 0-bp. Student’s t-test,*=<0.01, ***=<0.0001, n=3 biological replicates. (D and E) Proliferation curves of RT (D) and non-RT SWI/SNF mutant (E) cell lines after NSD1 knockdown and treatment with EZH2 inhibitor GSK126. Proliferation was assessed by a modified MTT assay (MTS). (F) Proliferation of the Pfeiffer lymphoma cell line after NSD1 KO and treatment with either DMSO or GSK126. Proliferation was assessed by cell counting. (G) Sensitivity of G401 NSD1 KO cell lines to EZH2 inhibitor Tazemetostat. (H-K) Proliferation of G401 control and NSD1-depleted cells after treatment with standard of care therapeutics vincristine (H), etoposide (I), dactinomycin (J) and doxorubicin (K). Proliferation was assessed by Cell Titer Glo assay at 72 hours of treatment. For all viability assays, two-way Anova with Turkey’s test for multiple hypothesis correction was used. Error bars represent means ±s.d. (n=2-3 biological replicates, 3 technical replicates). *p < 0.05; **p < 0.01; ***p < 0.001.
Figure 2.
Figure 2.. NSD1 depletion leads to H3K36me2 loss and concomitant expansion of H3K27me3 domains.
(A) Immunoblot analysis of G401 and BT16 RT cells upon NSD1 knockdown, with quantification of histone marks normalized to total H3. (B) Scatter plot analysis of sites differentially enriched for H3K36me2 and H3K27me3 in ChIP-seq analyses of G401 cells subject to NSD1 knockdown. Significance computed using empirical Bayesian statistical tests and linear fitting, see methods for details. (C) Density plot analysis using 10Kb window segmentation to reveal the relationship between sites of change in H3K27me3 and H3K36me2 upon NSD1 knockdown in G401 RT cells. The genome was segmented into 10Kb bins, and the log2 fold changes were calculated. The plot represents log2 fold change of H3K36me2 and H3K27me3 signal in 10Kb windows. (D) H3K36me2 distribution in H3K27me3-defined genomic regions. The genome was classified into 3 groups based on H3K27me3 levels in shCTRL cells (see text for details). H3K36me2 signal across four conditions (shCTRL G401, shNSD1 G401 +/− EZH2 inhibitor, see methods) was defined and assigned to H3K27me3-based domains. (E) Violin plots show differentially enriched H3K36me2 and H3K27me3 peaks (log2 fold change) in shNSD1 vs. shCTRL G401 cells, in each H3K27me3-based domain. (F) Genome browser tracks for H3K27me3 and H3K36me2 in G401 RT cells treated with shCTRL or shNSD1. Significant H3K27me3 gains (red) and H3K36me2 losses (blue) are depicted. Blue shaded domain=H3K27me3(+), yellow=H3K27me3(+) flanking and pink=H3K27me3(−) domains (G) Region-scaled heatmap visualization of H3K36me2 normalized ChIP-seq coverage, rank-ordered based on losses in sgNSD1 vs. control G401 cells, including averaged normalized coverage for sgNSD2 and sgNSD3 cells (n=2).
Figure 3.
Figure 3.. H3K27me3 erasure by EZH2 inhibition is independent of NSD1.
(A) Immunoblot analysis of either control or NSD1 depleted G401 (RT), BT16 (RT), A549 (SMARCA4Del) and Pfeiffer (EZH2 hypermorph) cells upon EZH2 inhibition. (B) Kernel density plot of H3K27me3 density (fragment length per kilobase/million read (FPKM)) for control and NSD1 depleted cells EZH2 inhibition. (C) Density plot showing the relationship between the genome-wide changes in H3K27me3 in control vs NSD1 depleted cells upon EZH2 inhibition, using 10kb genome segmentation analysis. Each dot is a 10-Kb window with x/y-axis as log2 fold change. (D) Region scaled heatmap of H3K36me2, and H3K27me3 ChIP-seq data, of H3K36me2 peaks +/− 3Kb and grouped by changes in K36me2 upon NSD1 knockdown. Significance computed using empirical Bayesian statistical tests and linear fitting, see methods for details. (E and F) Density plots of relationship between genome-wide changes in H3K27me3 and H3K36me2 using genome segmentation analysis in control (E) and NSD1 depleted (F) cells upon EZH2 inhibition. (G) Region scaled heatmap visualization of H3K36me2 and H3K27me3 ChIP-seq data, of the H3K36me2 peak regions +/− 3Kb and grouped by changes upon EZH2 inhibition in shCTRL cells. Significance computed using empirical Bayesian statistical tests and linear fitting, see methods for details. (H-J) Violin plots show differentially enriched H3K36me2 peaks (log2 fold change) in either G401 control (H), NSD1 depleted (I) or both (J), upon EZH2 inhibition, in each H3K27me3-based domain. For all EZH2 inhibition experiments, cells were treated with either DMSO or 1uM GSK126 for 3 days.
Figure 4.
Figure 4.. Transcriptional de-repression following EZH2 inhibition depends on NSD1.
(A) Heatmap of 1,041 differentially expressed genes (789 Up, 252 Down, log2 fold change>0 or<0, adjusted p value <0.05, significance computed using empirical Bayesian statistical tests and linear fitting) in control or NSD1 depleted G401 cells upon EZH2 inhibition. Each column represents a biological replicate and rows are hierarchically clustered based on gene expression z-scores (see methods for details). (B) Gene ontology analysis of the 789 genes upregulated upon EZH2 inhibition in control G401 cells in (A). Only the top 10 out of the 363 total pathways with FDR<0.05 are shown. (C) Binding and expression target analysis (BETA) of genes upregulated upon EZH2 inhibition and bound by EZH2 in untreated control cells. Each gene is assigned a regulatory potential score based on its expression and binding by EZH2. The red and blue lines represent genes up and down regulated upon EZH2 inhibition, respectively. The dashed line represents genes unchanged or static upon EZH2 inhibition and represent the background. Genes are aggregated based on the “regulatory potential score” and ranked from high to low. P-values are calculated using the Kolmogorov-Smirnov test. (D) Peak centered heatmap of SUZ12 normalized ChIP-Seq coverage, rank-ordered based on peak signal in untreated control and NSD1 depleted cells (n=1 replicate). (E) Preranked GSEA using a gene set defined as genes up-regulated (adjusted p-value < 0.05 and log2FC > 0) upon EZH2 inhibition, compared to log2FC ranked genes differentially expressed after NSD1 depletion. (F and G) Preranked GSEA using a gene set defined as genes losing (log2FC < −0.4) H3K36me2 upon NSD1 depletion (F) or EZH2 inhibition (G) compared to log2FC ranked genes differentially expressed after EZH2 inhibition. (H) Genome browser tracks depicting H3K27me3, H3K36me2 and RNA-seq reads upon EZH2 inhibition in both control and NSD1 depleted cells. (I) Schematic representation of the H3K36me2 role in transcriptional activation of Polycomb repressed genes upon EZH2 inhibition. For all EZH2 inhibition experiments, cells were treated with either DMSO or 1uM GSK126 for 3 days. For GSEA analysis, statistics were calculated by the GSEA tool ( methods for details). NES=normalized enrichment score.
Figure 5.
Figure 5.. NSD1 cooperates with SWI/SNF to activate transcription and induce differentiation.
(A) Analysis of intersection between genes downregulated in shNSD1 vs. shCTRL, upregulated upon SMARCB1 addback + bound by SMARCC1, and upregulated upon EZH2 inhibition by Venn diagram and enrichment statistics (p-value computed using standard Fisher’s exact Test for pairwise overlaps and “Exact Test of Multi-set Intersections” for multi-list overlaps). (B) Proliferation assays for G401 control and SMARCB1 cells with and without NSD1. (C) Immunoblot analysis of G401 isogenic cell lines ectopically expressing GFP or SMARCB1. (D-F) Region-scaled heatmap visualizations of normalized ChIP-Seq coverage, rank-ordered based on changes in SMARCB1-induced G401 cells vs control cells depicting sites of H3K36me2 gain (D), H3K27me3 loss (E) and H3K27ac gain at enhancers (F). n=2 biological replicates. (G) Heatmap of the 289 genes that are both upregulated by SMARCB1 addition and downregulated by NSD1 loss. n=4 biological replicates per condition. (H) Venn diagram of the 4,002 genes upregulated by SMARCB1 and bound by SMARCC1 and the 730 genes downregulated by loss of NSD1. There are 289 genes with significant overlap (Fisher’s exact Test) among the 2 datasets (p=2.12E-38). (I) Significantly enriched biological processes based on the 289 genes that require NSD1 for upregulation by SMARCB1. (J) Co-immunoprecipitation analysis of NSD1, EZH2 and RING1B in G401 cells upon SMARCB1 addback and schematic representation of the results. Representative immunoblots from n=2 biological replicates. (K) Analysis of mutation co-occurrence and mutual exclusivity in cancer patients using cBioportal (see methods for details). Fisher’s Exact Test was used.
Figure 6.
Figure 6.. KDM2A inhibition restores sensitivity of NSD1-depleted cells to EZH2 inhibition.
(A) Clonogenic assay results from EZH2 and KDM2A inhibition of G401 control and NSD1 depleted cells treated for 14 days. Human fibroblasts (HFF-1) and HEK293T cells served as controls. Each experiment was performed with n=2 biological replicates and n=3 technical replicates and scanned by densitometry. (B) TT-based proliferation curves of G401 control or NSD1 depleted cells treated with either DMSO, EZH2i (GSK126) 1uM, KDM2Ai (TC-E5002) 10uM or a combination (n=3 biological replicates). (C) Incucyte-based proliferation curves of G401 control and NSD1 depleted cells expressing either shCTRL or shKDM2A and treated with DMSO, EZH2i (GSK126) 1uM, KDM2Ai (TC-E5002) 10uM or a combination. Two-way Anova with Turkey’s test for multiple hypothesis correction. Error bars represent means ±s.d. (n=3 biological replicates). *p < 0.05; **p < 0.01; ***p < 0.001. (D) Immunoblot analysis of G401, HFF-1 and HEK293T cells treated with a combination of 1uM GSK126 and 10uM TC-E5002 or with KDM2A shRNA, after 7 days of treatment. Representative blots are shown from n=2 biological replicates.
Figure 7.
Figure 7.. Proposed model of NSD1 action.
(A) In a proliferating progenitor cell, the activation of differentiation related genes results in cessation of proliferation. (B) The loss of SMARCB1 in RT cells results in the replacement of SWI/SNF complexes with Polycomb silencing complexes at differentiation driving genes, thus preventing differentiation. (C) Treatment of RT cells with EZH2 inhibitors leads to removal of H3K27me3 modifications and results in NSD1 writing H3K36me2 activating modifications in its place, activating differentiation associated genes and causing cell arrest/death. (D) The loss of NSD1 impairs the gain of H3K26me2 and blocks the cell death otherwise caused by EZH2 inhibition. Figure created with BioRender.com

Similar articles

Cited by

References

    1. Allis CD, and Jenuwein T (2016). The molecular hallmarks of epigenetic control. Nature Reviews Genetics 17, 487–500. - PubMed
    1. Alver BH, Kim KH, Lu P, Wang X, Manchester HE, Wang W, Haswell JR, Park PJ, and Roberts CW (2017). The SWI/SNF chromatin remodelling complex is required for maintenance of lineage specific enhancers. Nat Commun 8, 14648. - PMC - PubMed
    1. Bennett RL, Swaroop A, Troche C, and Licht JD (2017). The Role of Nuclear Receptor–Binding SET Domain Family Histone Lysine Methyltransferases in Cancer. Cold Spring Harbor Perspectives in Medicine 7. - PMC - PubMed
    1. Bhanu NV, Sidoli S, and Garcia BA (2020). A Workflow for Ultra-rapid Analysis of Histone Post-translational Modifications with Direct-injection Mass Spectrometry. Bio Protoc 10, e3756. - PMC - PubMed
    1. Blackledge NP, Zhou JC, Tolstorukov MY, Farcas AM, Park PJ, and Klose RJ (2010). CpG Islands Recruit a Histone H3 Lysine 36 Demethylase. Molecular Cell 38, 179–190. - PMC - PubMed

Publication types

MeSH terms