. 2022 Jul;28(7):1468-1475.
doi: 10.1038/s41591-022-01855-7. Epub 2022 May 10.

Modeling transmission of SARS-CoV-2 Omicron in China

Affiliations

Modeling transmission of SARS-CoV-2 Omicron in China

Jun Cai et al. Nat Med. 2022 Jul.

Abstract

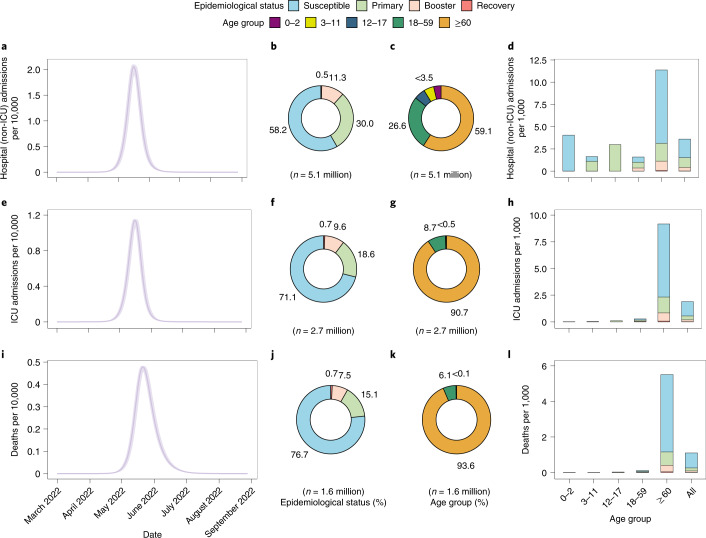
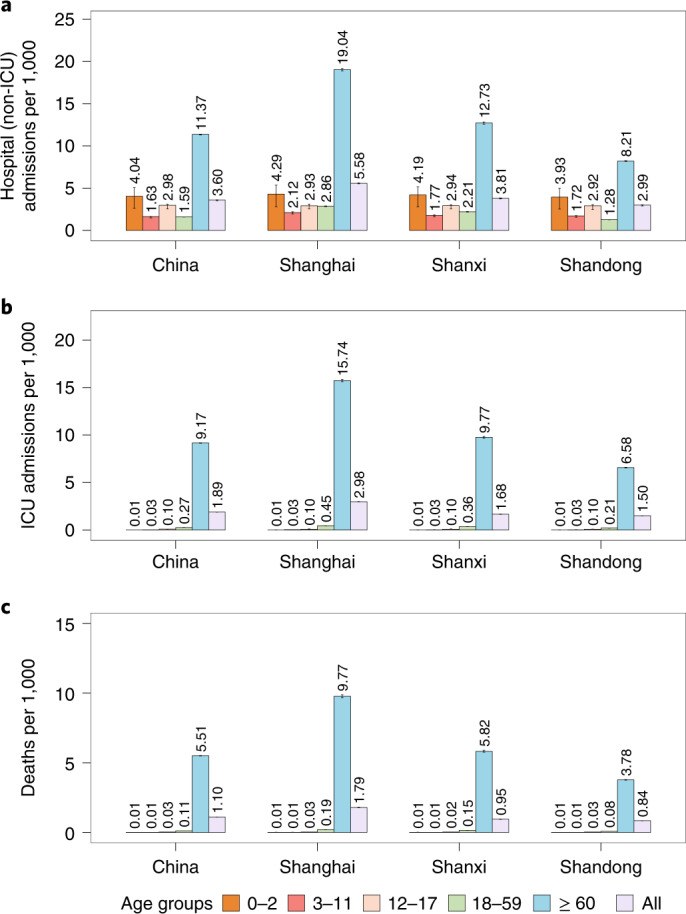
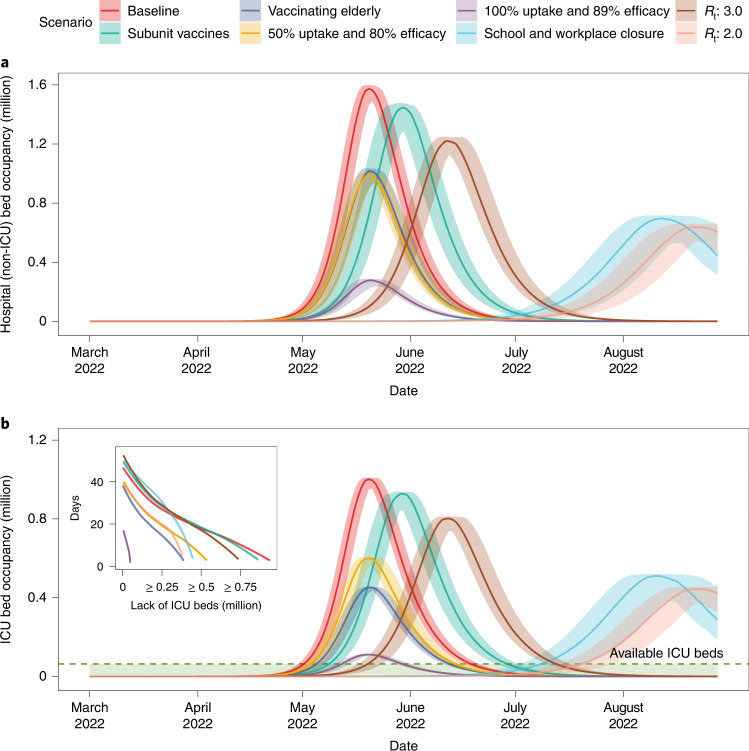
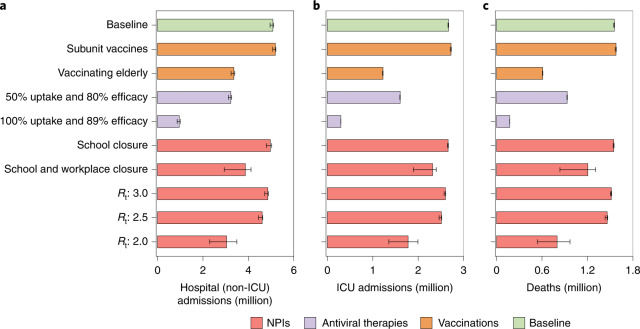
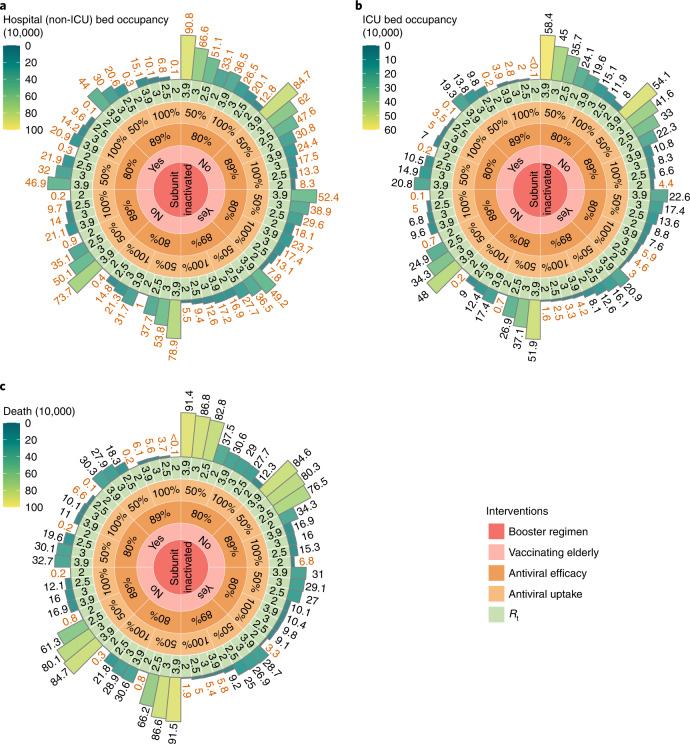
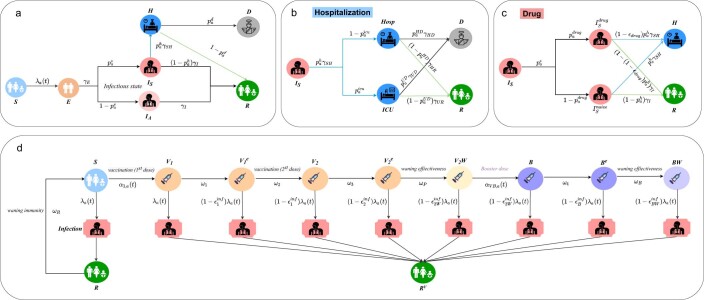
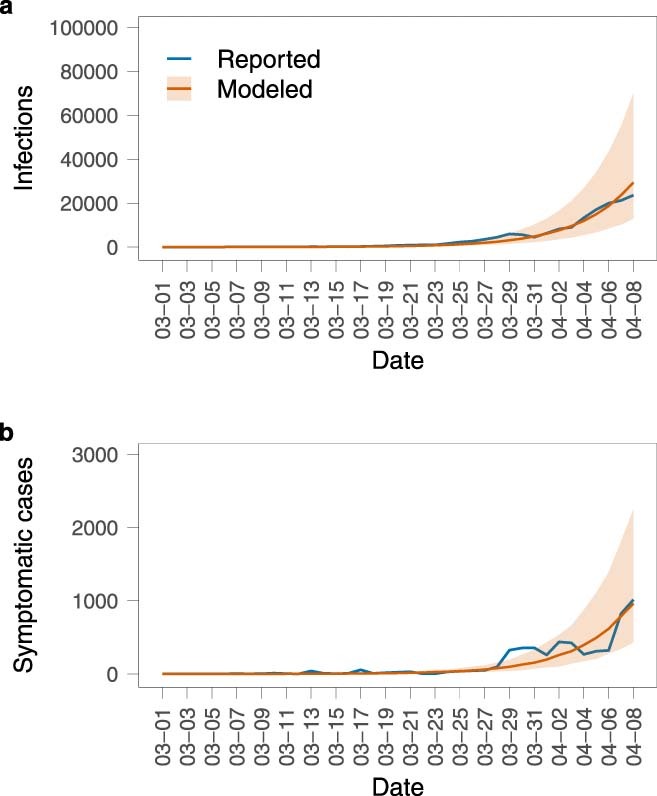
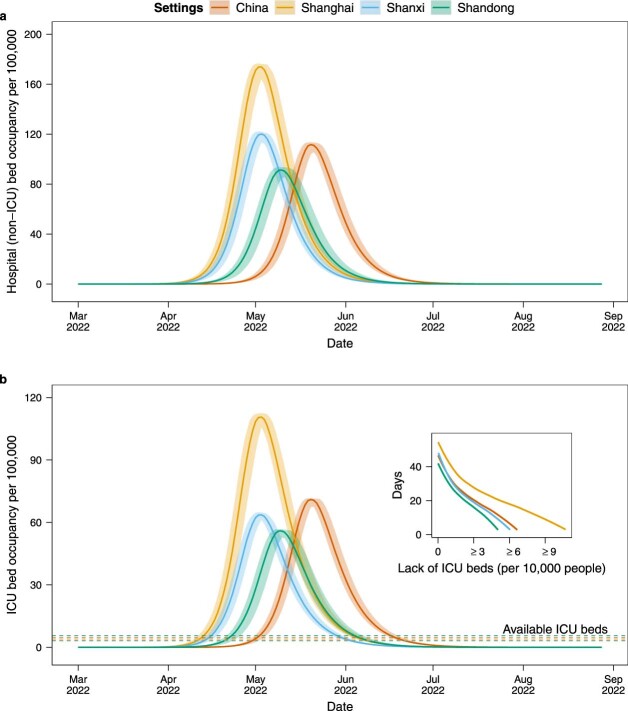
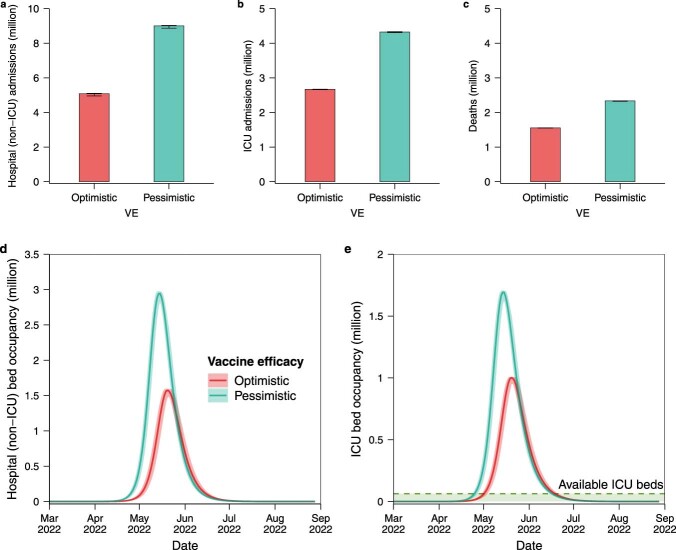
Having adopted a dynamic zero-COVID strategy to respond to SARS-CoV-2 variants with higher transmissibility since August 2021, China is now considering whether, and for how long, this policy can remain in place. The debate has thus shifted towards the identification of mitigation strategies for minimizing disruption to the healthcare system in the case of a nationwide epidemic. To this aim, we developed an age-structured stochastic compartmental susceptible-latent-infectious-removed-susceptible model of SARS-CoV-2 transmission calibrated on the initial growth phase for the 2022 Omicron outbreak in Shanghai, to project COVID-19 burden (that is, number of cases, patients requiring hospitalization and intensive care, and deaths) under hypothetical mitigation scenarios. The model also considers age-specific vaccine coverage data, vaccine efficacy against different clinical endpoints, waning of immunity, different antiviral therapies and nonpharmaceutical interventions. We find that the level of immunity induced by the March 2022 vaccination campaign would be insufficient to prevent an Omicron wave that would result in exceeding critical care capacity with a projected intensive care unit peak demand of 15.6 times the existing capacity and causing approximately 1.55 million deaths. However, we also estimate that protecting vulnerable individuals by ensuring accessibility to vaccines and antiviral therapies, and maintaining implementation of nonpharmaceutical interventions could be sufficient to prevent overwhelming the healthcare system, suggesting that these factors should be points of emphasis in future mitigation policies.


Conflict of interest statement

H.Y. received research funding from Sanofi Pasteur, GlaxoSmithKline, Yichang HEC Changjiang Pharmaceutical Company, Shanghai Roche Pharmaceutical Company and SINOVAC Biotech Ltd. Except for research funding from SINOVAC Biotech Ltd, which is related to the data analysis of clinical trials of immunogenicity and safety of CoronaVac, the others are not related to COVID-19. M.A. has received research funding from Seqirus; the funding is not related to COVID-19. All the other authors have no competing interests.

Figures

Fig. 1
Fig. 1. Projected SARS-CoV-2 Omicron burden in China for baseline scenario from March 2022 to September 2022.
a, Daily hospital (non-ICU) admissions per 10,000 individuals. b, Epidemiological status of hospitalized (non-ICU) patients. c, Age distribution of hospitalized (non-ICU) patients. d, Distribution of hospitalized (non-ICU) patients per 10,000 by age group and epidemiological status. e, Daily ICU admissions per 10,000 individuals. f, Epidemiological status of ICU patients. g, Age distribution of ICU patients. h, Distribution of ICU patients per 10,000 by age group and epidemiological status. i, Daily deaths per 10,000 individuals. j, Epidemiological status of deaths. k, Age distribution of deaths. l, Distribution of deaths per 10,000 by age group and epidemiological status. In panels b, f and j, susceptible refers to individuals who do not receive COVID-19 vaccines; primary refers to those individuals who have received at least one dose of COVID-19 vaccine, considering a primary vaccination which entails a two-dose schedule; booster refers to those individuals who have received a third dose; recovery refers to individuals who have recovered from SARS-CoV-2 Omicron infection. Data are presented as median with 2.5% and 97.5% quantiles of n = 200 simulations.
Fig. 2
Fig. 2. Age-specific and overall incidence rates of different clinical outcomes across four settings (China, Shanghai, Shanxi and Shandong) under the baseline scenario from March 2022 to September 2022.
a, Cumulative hospital (non-ICU) admissions per 1,000 individuals. b, Cumulative ICU admissions per 1,000 individuals. c, Cumulative deaths per 1,000 individuals. China represents the ‘national average’. Number denotes median, and error bars denote 2.5% and 97.5% quantiles of n = 200 simulations.
Fig. 3
Fig. 3. Projected demand and shortage of hospital beds and ICUs when adopting individual mitigation strategies in China under optimistic VE scenario from March 2022 to September 2022.
a, Daily demand of hospital (non-ICU) beds. b, Daily demand of ICU beds. In b, the green dashed line indicates the number of ICU beds available in China, and the inset plot shows days of shortage of ICU beds as a function of the number of insufficient ICU beds compared with the capacity of ICU beds. The curves in the inset are smoothed by B-spline with 8 d.f. The scenarios included in legend are as follows: subunit vaccines refer to using a third dose of subunit vaccines as booster after two doses of inactivated vaccines as priming. Vaccinating elderly refers to vaccinating approximately 52 million people aged ≥60 years who have not yet been vaccinated as of 17 March 2022. 50% uptake and 80% efficacy corresponds to a scenario where 50% of symptomatic cases receive an antiviral therapy with an efficacy of 80% in preventing hospitalization and death. 100% uptake and 89% efficacy corresponds to a scenario where all symptomatic cases receive an antiviral therapy with an efficacy of 89% in preventing hospitalization and death. School and workplace closure corresponds to a scenario where, on the top of baseline strategy, all schools and workplaces remain closed for the duration of the epidemic. Rt: 3.0 and 2.0 correspond to scenarios assuming different levels of NPIs leading to reduced values of the reproduction number. Note that no strict NPI is implemented in the baseline scenario. Data are presented as median with 2.5% and 97.5% quantiles of n = 200 simulations.
Fig. 4
Fig. 4. Projected impact of adopting individual mitigation strategies on COVID-19 burden in China under optimistic VE scenario from March 2022 to September 2022.
a, Cumulative number of hospital (non-ICU) admissions. b, Cumulative number of ICU admissions. c, Cumulative number of deaths. The scenarios indicated on the y axis are as follows: subunit vaccines refer to using a third dose of subunit vaccines as booster after two doses of inactivated vaccines as priming. Vaccinating elderly refers to vaccinating approximately 52 million people aged ≥60 years have not been vaccinated yet as of 17 March 2022. 50% uptake and 80% efficacy corresponds to a scenario where 50% of symptomatic cases receive an antiviral therapy with an efficacy of 80% in preventing hospitalization and death. 100% uptake and 89% efficacy corresponds to a scenario where all symptomatic cases receive an antiviral therapy with an efficacy of 89% in preventing hospitalization and death. School closure corresponds to a scenario where, on the top of baseline strategy, all schools remain closed for the duration of the epidemic. Similarly, school and workplace closure corresponds to a scenario, where on the top of baseline strategy, all schools and workplaces remain closed for the duration of the epidemic. Rt: 3.0, 2.5 and 2.0 correspond to scenarios assuming different levels of NPIs leading to reduced values of the reproduction number. Note that no strict NPI is implemented in the baseline scenario. Data are presented as median with 2.5% and 97.5% quantiles of n = 200 simulations.
Fig. 5
Fig. 5. Projected healthcare demand and number of deaths for combined mitigation strategies under optimistic VE scenario in China from March 2022 to September 2022.
a, Peak hospital (non-ICU) bed occupancy, with red numbers indicating where peak hospital bed demand is lower than the bed capacity for respiratory illness in China. b, Peak ICU bed occupancy, with red numbers indicating where peak ICU bed demand is below the existing ICU capacity in China. c, Cumulative death tolls, with red numbers indicating where the number of deaths is below the annual influenza-related excess death toll in China (that is, 88,000 deaths). The circular-Manhattan plot from the innermost concentric circle to the outermost concentric circle indicates the combinations of adopting different intervention measures: homologous (inactivated) or heterologous (subunit) booster regimen; whether the approximately 52 million people aged ≥60 years who have not been vaccinated yet as of 17 March 2022 are vaccinated or not; receiving antiviral therapies with an efficacy of 80% or 89% in preventing hospitalization and death; 50% or 100% symptomatic cases receiving an antiviral therapy; Rt representing varying intensity of NPIs. Rt = 3.9 corresponds to the scenario in the absence of strict NPIs. Data are presented as median of n = 200 simulations.
Extended Data Fig. 1
Extended Data Fig. 1. Model structure flow diagram with transition rates between states.
a, Overview of extended SEIR transmission model. b, Diagram of hospitalization provided symptomatic infections. c, Diagram of antiviral therapies provided symptomatic infections. d, Diagram of vaccination and waning immunity. Note that the complex infection dynamic as shown in a has been encapsulated within a single pink box. All states and parameters are defined in Supplementary Tables 3 and 4.
Extended Data Fig. 2
Extended Data Fig. 2. Comparisons between the observed epidemic curves in Shanghai and model output.
a, Confirmed infections. b, Symptomatic infections. All data are presented as median with 2.5% and 97.5% quantiles of n=200 simulations.
Extended Data Fig. 3
Extended Data Fig. 3. Projected demand and shortage of hospital beds and ICUs for baseline scenario across four settings from March 2022 to September 2022.
a, Daily demand of hospital (non-ICU) beds per 100,000. b, Daily demand of ICU beds per 100,000. In b, the dashed lines indicate the existing number of ICU beds per 100,000 in four settings, and the inset plot shows days of shortage of ICU beds as a function of the number of insufficient ICU beds compared with the capacity of ICU beds in each setting. The curves in the inset are smoothed by B-spline with 8 d.f. China represents the ‘national average’. All data are presented as median with 2.5% and 97.5% quantiles of n=200 simulations.
Extended Data Fig. 4
Extended Data Fig. 4. Projected COVID-19 burden and demands in hospital and ICU beds in China under pessimistic VE scenario compared to the baseline scenario (optimistic VE) from March 2022 to September 2022.
a, Cumulative hospital (non-ICU) admissions. b, Cumulative ICU admissions. c, Cumulative deaths. d, Daily demand in hospital (non-ICU) beds. e, Daily demand in ICU beds. In e, the green dashed line indicates the number of ICU beds available in China. All data are presented as median with 2.5% and 97.5% quantiles of n=200 simulations.
Extended Data Fig. 5
Extended Data Fig. 5. Projected impact of adopting individual mitigation strategies on COVID-19 burden in China under pessimistic VE scenario from March 2022 to September 2022.
a, Cumulative number of hospital (non-ICU) admissions. b, Cumulative number of ICU admissions. c, Cumulative number of deaths. The scenarios indicated on y axis are as follows: subunit vaccines refer to using a third dose of subunit vaccines as booster after two doses of inactivated vaccines as priming. Vaccinating elderly refers to vaccinating approximately 52 million people aged ≥60 years who have not been vaccinated yet as of March 17, 2022. 50% uptake and 80% efficacy corresponds to a scenario where 50% of symptomatic cases receive an antiviral therapy with an efficacy of 80% in preventing hospitalization and death. 100% uptake and 89% efficacy corresponds to a scenario where all symptomatic cases receive an antiviral therapy with an efficacy of 89% in preventing hospitalization and death. School closure corresponds to a scenario where, on the top of baseline strategy, all schools remain closed for the duration of the epidemic. Similarly, school and workplace closure corresponds to a scenario, where on the top of baseline strategy, all schools and workplaces remain closed for the duration of the epidemic. Rt: 3.0, 2.5, and 2.0 correspond to scenarios assuming different levels of NPIs leading to reduced values of the reproduction number. Note that no strict NPIs is implemented in the baseline scenario. All data are presented as median with 2.5% and 97.5% quantiles of n=200 simulations.

Comment in

References

    1. Viana R. Rapid epidemic expansion of the SARS-CoV-2 Omicron variant in southern Africa. Nature. 2022;603:679–686. - PMC - PubMed
    1. Tracking of VOC Omicron. Global Initiative of Sharing All Influenza Data (GISAID) (29 January 2022); https://www.gisaid.org/hcov19-variants/
    1. Lyngse, F.P. SARS-CoV-2 Omicron VOC transmission in Danish households. Preprint at medRXiv10.1101/2021.12.27.21268278 (2021).
    1. Pearson, C.A.B. et al. Bounding the levels of transmissibility & immune evasion of the Omicron variant in South Africa. Preprint at medRxiv10.1101/2021.12.19.21268038 (2021).
    1. Gozzi, N. et al. Preliminary modeling estimates of the relative transmissibility and immune escape of the Omicron SARS-CoV-2 variant of concern in South Africa. Preprint at medRxiv10.1101/2022.01.04.22268721 (2022).

Publication types

Substances

Supplementary concepts