

Adaptations of the 3T3-L1 adipocyte lipidome to defective ether lipid catabolism upon Agmo knockdown
- PMID: 35537527
- PMCID: PMC9192799
- DOI: 10.1016/j.jlr.2022.100222
Adaptations of the 3T3-L1 adipocyte lipidome to defective ether lipid catabolism upon Agmo knockdown
Abstract
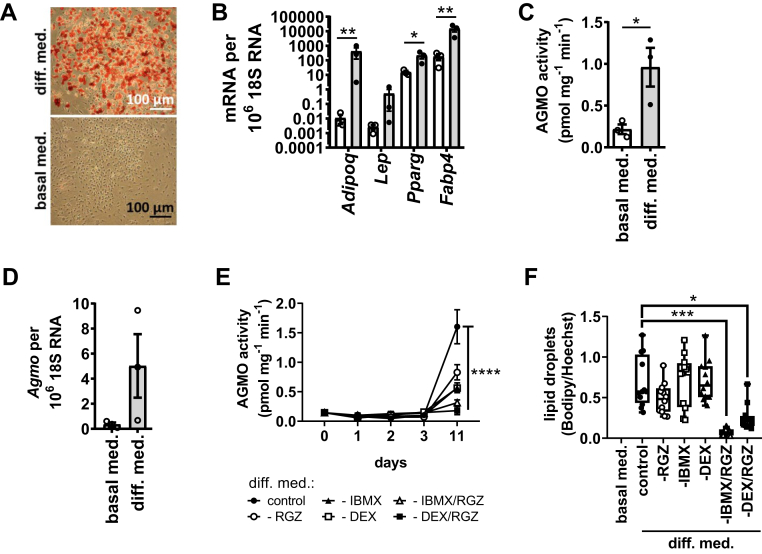
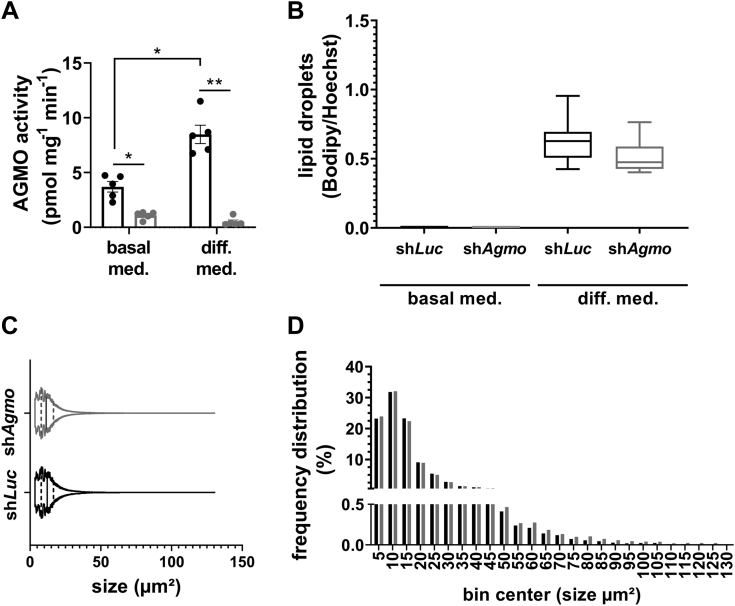
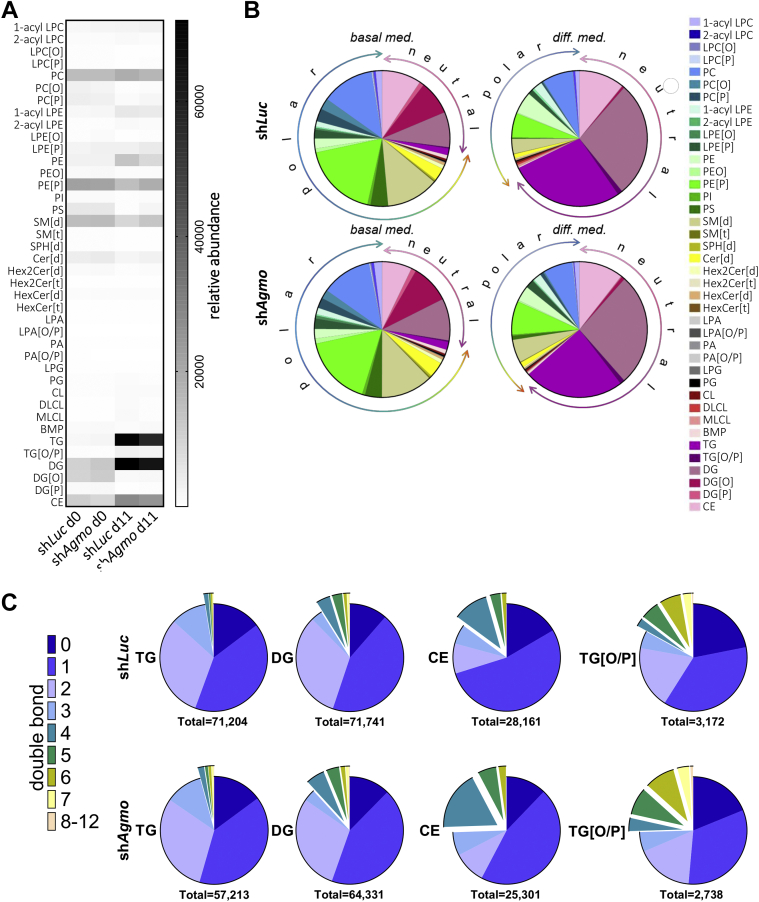
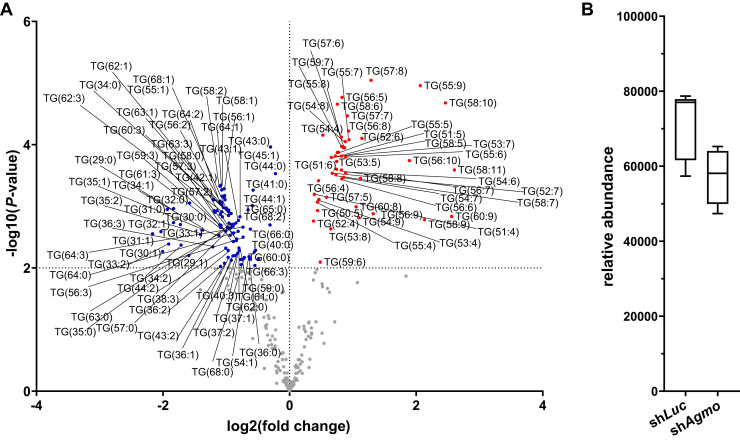
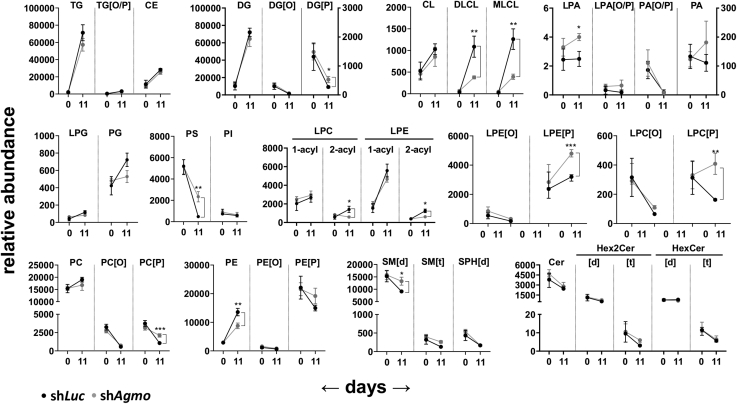
Little is known about the physiological role of alkylglycerol monooxygenase (AGMO), the only enzyme capable of cleaving the 1-O-alkyl ether bond of ether lipids. Expression and enzymatic activity of this enzyme can be detected in a variety of tissues including adipose tissue. This labile lipolytic membrane-bound protein uses tetrahydrobiopterin as a cofactor, and mice with reduced tetrahydrobiopterin levels have alterations in body fat distribution and blood lipid concentrations. In addition, manipulation of AGMO in macrophages led to significant changes in the cellular lipidome, and alkylglycerolipids, the preferred substrates of AGMO, were shown to accumulate in mature adipocytes. Here, we investigated the roles of AGMO in lipid metabolism by studying 3T3-L1 adipogenesis. AGMO activity was induced over 11 days using an adipocyte differentiation protocol. We show that RNA interference-mediated knockdown of AGMO did not interfere with adipocyte differentiation or affect lipid droplet formation. Furthermore, lipidomics revealed that plasmalogen phospholipids were preferentially accumulated upon Agmo knockdown, and a significant shift toward longer and more polyunsaturated acyl side chains of diacylglycerols and triacylglycerols could be detected by mass spectrometry. Our results indicate that alkylglycerol catabolism has an influence not only on ether-linked species but also on the degree of unsaturation in the massive amounts of triacylglycerols formed during in vitro 3T3-L1 adipocyte differentiation.
Keywords: 3T3-L1; adipocyte differentiation; adipocytes; alkylglycerol monooxygenase; ether lipids; lipid metabolism; lipidomics; lipids; lipolysis and fatty acid metabolism; triacylglycerol.
Copyright © 2022 The Authors. Published by Elsevier Inc. All rights reserved.
Conflict of interest statement
Conflict of interest The authors declare that they have no conflicts of interest with the contents of this article.
Figures
Similar articles
-
AGMO Inhibitor Reduces 3T3-L1 Adipogenesis.Cells. 2021 May 1;10(5):1081. doi: 10.3390/cells10051081. Cells. 2021. PMID: 34062826 Free PMC article.
-
Alterations in ether lipid metabolism and the consequences for the mouse lipidome.Biochim Biophys Acta Mol Cell Biol Lipids. 2023 Apr;1868(4):159285. doi: 10.1016/j.bbalip.2023.159285. Epub 2023 Jan 21. Biochim Biophys Acta Mol Cell Biol Lipids. 2023. PMID: 36690320
-
Lipodisqs for eukaryote lipidomics with retention of viability: Sensitivity and resistance to Leucobacter infection linked to C.elegans cuticle composition.Chem Phys Lipids. 2019 Aug;222:51-58. doi: 10.1016/j.chemphyslip.2019.02.005. Epub 2019 May 15. Chem Phys Lipids. 2019. PMID: 31102583
-
The Emerging Physiological Role of AGMO 10 Years after Its Gene Identification.Life (Basel). 2021 Jan 26;11(2):88. doi: 10.3390/life11020088. Life (Basel). 2021. PMID: 33530536 Free PMC article. Review.
-
Alkylglycerol monooxygenase.IUBMB Life. 2013 Apr;65(4):366-72. doi: 10.1002/iub.1143. Epub 2013 Feb 25. IUBMB Life. 2013. PMID: 23441072 Free PMC article. Review.
Cited by
-
Platelet-Activating Factor-Induced Inflammation in Obesity: A Two-Sided Coin of Protection and Risk.Cells. 2025 Mar 21;14(7):471. doi: 10.3390/cells14070471. Cells. 2025. PMID: 40214425 Free PMC article. Review.
-
Transcriptome in Liver of Periparturient Dairy Cows Differs between Supplementation of Rumen-Protected Niacin and Rumen-Protected Nicotinamide.Metabolites. 2024 Mar 1;14(3):150. doi: 10.3390/metabo14030150. Metabolites. 2024. PMID: 38535310 Free PMC article.
-
Genome-Wide Association Study for Individual Primal Cut Quality Traits in Canadian Commercial Crossbred Pigs.Animals (Basel). 2025 Jun 13;15(12):1754. doi: 10.3390/ani15121754. Animals (Basel). 2025. PMID: 40564306 Free PMC article.
References
-
- Gorgas K., Teigler A., Komljenovic D., Just W.W. The ether lipid-deficient mouse: tracking down plasmalogen functions. Biochim. Biophys. Acta. 2006;1763:1511–1526. - PubMed
-
- Magnusson C.D., Haraldsson G.G. Ether lipids. Chem. Phys. Lipids. 2011;164:315–340. - PubMed
-
- Warne T.R., Buchanan F.G., Robinson M. Growth-dependent accumulation of monoalkylglycerol in Madin-Darby canine kidney cells. Evidence for a role in the regulation of protein kinase C. J. Biol. Chem. 1995;270:11147–11154. - PubMed
-
- Daniel L.W., Small G.W., Schmitt J.D., Marasco C.J., Ishaq K., Piantadosi C. Alkyl-linked diglycerides inhibit protein kinase C activation by diacylglycerols. Biochem. Biophys. Res. Commun. 1988;151:291–297. - PubMed
Publication types
MeSH terms
Substances
Grants and funding
LinkOut - more resources
Full Text Sources
Molecular Biology Databases
Miscellaneous
