. 2022 Jun;63(6):100223.
doi: 10.1016/j.jlr.2022.100223. Epub 2022 May 7.

Isomeric lipid signatures reveal compartmentalized fatty acid metabolism in cancer

Affiliations

Isomeric lipid signatures reveal compartmentalized fatty acid metabolism in cancer

Reuben S E Young et al. J Lipid Res. 2022 Jun.

Abstract

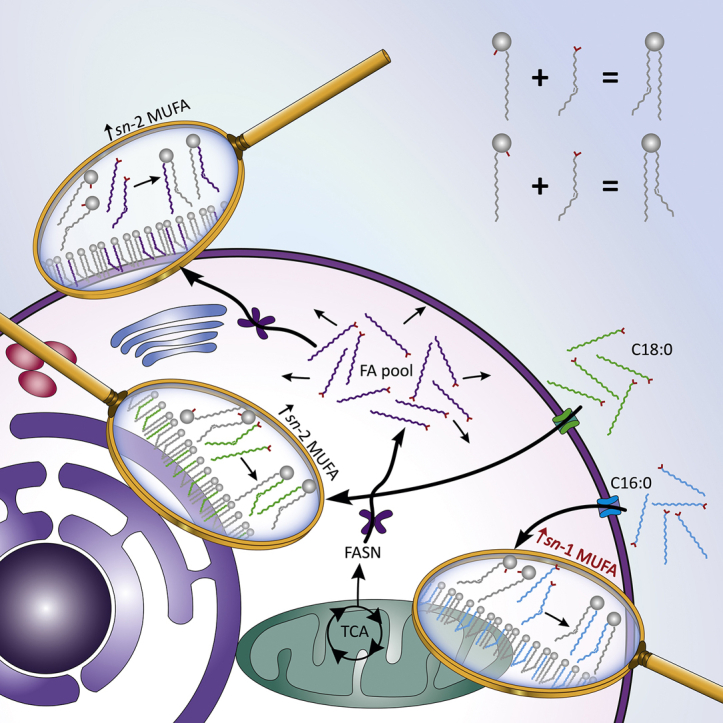
The cellular energy and biomass demands of cancer drive a complex dynamic between uptake of extracellular FAs and their de novo synthesis. Given that oxidation of de novo synthesized FAs for energy would result in net-energy loss, there is an implication that FAs from these two sources must have distinct metabolic fates; however, hitherto, all FAs have been considered part of a common pool. To probe potential metabolic partitioning of cellular FAs, cancer cells were supplemented with stable isotope-labeled FAs. Structural analysis of the resulting glycerophospholipids revealed that labeled FAs from uptake were largely incorporated to canonical (sn-) positions on the glycerol backbone. Surprisingly, labeled FA uptake also disrupted canonical isomer patterns of the unlabeled lipidome and induced repartitioning of n-3 and n-6 PUFAs into glycerophospholipid classes. These structural changes support the existence of differences in the metabolic fates of FAs derived from uptake or de novo sources and demonstrate unique signaling and remodeling behaviors usually hidden from conventional lipidomics.

Keywords: FA/transport; imaging MS; lipase; lipid isomers; lipolysis and FA metabolism; ozone-induced dissociation; phospholipid/metabolism; phospholipids/phosphatidylcholine; stable-isotope tracing.


Conflict of interest statement

Conflict of interest S. J. B. holds patents on ozone-induced dissociation technology (A method for the determination of the position of unsaturation in a compound, US8242439 and US7771943). All other authors declare that they have no conflicts of interest with the contents of this article.

Figures

None
Graphical abstract
Fig. 1
Fig. 1
The abundance of GPL classes and PC sum compositions (including label-incorporated species) arising from 12PA, 13PA, and 13SA supplementation. Left: GPL sum compositions summed by class and separated by dn-lipidome (blue) and up-lipidome (yellow) abundances; represented in (A) absolute abundance (nmol/1 M cells) and (B) relative abundance (mol%). Right: The effects of supplementation on the top 15 most abundant PC lipids; represented in (C) absolute abundance (nmol/1 M cells), and (D) relative abundance (mol%). Biological replicates: n = 2 (NS: n = 3) and technical replicates: n = 7, mean ± 95% confidence interval displayed. Paired t-test P values: ∗0.05, ∗∗0.01, and ∗∗∗0.001. 12C16-PA supplement (12PA), 13C16-PA supplement (13PA), 13C18-SA supplement (13SA).
Fig. 2
Fig. 2
The distribution of DB and sn-isomers within the dn-lipidomes and up-lipidomes after FA supplementation. A: Bar charts showing the FA sn-isomer distribution of two de novo PC 32:1 FA compositional isomers, namely, PC 16:0_16:1 (oranges) and PC 14:0_18:1 (grays) and the pie charts showing the distribution of DB isomers within these two lipid species. B: Proportions of PC 32:1 apocromer (black) and canonomer (cream) for each cell supplement—representations of the chemical structure for each are found topmid. C: Bar charts showing the sn-isomer distribution of two uptake PC 32:1 lipid species, namely, PC 16:0_16:1 (oranges) and PC 14:0_18:1 (grays). D: Labeled PC 32:1 lipid displayed in C can either have the labeled FA unmodified or modified by desaturation and/or β-oxidation (chemical structures represented bottom-mid). The proportions of apocromer (black) and canonomer (white) are compared between these unique isomers and isotopomers with the labeled FA chain being indicated with an asterisk. Pie charts in (D) are representative of the DB isomer distribution from the unsaturated FA chain. The values displayed throughout are the relative abundance mean for biological replicates: n = 2 (NS: n = 3) and technical replicates: n = 7. FA supplements are indicated below each chart (+), and isotope labeling is indicated in blue with a double dagger (ⱡ).
Fig. 3
Fig. 3
Simultaneous elucidation of fatty acyl composition, sn-isomeric position, and DB locations for the full structural elucidation of PC 32:1 within LNCaP cells. Bar charts showing the sn-isomeric distribution (apocromeric in light and canonomeric in dark colors), for each of three DB positions (n-7: purple, n-9: red, and n-10: green) across the two fatty acyl compositional isomers (PC 16:0_16:1, PC 14:0_18:1) within the PC 32:1 species. The 12 molecular structures for each of the measured species are located either side of the chart. n = 3, mean value ± SEM (95% confidence interval).
Fig. 4
Fig. 4
The effects of FA supplementation on the degree of unsaturation of GPL species. Left: Bar charts showing the degree of unsaturation in PSs in either absolute (A) or relative (B) abundance scales. Degree of unsaturation has been separated into SFA (blue), MUFA (orange), polyunsaturated with two or three DBs (PUFA ≤3, green), or polyunsaturated with four or five DBs (PUFA ≥4, yellow). C: Heatmap showing the influence of 13PA or 13SA FA supplementation on either the labeled/up-lipidomes or unlabeled/dn-lipidomes relative to the lipidome arising from 12PA supplementation. Sum composition species are indicated across five GPL classes. Biological replicates: n = 2 and technical replicates: n = 7, mean value displayed for absolute abundance or mean value ± 95% confidence interval displayed for relative abundance.
Fig. 5
Fig. 5
MALDI-MSI and MALDI-MSI-OzID molecular imaging of lipids and the H&E stain of resected LNCaP xenograft tissues. A–F: The abundance and spatial distribution of (A) PC 32:0, (B) PC 34:1, (C) PC 36:1, (D) lyso-PC (LPC) 18:0, (E) PC 38:4, and (F) PC 40:6. G–I: Tissue FDIs expressing the relative abundance of the indicated lipid(s) as a function of both lipids for (G) (PC 38:4 + PC 40:6)/PC 34:1, (H) (PC 18:1/16:0)/PC 16:0/18:1, and (I) (TAG [48:0, 48:1, 48:2, 50:0, 50:1, 50:2, 50:3, 50:4, 52:0, 52:1, 52:2, 52:3, 52:4, 52:5, 52:6, 54:1, 54:2, 54:3, 54:4, 54:5, and 54:6])/PC 34:1. J: The H&E-stained tissue showing the tumor cells (red) and host adipocyte cells (black) in a representative treatment-naïve (vehicle) LNCaP xenograft.

Similar articles

Cited by

References

    1. Jackson Catherine L., Walch L., Verbavatz J.-M. Lipids and their trafficking: an integral part of cellular organization. Dev. Cell. 2016;39:139–153. - PubMed
    1. Kennedy E.P., Weiss S.B. The function of cytidine coenzymes in the biosynthesis of phospholipides. J. Biol. Chem. 1956;222:193–214. - PubMed
    1. Lands W.E.M. Stories about acylchains. BBA-Mol. Cell Biol. L. 2000;1483:1–14. - PubMed
    1. Koundouros N., Poulogiannis G. Reprogramming of fatty acid metabolism in cancer. Br. J. Cancer. 2020;122:4–22. - PMC - PubMed
    1. Hosios Aaron M., Hecht Vivian C., Danai Laura V., Johnson Marc O., Rathmell Jeffrey C., Steinhauser Matthew L., et al. Amino acids rather than glucose account for the majority of cell mass in proliferating mammalian cells. Dev. Cell. 2016;36:540–549. - PMC - PubMed

Publication types