. 2022 Jul:214:102286.
doi: 10.1016/j.pneurobio.2022.102286. Epub 2022 May 12.

Pathway-specific inhibition of critical projections from the mediodorsal thalamus to the frontal cortex controls kindled seizures

Affiliations

Pathway-specific inhibition of critical projections from the mediodorsal thalamus to the frontal cortex controls kindled seizures

Evan Wicker et al. Prog Neurobiol. 2022 Jul.

Abstract

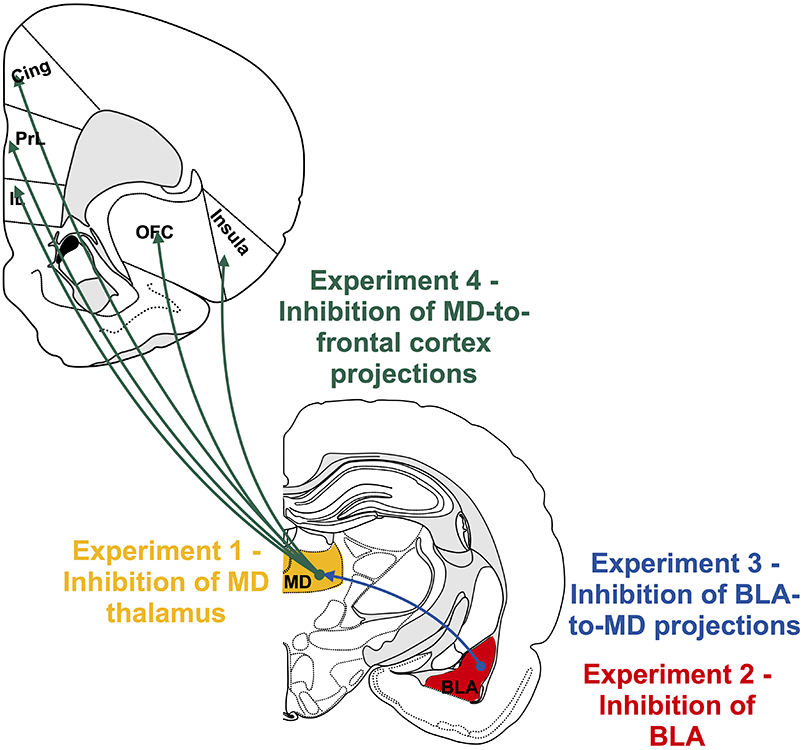
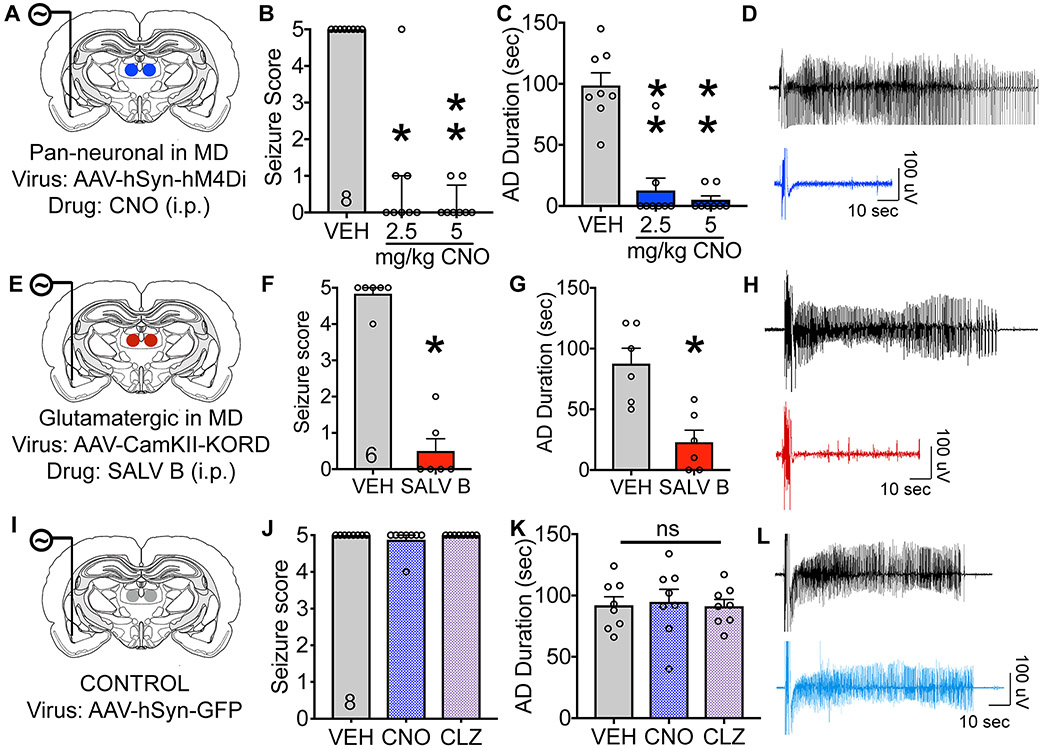
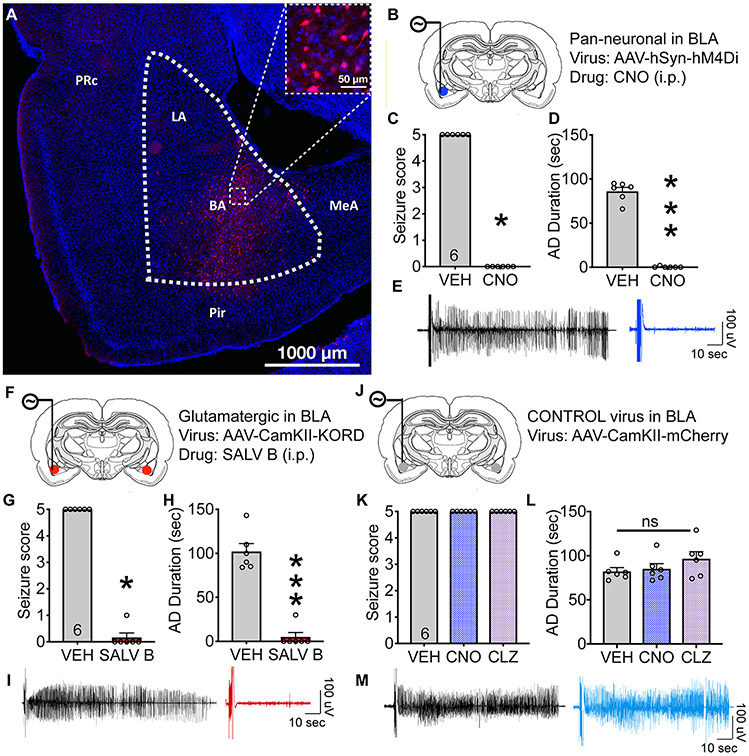
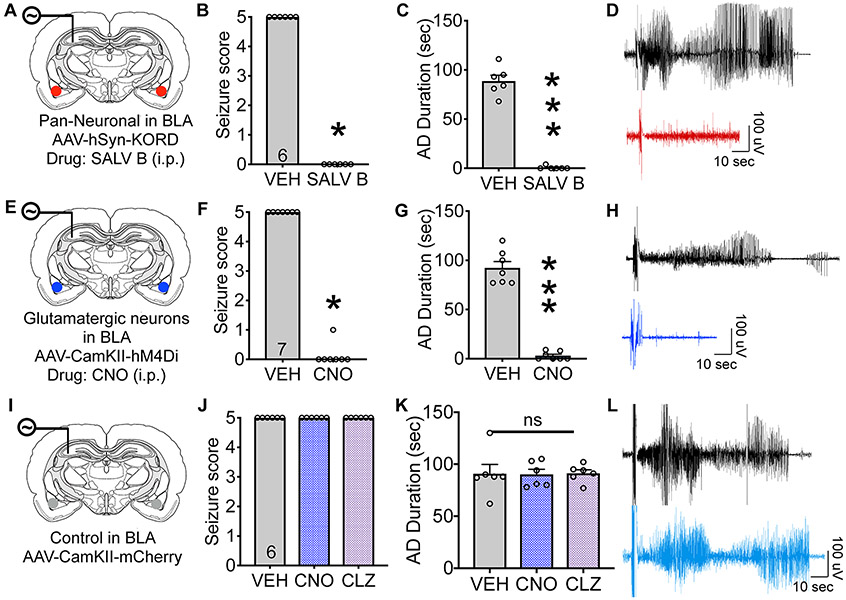
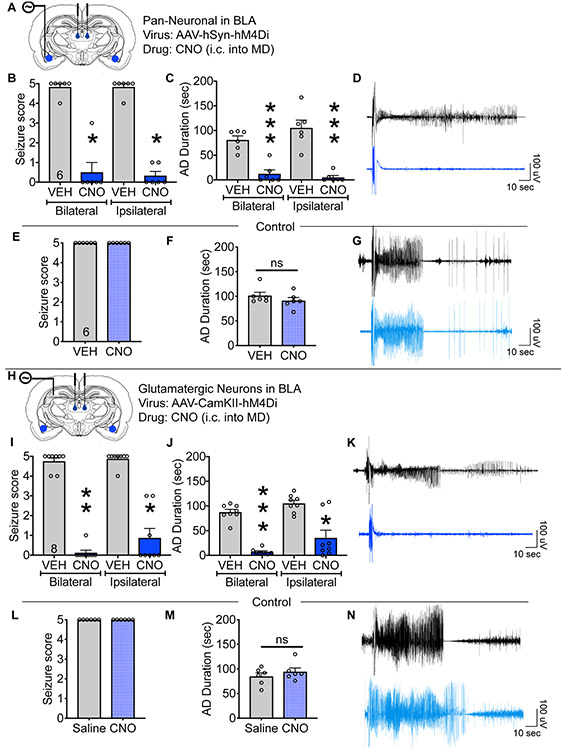
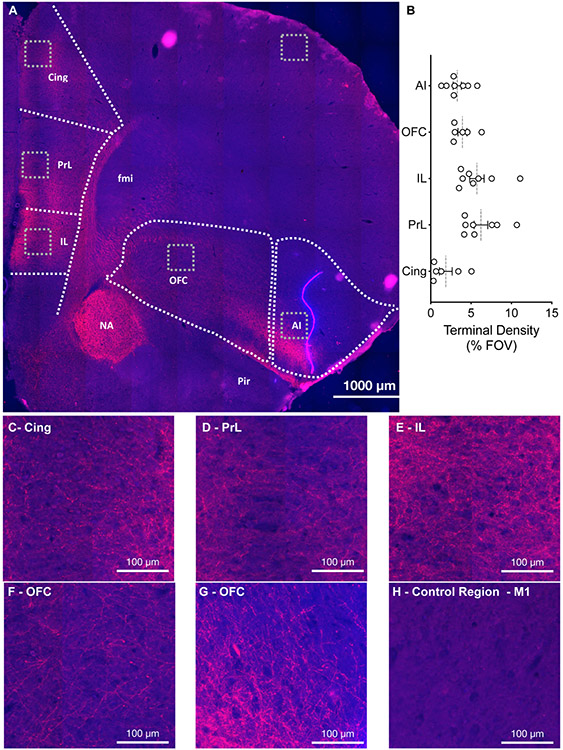
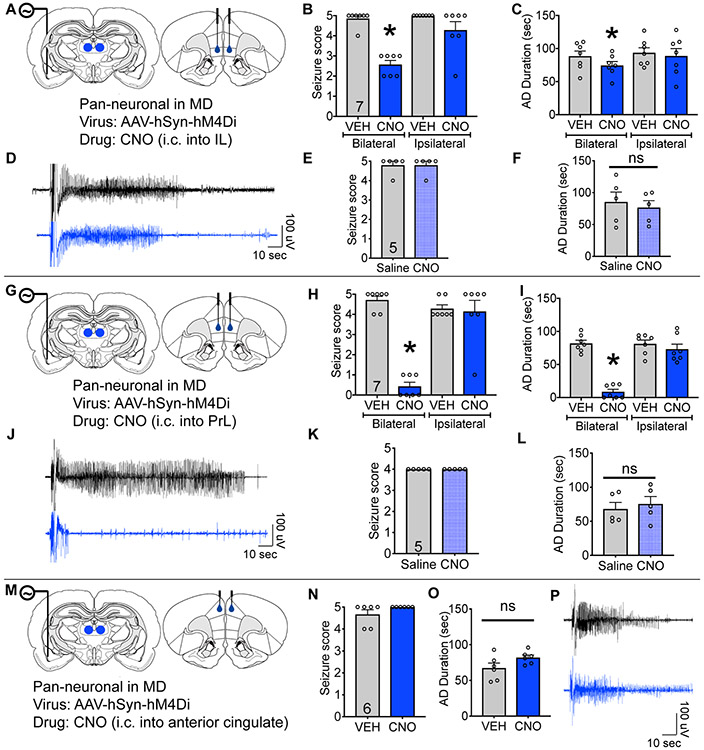
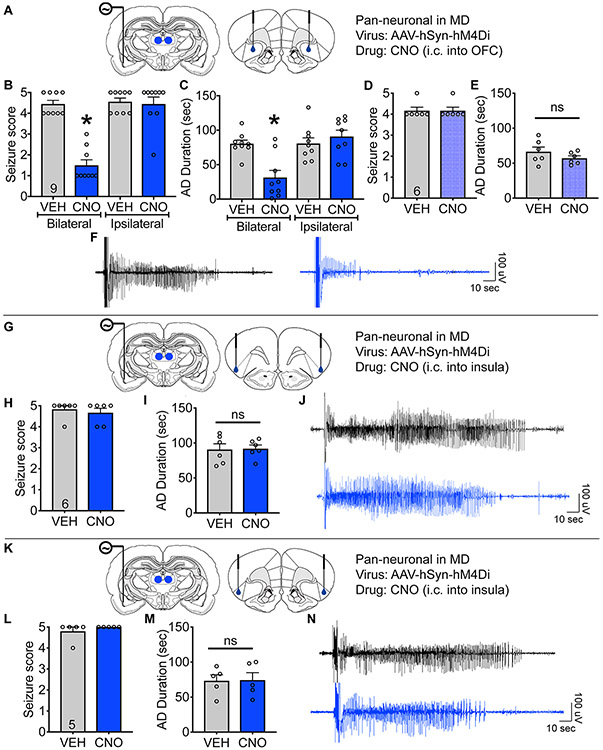
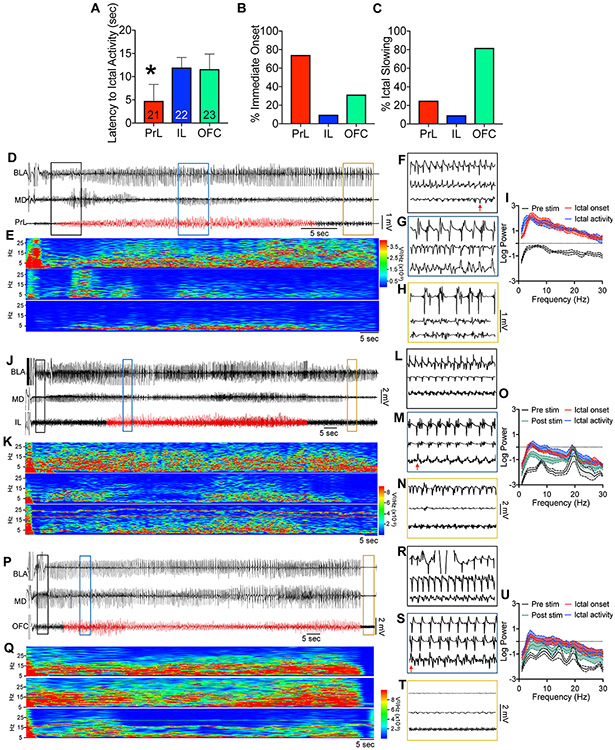
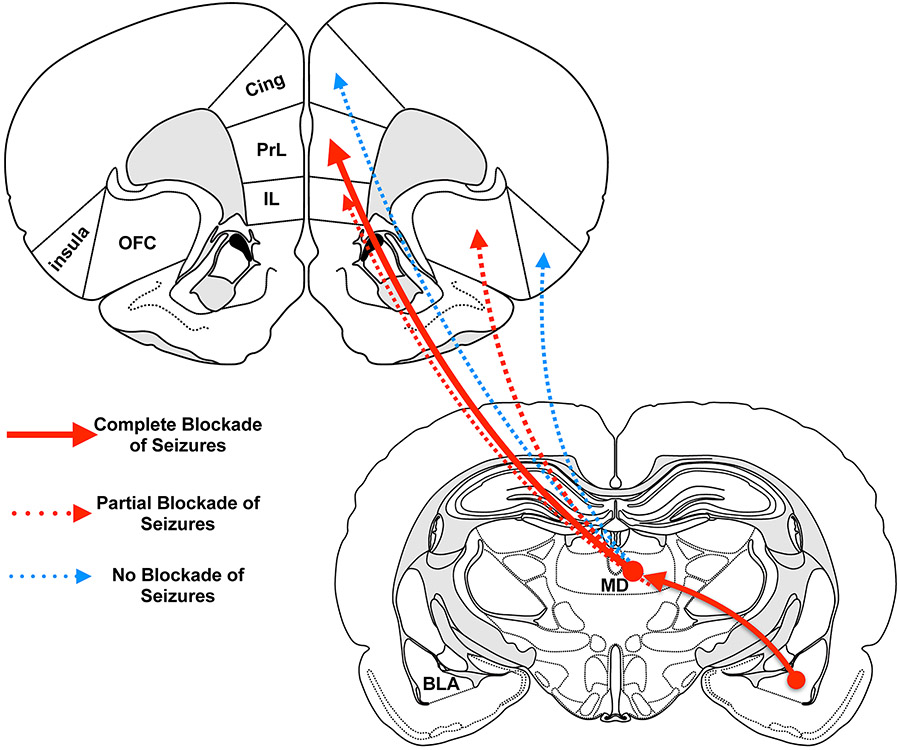
There is a large unmet need for improved treatment for temporal lobe epilepsy (TLE); circuit-specific manipulation that disrupts the initiation and propagation of seizures is promising in this regard. The midline thalamus, including the mediodorsal nucleus (MD) is a critical distributor of seizure activity, but its afferent and efferent pathways that mediate seizure activity are unknown. Here, we used chemogenetics to silence input and output projections of the MD to discrete regions of the frontal cortex in the kindling model of TLE in rats. Chemogenetic inhibition of the projection from the amygdala to the MD abolished seizures, an effect that was replicated using optogenetic inhibition. Chemogenetic inhibition of projections from the MD to the prelimbic cortex likewise abolished seizures. By contrast, inhibition of projections from the MD to other frontal regions produced partial (orbitofrontal cortex, infralimbic cortex) or no (cingulate, insular cortex) attenuation of behavioral or electrographic seizure activity. These results highlight the particular importance of projections from MD to prelimbic cortex in the propagation of amygdala-kindled seizures.

Keywords: Amygdala; Chemogenetics; Deep brain stimulation; Epilepsy; Frontal cortex; Hippocampus; Kindling; Optogenetics; Temporal lobe epilepsy; Thalamus.


Figures

Figure 1:
Figure 1:. Schematic Illustrating Experimental Targets.
Filled regions (MD and BLA) were the targets for Experiments 1 and 2, respectively. Arrows indicate the pathways (BLA to MD; MD to frontal cortex) that were the targets of Experiments 3 and 4, respectively. Cing = cingulate cortex, PrL = prelimbic cortex, IL = infralimbic cortex, OFC = orbitofrontal cortex, insula = insular cortex, MD = mediodorsal thalamus, BLA = basolateral amygdala.
Figure 2:
Figure 2:. Histological verification of viral placement.
A representative injection centered on the MD from one rat is shown in Figure 2A and B; the animal in this case was one of three used exclusively for histology (in Fig 6) and is the same case shown in Figure 6. The animal was injected with rAAV8-hSyn-hM4Di(Gi)-mCherry into the MD as described above. Viral expression in (A) the midline thalamus, centered on the mediodorsal nucleus. (B) view of cell bodies (marked by arrows) in. the MD, PV, and IMD. Expanded view shows the same region outlined by the square in (A). (C). Heat map showing the percent of cases from Table 1 with even minimal expression in each of the midline thalamic nuclei. CM = centromedian nucleus, CL = centrolateral nucleus, H = habenula, LD = Laterodorsal, MDC = mediodorsal nucleus, central division, MDL = mediodorsal nucleus, lateral division, MDM = mediodorsal nucleus, medial division, IMD = intramediodorsal nucleus, PV = paraventricular nucleus. Darker shades of red indicate a higher percentage of cases. In the images the red channel = mCherry and blue channel = DAPI.
Figure 3:
Figure 3:. Chemogenetic inhibition of the MD attenuates amygdala-kindled seizures.
(A) Schematic representation of the experimental approach to pan-neuronal silencing within the MD. CNO administration (2.5 or 5 mg/kg, ip) significantly reduces (B) behavioral seizure score as compared, within-subject, to a vehicle (VEH)-treated session (Friedman’s test, X2=13.15, p=0.0007;5 mg/kg; Dunn’s, p=0.0081; 2.5 mg/kg; Dunn’s, p=0.0260). (C) CNO administration also suppresses electrographic seizure duration (afterdischarge [AD] duration; ANOVA, F(1.228,8.598)=28.58, p=0.0004; 5 mg/kg - Holm-Sidak, p=0.0001; 2.5 mg/kg - Holm-Sidak, p=0.0046). (D) Representative EEG recording from the amygdala during a vehicle-treated (black) and CNO-treated (blue) session. (E) Schematic representation of experimental approach to silencing glutamatergic neurons in the MD. SALV B (15 mg/kg, ip) significantly reduced (F) behavioral seizure severity (Wilcoxon sign-rank test, p=0.0312) and (G) afterdischarge duration as compared, within-subject to vehicle-treated sessions (paired t-test, df=5, p=0.0129). (H) representative EEG recordings from the amygdala during a vehicle-treated (black) and SALV B-treated (red) session. In DREADD-negative animals (schematic in (I)), CNO is without effect on (J) seizure severity (Friedman, X2=2.000, p>0.9999) or (K) AD duration (ANOVA, F(1.264, 8.849)=0.2642, p=0.6739). (L) representative electrographic recording during a VEH (black) and CNO (light blue) treated session in a DREADD-negative rat. Bars show mean + SEM, *=p<0.05, **=p<0.01.
Figure 4:
Figure 4:. Chemogenetic inhibition of the BLA attenuates amygdala-kindled seizures.
(A) Representative photomicrograph showing virual expression in the amydala after injection of AAV-hSyn-hM4Di-mCherry. (B) Schematic representation of the experimental approach to unilateral, pan-neuronal silencing within the BLA. (C) CNO administration (5 mg/kg, ip) significantly reduced behavioral seizure score (Wilcoxon sign rank, p=0.0312) and (D) afterdischarge duration as compared, within-subject to a vehicle-treated session (t-test, t=19.26, df=5, p<0.0001). (E) Representative EEG recording from the amygdala during a vehicle-treated (black) and CNO-treated (blue) session. Spectrograms are shown in spectrograms Fig S3A. (F) Schematic representation of experimental approach toward chemogenetic silencing of glutamatergic neurons in the BLA. SALV B administration (15 mg/kg, ip) significantly reduced (G) behavioral seizure severity (Wilcoxon sign-rank test, p=0.0312) and (H) afterdischarge duration as compared, within-subject to a vehicle-treated session (paired t-test, t=8.125, df=5, p=0.0005). (I) representative EEG recordings from the amygdala during a vehicle-treated (black) and SALV B-treated (red) session. Spectrograms are shown in Fig S3C. (J) Systemic injection of CNO (5mg/kg) or CLZ (0.1 mg/kg) was without effect on (K) seizure score or (L) afterdischarge duration in DREADD-negative rats (ANOVA, F(1.572, 7.858) = 2.536, p=0.1460). (M) Representative EEG recording from the amygdala during a vehicle-treated (black) and CNO-treated (blue) session in a DREADD-negative control animal. Spectrograms are shown in Fig S3F. Bars show mean + SEM, * = p<0.05; *** = p<0.001.
Figure 5:
Figure 5:. Chemogenetic inhibition of the BLA attenuates hippocampal-kindled seizures.
(A) Schematic representation of the experimental approach to pan-neuronal silencing within the BLA during hippocampal-evoked seizures. SALV B (15 mg/kg, ip) significantly reduced (B) behavioral severity of hippocampal-kindled seizures (Wilcoxon sign rank, p=0.0312) and (C) afterdischarge duration (AD), as compared within-subject to a vehicle-treated session (paired t-test, t=14.92, df=5, p<0.0001). (D) representative EEG recordings from the dorsal hippocampus during a vehicle-treated (black) and SALV B-treated (red) session. Spectrograms are shown in Fig S4A. SALV-B treatment was without effect on the pre-stimulation baseline EEG power spectrum, but significantly blunted the elevation in power seen after stimulation (Fig S4B; statistics in Table S1). (E) Schematic representation of experimental approach to chemogenetic silencing of glutamatergic neurons in the BLA during hippocampal-evoked seizures (AAV8-CaMKII-hM4di-mCherry). CNO (5 mg/kg, ip) significantly reduced the (F) behavioral severity (Wilcoxon sign rank, p=0.0156) and (G) electrographic duration of hippocampal-evoked seizures as compared, within-subject to a vehicle-treated session (paired t-test, t=14.58, df=6, p<0.0001). Spectrogram is shown in Fig S4C. (H) representative EEG recordings from the hippocampus during a vehicle-treated (black) and CNO treated (blue) session. In DREADD-negative control animals, (schematic in (I)), CNO (5mg/kg) or clozapine (0.1 mg/kg) were without effect on (J) seizure score or (K) afterdischarge duration in DREADD-negative control animals (ANOVA, F (1.111, 5.556) = 0.0061, p=0.9546). (L) Representative EEG recording from the hippocampus during a vehicle-treated (black) and CNO-treated (blue) session. See also Figs S4E and F for spectra. Bars show mean + SEM, * = p<0.05; *** = p<0.0001.
Figure 6:
Figure 6:. Inhibition of the projection from BLA to the MD attenuates both amygdala-kindled and hippocampus-kindled seizures.
(A) Schematic representation of experimental approach showing virus injection in the BLA and cannula placement in the MD. Microinjection of CNO (500 pmol, see (Companion & Thiele, 2018)) into the MD bilaterally or ipsilateral to stimulating electrode significantly reduced (B) seizure score (Friedman test, X2=16.62, p=0.0001; Bilateral inhibition - Dunn’s, p=0.0437; Unilateral inhibition - Dunn’s, p=0.0437) and (C) afterdischarge duration in amygdala kindling (ANOVA, F1.393, 6.964=27.14, p=0.0008; Bilateral inhibition - Holm-Sidak, p=0.0042; Unilateral inhibition - Holm-Sidak, p=0.0084). (D) Representative electrographic recording during a VEH (black) and CNO (blue) treated session. In DREADD-negative animals, bilateral microinjection of CNO (500 pmol) into the MD is without effect on (E) seizure score (mean + SEM) or (F) afterdischarge duration as compared to saline microinfusion (paired t-test, t=0.9776, df=5, p=0.3732). (G) Representative electrographic recording during a VEH (black) and CNO (blue) treated session in a DREADD-negative control rat. (H) Experimental approach follows that described in (A), but in these experiments the stimulating electrode was placed in the hippocampus. Microinjection of CNO (500 pmol) into the MD bilaterally or ipsilateral to stimulating electrode significantly reduced (I) seizure score (Friedman test, X2=22.48, p<0.0001; Bilateral - score: Dunn’s, p=0.0084; Unilateral - Dunn’s, p=0.0161) and (J) afterdischarge duration in hippocampal kindling (ANOVA, F(1.253, 8.769) = 25.59, p=0.0005; Bilateral - Holm-Sidak, p<0.0001; Unilateral - Holm-Sidak, p=0.0213). (K) Representative electrographic recording during a VEH (black) and CNO (blue) treated session. In DREADD-negative animals, bilateral microinjection of CNO (500 pmol) into the MD is without effect on (L) seizure score or (M) afterdischarge duration as compared to VEH-treated session (paired t-test, t=0.9803, df=5, p=0.372). (N) Representative electrographic recording during a VEH (black) and CNO (blue) treated session in a DREADD-negative control animal. Bars show mean + SEM, * = p<0.05.
Figure 7:
Figure 7:. Verification of thalamocortical terminal labeling in frontal cortex subregions following virus injection into the midline thalamus centered on the mediodorsal nucleus.
(A) Representative section through the frontal cortex of a rat (the same animal shown in Fig 2) injected with DREADD virus (AAV-hSyn-hM4Di-mCherry) into the MD. The construct used is a DREADD-mCherry fusion protein, thus the expression of mCherry serves as a proxy for the expression of DREADDs. (B) Quantification of terminal density from thresholded images for each of the frontal subregions, defined as a percent of the field of view. 6 cases were analyzed (C) through (G) expanded views of the areas indicated by the grey boxes outlined in panel A. Terminals are evident as thin beaded processes. (F) A control region (M1 motor cortex) which does not display terminals from thalamocortical neurons originating in the MD/midline thalamus. Cing = cingulate, PrL = prelimbic cortex, IL = infralimbic cortex, NA = nucleus accumbens, fmi = forceps minor of the internal capsule, OFC = orbitofrontal cortex, AI = agranular insular cortex. Red = mCherry, Blue = DAPI.
Figure 8:
Figure 8:. Inhibition of specific projections from MD to medial PFC differently regulates amygdala-kindled seizures.
(A) Schematic representation of experimental approach showing targeting of projections from MD to IL. Microinjection of CNO (500 pmol) into the IL bilaterally, but not ipsilaterally to the stimulating electrode, significantly attenuates (B) behavioral seizure score (Friedman’s test, X2=17.71, p=0.0005; bilateral - Dunn’s, p=0.0161; unilateral – Dunn’s p>0.9999). (C) Chemogenetic silencing of MD to IL projections produced a small but reliable reduction in seizure duration as compared, within-subject to saline microinjection (ANOVA, F(1.742, 10.45) = 1.938, p=0.193; bilateral - Holm-Sidak, p=0.032). (D) Representative electrographic recording during a VEH (black) and CNO (blue) treated session. In DREADD-negative control rats, microinjection of CNO was without effect on (E) seizure score (Wilcoxon sign rank test, p>0.9999) and (F) afterdischarge duration (paired t-test, p=0.1725). (G) Schematic representation showing targeting of projections from MD to PrL. Bilateral, but not ipsilateral microinjection of CNO (500 pmol) into the PrL significantly reduced (H) behavioral seizure score (Friedman’s test, X2=19.58, p=0.0002; bilateral - Dunn’s, p=0.0011; unilateral - Dunn’s, p>0.99). (I) Inhibition likewise suppressed afterdischarge duration as compared, within-subject to saline microinjection (ANOVA, F(1.228, 9.823)=22.40, p=0.0006; bilateral: Holm-Sidak, p=0.0001; unilateral: (Holm-Sidak, p=0.29). (J) Representative electrographic recording during a VEH (black) and CNO (blue) treated session. In DREADD-negative control rats, microinjection of CNO was without effect on (K) seizure score and (L) afterdischarge duration. (M) Schematic representation showing targeting of projections from MD to anterior cingulate. Microinjection of CNO (500 pmol) was without effect on (N) behavioral seizure score (Wilcoxon sign rank, p=0.50) or (O) afterdischarge duration as compared, within-subject to saline microinjection (paired t-test, t=1.660, df=5, p=0.1578). (P) Representative electrographic recording during a VEH (black) and CNO (blue) treated session. Bars show mean + SEM, * = p<0.05.
Figure 9:
Figure 9:. Inhibition of the projection from MD to OFC, but not from MD to the insula, attenuates amygdala-kindled seizures.
(A) Schematic representation showing targeting of projections from MD to OFC. Microinjection of CNO (2.5 nmol) into the OFC bilaterally, but not ipsilaterally to the stimulating electrode, significantly reduced (B) behavioral seizure score (Friedman’s test, X2=17.81, p=0.0005; Bilateral: Dunn’s, p=0.0209; Unilateral: Dunn’s, p>0.9999). and (C) afterdischarge duration (ANOVA, F(1.913, 15.30) = 7.186, p=0.0068; Bilateral: Holm-Sidak, p=0.0236; Unilateral: Holm-Sidak, p=0.6963). In DREADD-negative control animals, microinjection of CNO was without effect on (D) seizure score or (E) afterdischarge duration (paired t-test, p=0.2611). (F) Representative electrographic recording during a VEH (black) and CNO (blue) treated session in a DREADD-expressing animal. (G) Schematic representation showing targeting of projections from MD to insula. Microinjection of CNO (500 pmol) into the anterior insula was without effect on (H) seizure score (Wilcoxon sign rank test, p>0.9999) or (I) afterdischarge duration (paired t-test, t=0.1044, df=5, p=0.9209). (J) Representative electrographic recording during a VEH (black) and CNO (blue) treated session in a DREADD-expressing animal. Similarly microinjection of CNO (500 pmol) into the posterior insula to inhibit the projection from the MD to the posterior insula (K), was without effect on either (L) behavioral seizure score (Wilcoxon Sign rank test, p>0.9999) or (M) afterdischarge duration (paired t-test, t=0.2004, df=4, p=0.8509). (N) Representative electrographic recording during a VEH (black) and CNO (blue) treated session in a DREADD-expressing animal. Bars show mean + SEM, * = p<0.05.
Figure 10:
Figure 10:. Electrographic recruitment of the PrL, IL, and OFC differ during amygdala-kindled seizures.
(A) Latency to onset of fast ictal activity in PrL, IL and OFC showed shortest latencies in the PrL, as compared to the IL and OFC (Kruskal-Wallis, H=17.91, p=0.0001; Ps=0.001 and 0.0065, respectively). Bars = mean + SEM; * = p<0.05 (B) While in the PrL, most seizures displayed immediate fast ictal onset, ictal onset was often delayed in the IL and OFC. (C) Consistent with this, OFC typically displayed a pattern of ictal slow activity. (D) Representative recording and (E) spectrogram of a seizure recorded in BLA, MD and PrL. (F-H) expanded time views corresponding to the first, second, and third boxes in (D). The EEG power of 5-sec windows were taken before stimulation, immediately after stimulation, at onset of fast ictal activity, and during ictal activity, except in the PrL where ictal onset was immediate. (I) Quantification of power spectra at pre-stimulus (black), post-stimulus (green), ictal onset (red), and seizure (blue) (solid lines = mean, shaded region = SEM) of activity in PrL. (J) Representative recording and (K) spectrogram of a seizure recorded in BLA, MD, and IL. (L-N) expanded time views corresponding to the first, second, and third boxes in (J). (O) Quantification of power spectra at pre-stimulus (black), post-stimulus (green), ictal onset (red), and seizure (blue) (solid lines = mean, shaded region = SEM) of activity in IL. (P) Representative recording and (Q) spectrogram of a seizure recorded in BLA, MD, and OFC. (R-T) expanded time views corresponding to the first, second, and third boxes in (P). (U) Quantification of power spectra at pre-stimulus (black), post-stimulus (green), ictal onset (red), and seizure (blue) (solid lines = mean, shaded region = SEM) of activity in OFC.
Figure 11:
Figure 11:. Schematic representation of the identified projections for the propagation of seizure activity from the mediodorsal nucleus of the thalamus to the frontal cortex.
Solid red arrows indicate pathways for which CNO infusion resulted in the complete suppression of limbic seizures. Dashed red arrows indicate pathways for which CNO infusion partially suppressed limbic seizures. Dashed blue arrows indicate pathways for which CNO infusion did not suppress limbic seizures. Cing = cingulate cortex, PrL = prelimbic cortex, IL = infralimbic cortex, OFC = orbitofrontal cortex, insula = insular cortex, MD = mediodorsal thalamus, BLA = basolateral amygdala. The magnitude of the arrow indicates the strength of the effect. Large solid red arrows indicate a complete or near-complete blockade of seizures when the pathway was silenced. Dotted lines with arrows indicate partial suppression of seizure activity. Thin blue lines indicate no effect on seizure activity when the pathway was suppressed.

Similar articles

Cited by

References

    1. Alcaraz F, Fresno V, Marchand AR, Kremer EJ, Coutureau E, & Wolff M (2018). Thalamocortical and corticothalamic pathways differentially contribute to goal-directed behaviors in the rat. eLife, 7. 10.7554/eLife.32517 - DOI - PMC - PubMed
    1. Alcaraz F, Marchand AR, Courtand G, Coutureau E, & Wolff M (2016). Parallel inputs from the mediodorsal thalamus to the prefrontal cortex in the rat. The European Journal of Neuroscience, 44(3), 1972–1986. - PubMed
    1. Allen TA, Narayanan NS, Kholodar-Smith DB, Zhao Y, Laubach M, & Brown TH (2008). Imaging the spread of reversible brain inactivations using fluorescent muscimol. Journal of Neuroscience Methods, 171(1), 30–38. - PMC - PubMed
    1. Arikan R, Blake NMJ, Erinjeri JP, Woolsey TA, Giraud L, & Highstein SM (2002). A method to measure the effective spread of focally injected muscimol into the central nervous system with electrophysiology and light microscopy. Journal of Neuroscience Methods, 118(1), 51–57. - PubMed
    1. Berglind F, Andersson M, & Kokaia M (2018). Dynamic interaction of local and transhemispheric networks is necessary for progressive intensification of hippocampal seizures. Scientific Reports, 8(1), 5669. - PMC - PubMed

Publication types