

Mendelian randomisation of eosinophils and other cell types in relation to lung function and disease
- PMID: 35537820
- PMCID: PMC10176352
- DOI: 10.1136/thoraxjnl-2021-217993
Mendelian randomisation of eosinophils and other cell types in relation to lung function and disease
Abstract
Rationale: Eosinophils are associated with airway inflammation in respiratory disease. Eosinophil production and survival is controlled partly by interleukin-5: anti-interleukin-5 agents reduce asthma and response correlates with baseline eosinophil counts. However, whether raised eosinophils are causally related to chronic obstructive pulmonary disease (COPD) and other respiratory phenotypes is not well understood.
Objectives: We investigated causality between eosinophils and: lung function, acute exacerbations of COPD, asthma-COPD overlap (ACO), moderate-to-severe asthma and respiratory infections.
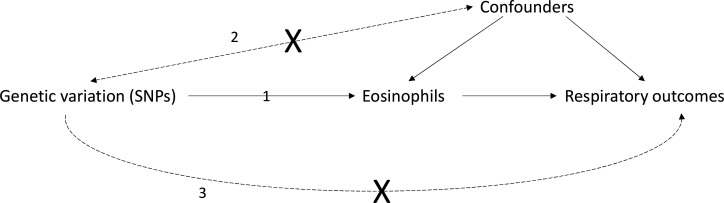
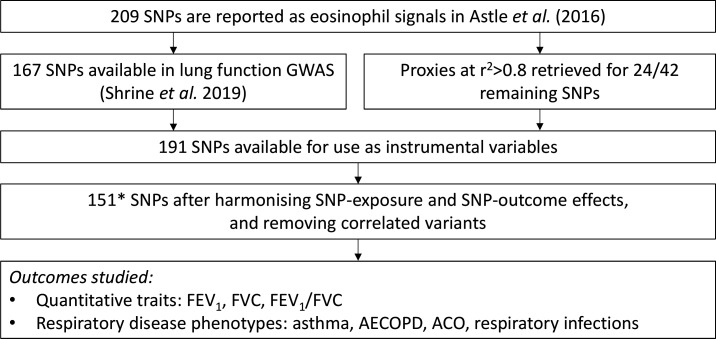
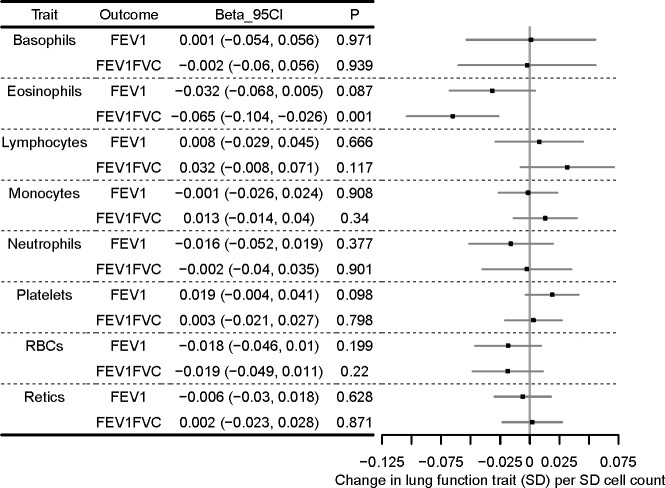
Methods: We performed Mendelian randomisation (MR) using 151 variants from genome-wide association studies of blood eosinophils in UK Biobank/INTERVAL, and respiratory traits in UK Biobank/SpiroMeta, using methods relying on different assumptions for validity. We performed multivariable analyses using eight cell types where there was possible evidence of causation by eosinophils.
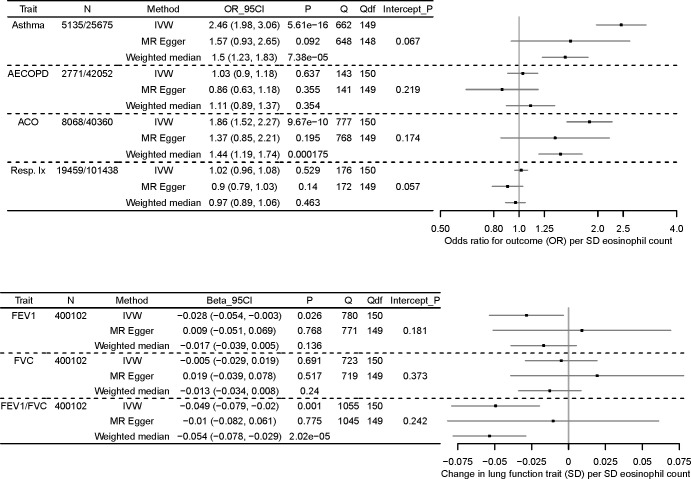
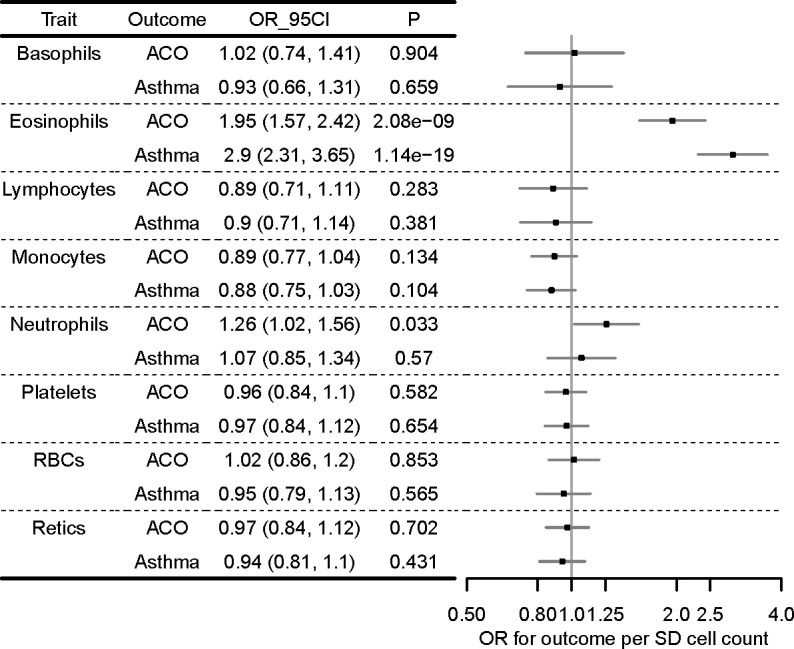
Measurements and main results: Causal estimates derived from individual variants were highly heterogeneous, which may arise from pleiotropy. The average effect of raising eosinophils was to increase risk of ACO (weighted median OR per SD eosinophils, 1.44 (95%CI 1.19 to 1.74)), and moderate-severe asthma (weighted median OR 1.50 (95%CI 1.23 to 1.83)), and to reduce forced expiratory volume in 1 s (FEV1)/forced vital capacity (FVC) and FEV1 (weighted median estimator, SD FEV1/FVC: -0.054 (95% CI -0.078 to -0.029), effect only prominent in individuals with asthma).
Conclusions: Broad consistency across MR methods may suggest causation by eosinophils (although of uncertain magnitude), yet heterogeneity necessitates caution: other important mechanisms may be responsible for the impairment of respiratory health by these eosinophil-raising variants. These results could suggest that anti-IL5 agents (designed to lower eosinophils) may be valuable in treating other respiratory conditions, including people with overlapping features of asthma and COPD.
Keywords: Asthma Epidemiology; Asthma Genetics; Asthma Mechanisms; COPD epidemiology; COPD exacerbations mechanisms; Eosinophil Biology; Respiratory Infection.
© Author(s) (or their employer(s)) 2023. Re-use permitted under CC BY. Published by BMJ.
Conflict of interest statement
Competing interests: MDT and LVW receive funding from GSK for collaborative research projects outside of the submitted work. IH has funded research collaborations with GSK, Boehringer Ingelheim and Orion.
Figures
Similar articles
-
[Correlation between expressions of myeloperoxidase and eosinophil cationic protein in sputum and clinical features of asthma-chronic obstructive pulmonary disease overlap].Nan Fang Yi Ke Da Xue Xue Bao. 2018 Sep 30;38(10):1215-1221. doi: 10.3969/j.issn.1673-4254.2018.10.10. Nan Fang Yi Ke Da Xue Xue Bao. 2018. PMID: 30377121 Free PMC article. Chinese.
-
Distinct physiological, transcriptomic, and imaging characteristics of asthma-COPD overlap compared to asthma and COPD in smokers.EBioMedicine. 2024 Dec;110:105453. doi: 10.1016/j.ebiom.2024.105453. Epub 2024 Nov 23. EBioMedicine. 2024. PMID: 39580967 Free PMC article.
-
Kidney function and obstructive lung disease: a bidirectional Mendelian randomisation study.Eur Respir J. 2021 Dec 9;58(6):2100848. doi: 10.1183/13993003.00848-2021. Print 2021 Dec. Eur Respir J. 2021. PMID: 33958431
-
Anti-IL-5 therapies for chronic obstructive pulmonary disease.Cochrane Database Syst Rev. 2020 Dec 8;12(12):CD013432. doi: 10.1002/14651858.CD013432.pub2. Cochrane Database Syst Rev. 2020. PMID: 33295032 Free PMC article.
-
The clinical efficacy of type 2 monoclonal antibodies in eosinophil-associated chronic airway diseases: a meta-analysis.Front Immunol. 2023 Apr 11;14:1089710. doi: 10.3389/fimmu.2023.1089710. eCollection 2023. Front Immunol. 2023. PMID: 37114057 Free PMC article.
Cited by
-
Blood Eosinophil Endotypes across Asthma and Chronic Obstructive Pulmonary Disease (COPD).Can Respir J. 2022 Oct 19;2022:9656278. doi: 10.1155/2022/9656278. eCollection 2022. Can Respir J. 2022. PMID: 36311545 Free PMC article.
-
A two-sample Mendelian randomization analysis: causal association between chemokines and pan-carcinoma.Front Genet. 2023 Nov 23;14:1285274. doi: 10.3389/fgene.2023.1285274. eCollection 2023. Front Genet. 2023. PMID: 38075694 Free PMC article.
-
PM2.5 increases the risk of early-onset COPD mediated by smoking and shared genes: a large-scale genetic analysis.Clin Exp Med. 2025 Apr 12;25(1):116. doi: 10.1007/s10238-025-01644-9. Clin Exp Med. 2025. PMID: 40220177 Free PMC article.
-
Relationships between vitamin C intake and COPD assessed by machine learning approaches from the NHANES (2017-2023).Front Nutr. 2025 May 15;12:1563692. doi: 10.3389/fnut.2025.1563692. eCollection 2025. Front Nutr. 2025. PMID: 40444249 Free PMC article.
-
Plasma Levels of CXCL9 and MCP-3 are Increased in Asthma-COPD Overlap (ACO) Patients.Int J Chron Obstruct Pulmon Dis. 2025 Apr 22;20:1161-1174. doi: 10.2147/COPD.S506517. eCollection 2025. Int J Chron Obstruct Pulmon Dis. 2025. PMID: 40297845 Free PMC article.
References
Publication types
MeSH terms
Grants and funding
LinkOut - more resources
Full Text Sources
Medical