. 2022 May 10;5(9):e202201405.
doi: 10.26508/lsa.202201405. Print 2022 Sep.

Genome-scale metabolic models for natural and long-term drug-induced viral control in HIV infection

Affiliations

Genome-scale metabolic models for natural and long-term drug-induced viral control in HIV infection

Anoop T Ambikan et al. Life Sci Alliance. .

Abstract

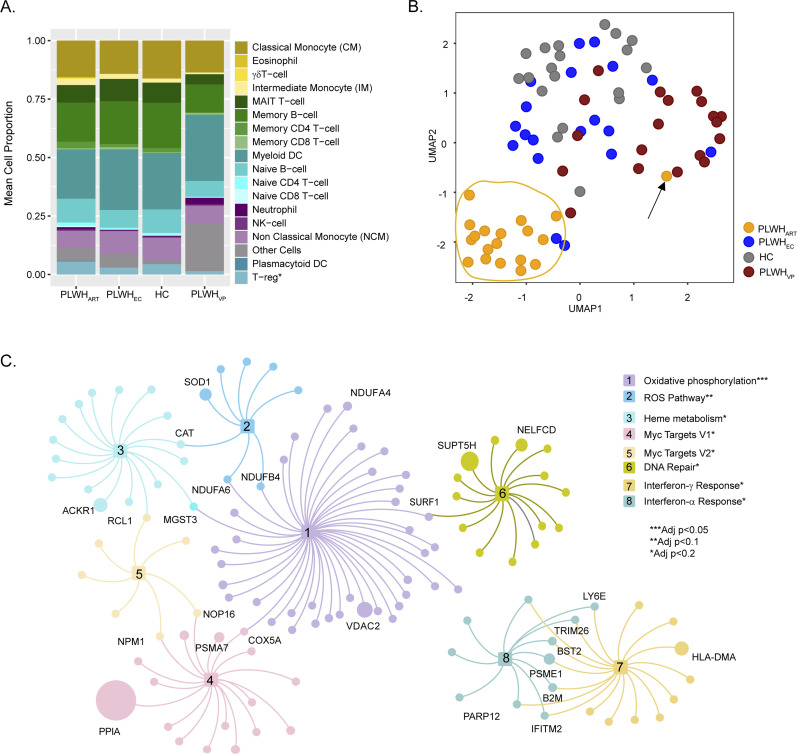
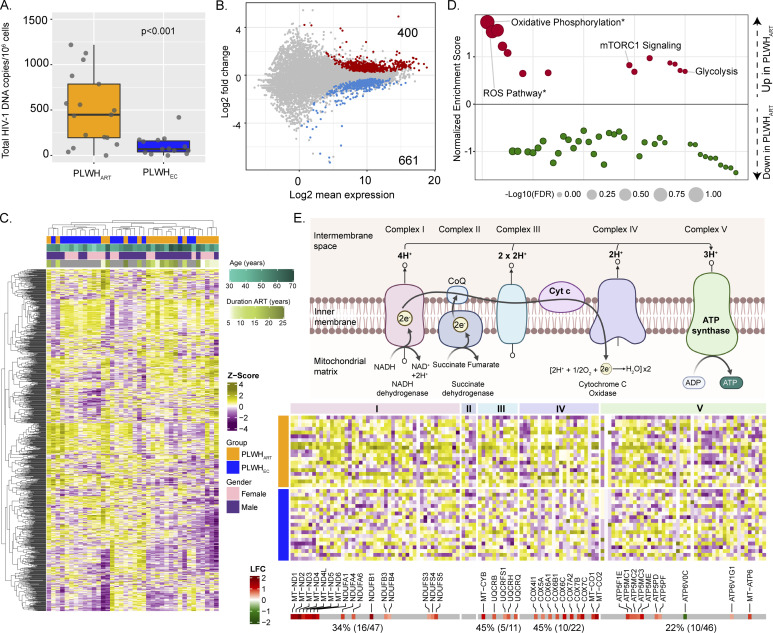
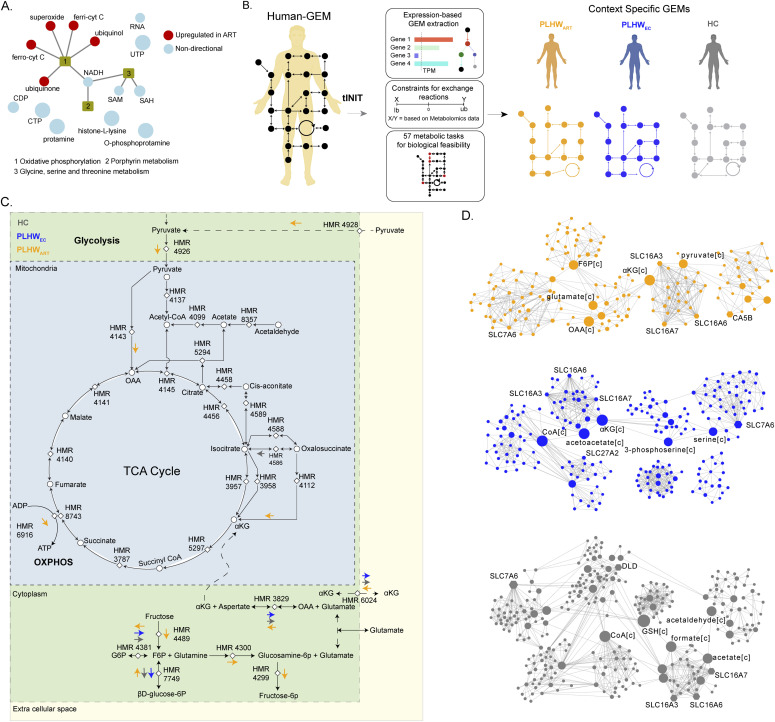
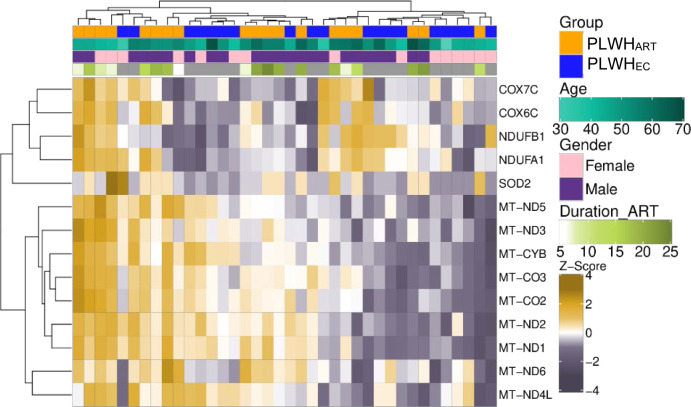
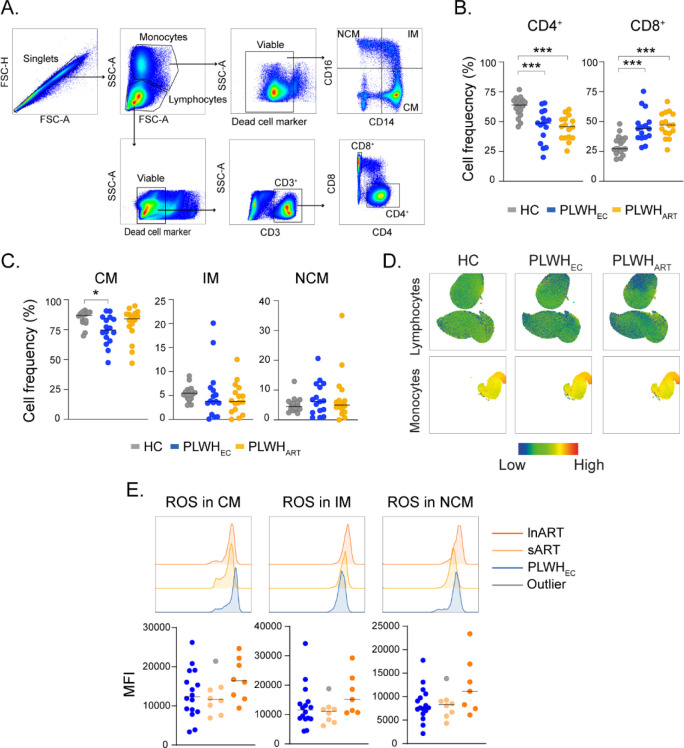
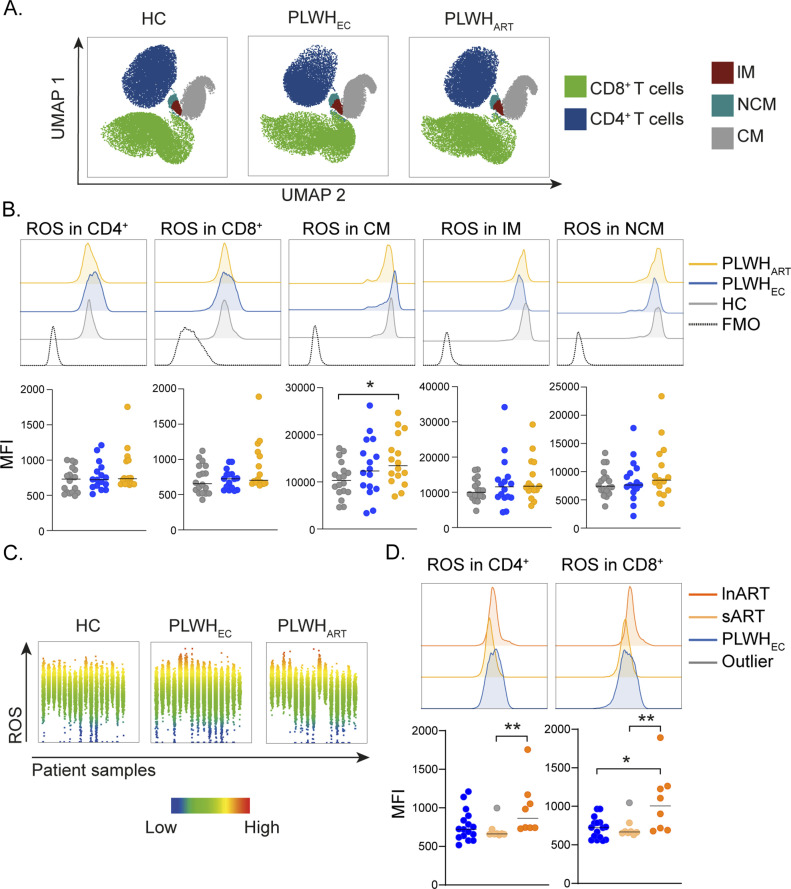
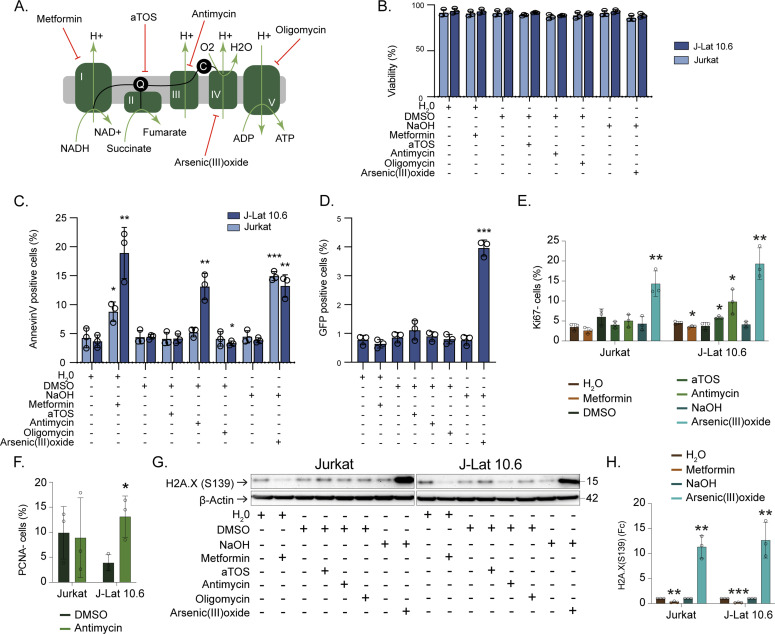
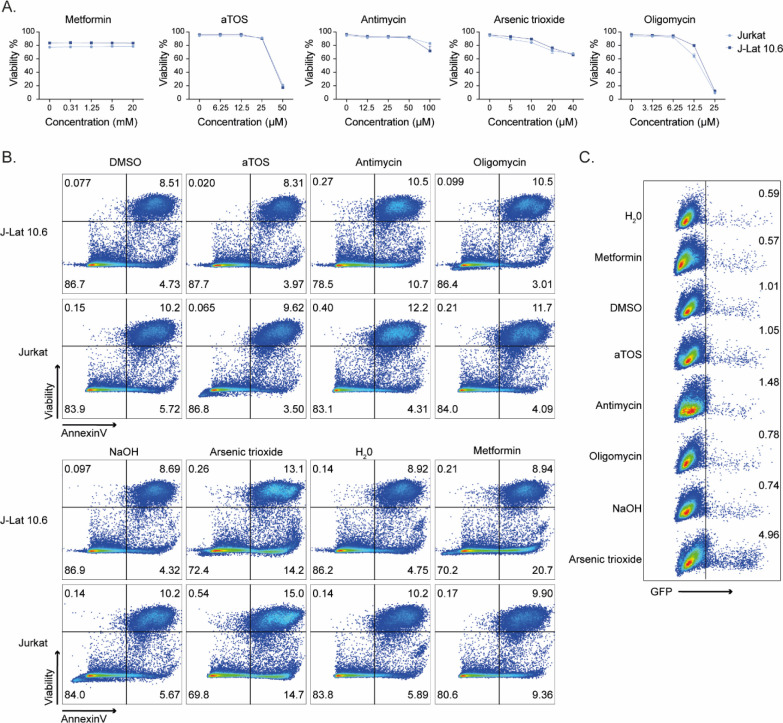
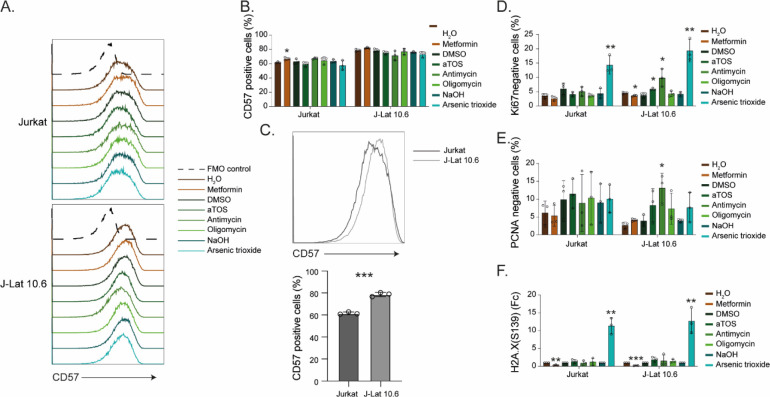
Genome-scale metabolic models (GSMMs) can provide novel insights into metabolic reprogramming during disease progression and therapeutic interventions. We developed a context-specific system-level GSMM of people living with HIV (PLWH) using global RNA sequencing data from PBMCs with suppressive viremia either by natural (elite controllers, PLWHEC) or drug-induced (PLWHART) control. This GSMM was compared with HIV-negative controls (HC) to provide a comprehensive systems-level metabo-transcriptomic characterization. Transcriptomic analysis identified up-regulation of oxidative phosphorylation as a characteristic of PLWHART, differentiating them from PLWHEC with dysregulated complexes I, III, and IV. The flux balance analysis identified altered flux in several intermediates of glycolysis including pyruvate, α-ketoglutarate, and glutamate, among others, in PLWHART The in vitro pharmacological inhibition of OXPHOS complexes in a latent lymphocytic cell model (J-Lat 10.6) suggested a role for complex IV in latency reversal and immunosenescence. Furthermore, inhibition of complexes I/III/IV induced apoptosis, collectively indicating their contribution to reservoir dynamics.


Conflict of interest statement

The authors declare that they have no conflict of interest.

Figures

Figure 1.
Figure 1.. System-level transcriptomics signature in PLWHART.
(A) Digital cell-type quantification using Estimating the Proportions of Immune and Cancer cell (EPIC) methodology. Mean cell proportions estimated from the samples of each of the four cohorts are visualized in the bar graph. (B) Visualization of sample distribution using expression of combination antiretroviral therapy–specific genes and dimensionality reduction by UMAP. (C) Network visualization of pathways identified as significantly enriched by combination antiretroviral therapy–specific genes. Nodes are genes and edges represent association with pathways. Node size is relative to the mean expression of the genes among the PLWHART. Genes overlapping between pathways and high abundance genes are labeled.
Figure S1.
Figure S1.. Box plot of the proportion of various cell types estimated using Estimating the Proportions of Immune and Cancer cell.
Mann–Whitney U test results are displayed between each cohort.
Figure 2.
Figure 2.. Comparative analysis of PLWHART and PLWHEC.
(A) Relative reservoir quantification using total HIV-1 DNA in PLWHART (n = 17) and PLWHEC (n = 14). (B) MA plot showing differential gene expression results of PLWHART versus PLWHEC. Negative log2-fold change values represent down-regulation and positive values represent up-regulation in PLWHART. Grey-colored dots denote non-significant genes (adjusted P > 0.05). (C) Heatmap showing the expression pattern of significantly regulated genes between PLWHART and PLWHEC (adjusted P < 0.05). Column annotation denotes cohort, age, gender, and duration of combination antiretroviral therapy of the corresponding samples. Row and column clustering was performed using Euclidian distance. (D) Gene set enrichment analysis results using MSigDB hallmark gene set between PLWHART versus PLWHEC. A positive enrichment score represents up-regulation and negative score represents down-regulation in PLWHART. Statistically significant pathways are labeled and highlighted by asterisk. Bubble size is relative to the adjusted P-values of the pathways. *Indicates FDR < 0.2. (E) Schematic visualization of the five complexes of OXPHOS pathway. The heat-map shows expression pattern of genes belonging to OXPHOS pathway in PLWHART and PLWHEC. Column annotation denotes OXPHOS pathway complexes and row annotation denotes the cohort. The bottom annotation shows the log2 fold change values of the genes. Red color represents up-regulation and green color represents down-regulation of the gene in PLWHART compared with PLWHEC.
Figure 3.
Figure 3.. Context-specific genome-scale metabolic modeling and flux balance analysis.
(A) Network visualization of significant reporter metabolites (adjusted P < 0.2) identified in PLWHART versus PLWHEC. Red-colored nodes represent up-regulated reporter metabolites and steel-blue colored nodes represent dysregulated (non-directional) reporter metabolites. (B) Workflow diagram of context-specific genome-scale metabolic model reconstruction. (C) Reaction diagram showing flux balance analysis results. Reactions show specific flux changes in PLWHART compared with PLWHEC and HC cohorts highlighted with colored arrows. The direction of the arrow represents the flux change of the corresponding reaction in the cohort. (D) Communities identified from the topology analysis of the metabolic network in PLWHART, PLWHEC, and HC. Node size is relative to betweenness centrality measurement. The top five ranked genes and metabolites based on betweenness centrality are labeled.
Figure S2.
Figure S2.. Heat map visualizing expression pattern of enzymatic genes belonging to the reactions involving the significant reporter metabolites identified between PLWHART and PLWHEC.
Figure S3.
Figure S3.. Flow cytometry analysis of reactive oxygen species (ROS) production in HC (n = 18), PLWHEC (n = 16), and PLWHART (n = 18).
Related to Fig 4. (A) Gating strategy for CD4+ T cells, CD8+ T cells, classical monocytes (CM), intermediate monocytes (IM), and non-classical monocytes (NCM) from total PBMCs. (B) Proportion of CD4+ and CD8+ T cells in HC, PLWHEC, and PLWHART. (C) Proportion of CM, IM, and NCM in HC, PLWHEC, and PLWHART. (D) UMAP shows the heat map distribution of ROS in HC, PLWHEC, and PLWHART in lymphocytic and monocytic cell populations. (E) MFI of ROS in monocytic cell populations from PLWHEC, short-term ART (<10 yr, n = 8), and long-term ART (>10 yr, n = 8). The histogram shows a representative sample from HC, PLWHEC, and PLWHART exhibiting the median expression in each group. Statistical significance was determined using Mann–Whitney U test (P < 0.05 with * < 0.05, ** < 0.033, *** < 0.002) and represented with the median.
Figure 4.
Figure 4.. Redox homeostasis during suppressive viremia.
(A) Reactive oxygen species (ROS) detection in lymphocytic and monocytic cell populations from HC (n = 18), PLWHEC (n = 16), and PLWHART (n = 18). UMAP representation showing the distribution of lymphocytic (CD4+ and CD8+ T cells) and monocytic (classical monocytes [CM], intermediate monocytes [IM], and non-classical monocytes [NCM]) cell populations. (B) Median fluorescence intensity (MFI) of ROS in CD4+, CD8+, CM, IM, and NCM in the cohort. Histograms show a representative sample from HC, PLWHEC, and PLWHART exhibiting the median expression in each group. (C) Graphs showing MFI of ROS in each individual from HC, PLWHEC, and PLWHART. (D) MFI of ROS in PLWHEC (n = 16), short-term ART (sART, n = 8), and long-term ART (lnART, n = 8). Histograms show a representative sample from PLWHEC, sART, and lnART exhibiting the median expression in each group. Statistical significance was determined using Mann–Whitney U test (P < 0.05 with *<0.05, **<0.03, ***<0.002) and represented with median. See also Fig S3.
Figure 5.
Figure 5.. Pharmacological inhibition of OXPHOS in lymphocytic HIV-1 latency cell model.
(A) Schematic representation of inhibition of OXPHOS complexes with metformin (complex I), aTOS (complex II), antimycin (complex III), arsenic trioxide (complex IV), and oligomycin (complex V). (B) Drug toxicity for 24 h treatment of OXPHOS inhibitors. (C) Annexin V positive cells after treatment with OXPHOS inhibitors and respective controls. (D) Activation from latency in J-Lat 10.6 cells after treatment with OXPHOS inhibitors and respective controls. (E) Percentage Ki-67 negative cells after treatment with OXPHOS inhibitors or respective controls. (F) Percentage PCNA negative cells after treating with Antimycin or DMSO control. (G) Western blot detection of H2A.X (S139) and β-Actin in Jurkat and J-Lat 10.6 after treatment with OXPHOS inhibitors or respective controls. (H) Quantification of H2A.X (S139). The graph shows fold change (Fc) of protein expression in relation to respective control after normalization to β-Actin. Experiments were performed in three biological replicates. Significance was determined using two-tailed t test (P < 0.05 with * < 0.05, ** < 0.033, *** < 0.002) and represented with mean and SD. Significance for each drug is compared with respective control. See also Figs S4 and S5. Source data are available online for this figure.
Figure S4.
Figure S4.. Effect of OXPHOS inhibition in Jurkat and J-Lat 10.6 cell lines.
Related to Fig 5. (A) Cytotoxicity curves of metformin, aTOS, antimycin, arsenic trioxide, and oligomycin in Jurkat and J-Lat 10.6 treated for 24 h. The experiment was performed in technical triplicates. (B) Representative plots showing Annexin V/Viability staining of Jurkat and J-Lat 10.6 cells during OXPHOS inhibition for 24 h. (C) Representative plots showing activation from HIV latency (GFP) in J-Lat 10.6 cells during OXPHOS inhibition for 24 h.
Figure S5.
Figure S5.. The effect of OXPHOS inhibition on cellular senescence markers in Jurkat and J-Lat 10.6 with metformin (complex I), aTOS (complex II), antimycin (complex III), arsenic trioxide (complex IV), and oligomycin (complex V).
Related to Fig 5. (A) Histogram of CD57 expression in Jurkat and J-Lat 10.6 cell lines. (B) Expression of CD57 after inhibition of OXPHOS complexes I-V in Jurkat and J-Lat 10.6. (C) Comparison of CD57 expression in Jurkat and J-Lat 10.6 cells. (D, E) Flow cytometry detection of Ki-67 (D) and PCNA (E) negative cell populations after inhibition of OXPHOS complex I-V in Jurkat and J-Lat 10.6. (F) Western blot detection of H2A.X (S139) and β-Actin in Jurkat and J-Lat 10.6 cells after inhibition of OXPHOS complex I-V. The graph shows the fold change (Fc) of protein expression in relation to respective control after normalization to β-Actin. Experiments were performed in three biological replicates. Significance was determined using a two-tailed t test (P < 0.05 with * < 0.05, ** < 0.03, *** < 0.002) and represented with mean and SD.

References

    1. Agren R, Bordel S, Mardinoglu A, Pornputtapong N, Nookaew I, Nielsen J (2012) Reconstruction of genome-scale active metabolic networks for 69 human cell types and 16 cancer types using INIT. PLoS Comput Biol 8: e1002518. 10.1371/journal.pcbi.1002518 - DOI - PMC - PubMed
    1. Agren R, Mardinoglu A, Asplund A, Kampf C, Uhlen M, Nielsen J (2014) Identification of anticancer drugs for hepatocellular carcinoma through personalized genome-scale metabolic modeling. Mol Syst Biol 10: 721. 10.1002/msb.145122 - DOI - PMC - PubMed
    1. Akusjärvi SS, Ambikan AT, Krishnan S, Gupta S, Sperk M, Végvári Á, Mikaeloff F, Healy K, Vesterbacka J, Nowak P, et al. (2022) Integrative proteo-transcriptomic and immunophenotyping signatures of HIV-1 Elite control phenotype: A cross-talk between glycolysis and HIF signaling. iScience 25: 103607. 10.1016/j.isci.2021.103607 - DOI - PMC - PubMed
    1. Ambikan AT, Yang H, Krishnan S, Svensson-Akusjärvi S, Gupta S, Lourda M, Sperk M, Arif M, Zhang C, Nordqvist H, et al. (2022) Multiomics personalized network analyses highlight progressive immune disruption of central metabolism associated with COVID-19 severity. SSRN 10.2139/ssrn.3988390 - DOI - PMC - PubMed
    1. Babu H, Sperk M, Ambikan AT, Rachel G, Viswanathan VK, Tripathy SP, Nowak P, Hanna LE, Neogi U (2019) Plasma metabolic signature and abnormalities in HIV-infected individuals on long-term successful antiretroviral therapy. Metabolites 9: 210. 10.3390/metabo9100210 - DOI - PMC - PubMed

Publication types