

Quantitative Ultrasound Assessment of Early Osteoarthritis in Human Articular Cartilage Using a High-Frequency Linear Array Transducer
- PMID: 35537895
- PMCID: PMC9246887
- DOI: 10.1016/j.ultrasmedbio.2022.03.006
Quantitative Ultrasound Assessment of Early Osteoarthritis in Human Articular Cartilage Using a High-Frequency Linear Array Transducer
Abstract
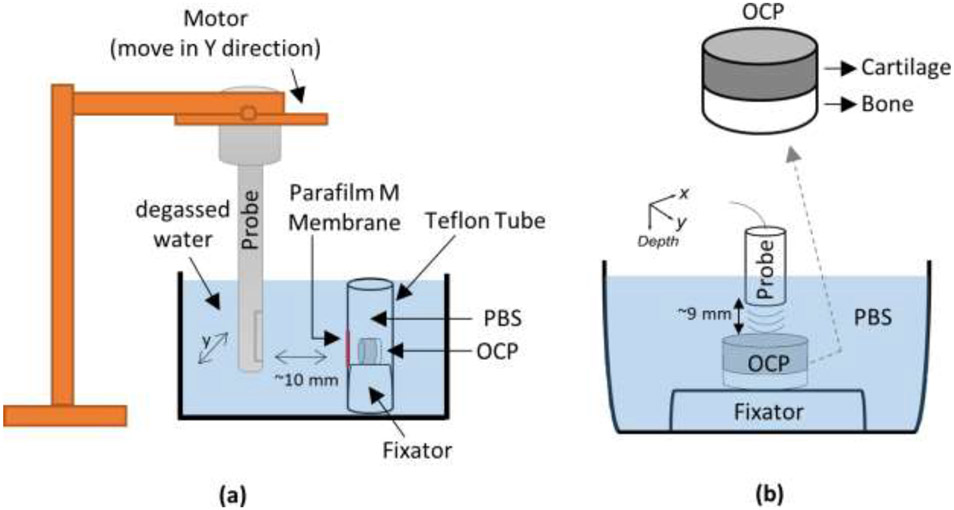
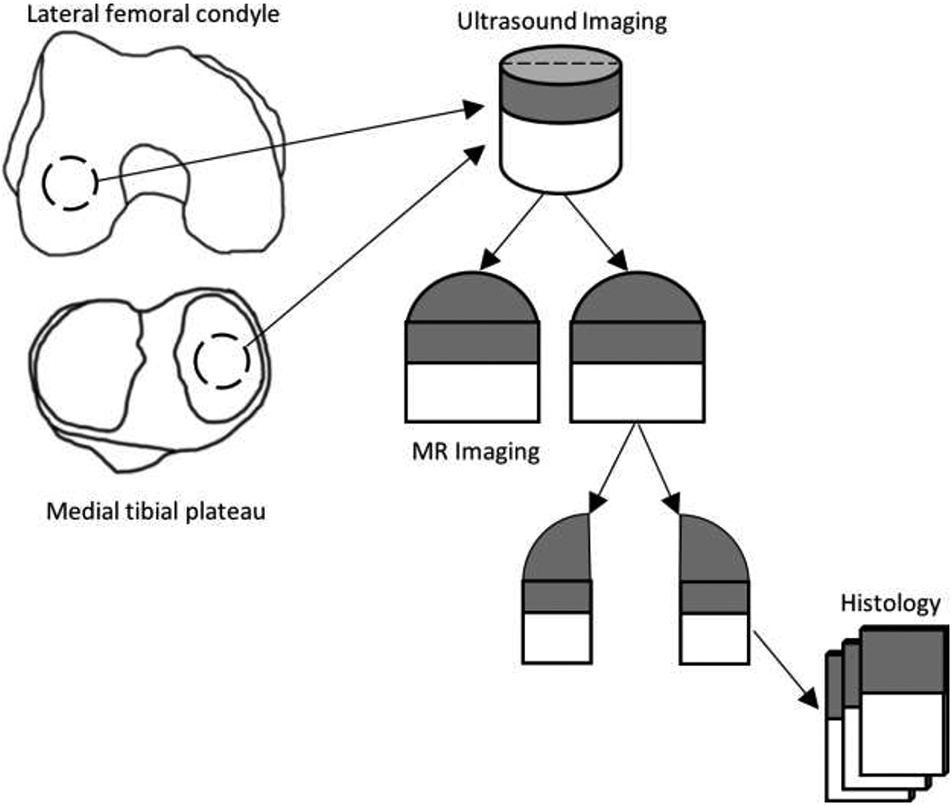
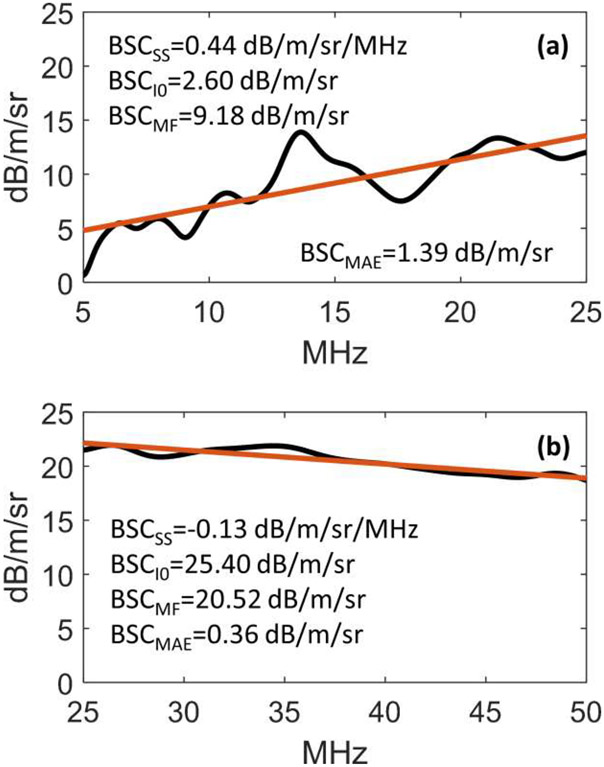
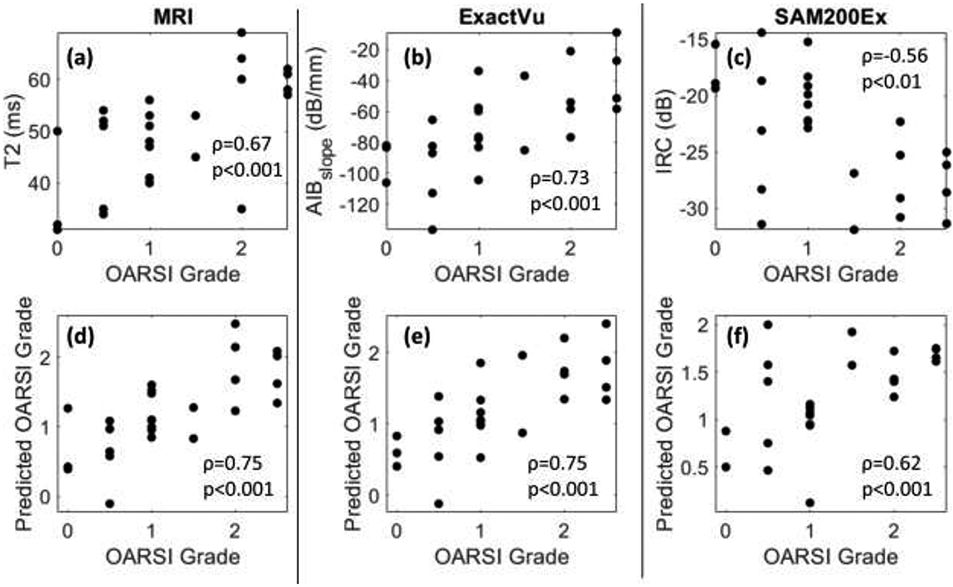
Quantitative ultrasound (QUS) assessment of osteoarthritis (OA) using high-frequency, research-grade single-element ultrasound systems has been reported. The objective of this ex vivo study was to assess the performance of QUS in detecting early OA using a high-frequency linear array transducer. Osteochondral plugs (n = 26) of human articular cartilage were scanned with ExactVu Micro-Ultrasound using an EV29L side-fire transducer. For comparison, the samples were also imaged with SAM200Ex, a custom 40-MHz scanning acoustic microscope with a single-element, focused transducer. Thirteen QUS parameters were derived from the ultrasound data. Magnetic resonance imaging (MRI) data, with T1 and T2 extracted as the quantitative parameters, were also acquired for comparison. Cartilage degeneration was graded from histology and correlated to all quantitative parameters. A maximum Spearman rank correlation coefficient (ρ) of 0.75 was achieved using a combination of ExactVu QUS parameters, while a maximum ρ of 0.62 was achieved using a combination of parameters from SAM200Ex. A maximum ρ of 0.75 was achieved using the T1 and T2 MRI parameters. This study illustrates the potential of a high-frequency linear array transducer to provide a convenient method for early OA screening with results comparable to those of research-grade single-element ultrasound and MRI.
Keywords: Cartilage; Osteoarthritis; Quantitative ultrasound.
Copyright © 2022 World Federation for Ultrasound in Medicine & Biology. Published by Elsevier Inc. All rights reserved.
Conflict of interest statement
Conflict of interest disclosure H.C. is on the advisory board for Exact Imaging and has received honoraria for presentations for Exact Imaging on the topic of prostate cancer diagnostics. The other authors have no conflicts of interest to disclose.
Figures


Similar articles
-
Research progress of ultrasound in accurate evaluation of cartilage injury in osteoarthritis.Front Endocrinol (Lausanne). 2024 Aug 15;15:1420049. doi: 10.3389/fendo.2024.1420049. eCollection 2024. Front Endocrinol (Lausanne). 2024. PMID: 39211448 Free PMC article. Review.
-
An ultrasound biomicroscopic and water jet ultrasound indentation method for detecting the degenerative changes of articular cartilage in a rabbit model of progressive osteoarthritis.Ultrasound Med Biol. 2014 Jun;40(6):1296-306. doi: 10.1016/j.ultrasmedbio.2013.12.023. Epub 2014 Mar 5. Ultrasound Med Biol. 2014. PMID: 24613214
-
Mitigation of Articular Cartilage Degeneration and Subchondral Bone Sclerosis in Osteoarthritis Progression Using Low-Intensity Ultrasound Stimulation.Ultrasound Med Biol. 2019 Jan;45(1):148-159. doi: 10.1016/j.ultrasmedbio.2018.08.022. Epub 2018 Oct 12. Ultrasound Med Biol. 2019. PMID: 30322672 Free PMC article.
-
Comparison of novel clinically applicable methodology for sensitive diagnostics of cartilage degeneration.Eur Cell Mater. 2007 Apr 3;13:46-55; discussion 55. doi: 10.22203/ecm.v013a05. Eur Cell Mater. 2007. PMID: 17407053
-
An in vitro comparative study of T2 and T2* mappings of human articular cartilage at 3-Tesla MRI using histology as the standard of reference.Skeletal Radiol. 2014 Jul;43(7):947-54. doi: 10.1007/s00256-014-1872-z. Epub 2014 Apr 9. Skeletal Radiol. 2014. PMID: 24715200 Review.
Cited by
-
Research progress of ultrasound in accurate evaluation of cartilage injury in osteoarthritis.Front Endocrinol (Lausanne). 2024 Aug 15;15:1420049. doi: 10.3389/fendo.2024.1420049. eCollection 2024. Front Endocrinol (Lausanne). 2024. PMID: 39211448 Free PMC article. Review.
-
Quantitative ultrasound classification of healthy and chemically degraded ex-vivo cartilage.Sci Rep. 2025 Jul 1;15(1):20760. doi: 10.1038/s41598-025-07827-4. Sci Rep. 2025. PMID: 40596644 Free PMC article.
-
Reply.Arthritis Rheumatol. 2025 Apr 28:10.1002/art.43206. doi: 10.1002/art.43206. Online ahead of print. Arthritis Rheumatol. 2025. PMID: 40289836 No abstract available.
References
-
- Abouassaly R, Klein EA, El-Shefai A, Stephenson A. Impact of using 29 mhz high-resolution micro-ultrasound in real-time targeting of transrectal prostate biopsies: Initial experience. World J Urol 2020; 38:1201–06. - PubMed
-
- Abragam A. The principles of nuclear magnetism: Clarendon Press, 1961.
-
- Akella SV, Regatte RR, Gougoutas AJ, Borthakur A, Shapiro EM, Kneeland JB, Leigh JS, Reddy R. Proteoglycan-induced changes in t1rho-relaxation of articular cartilage at 4t. Magn Reson Med 2001; 46:419–23. - PubMed
-
- Aula AS, Töyräs J, Tiitu V, Jurvelin JS. Simultaneous ultrasound measurement of articular cartilage and subchondral bone. Osteoarthr Cartilage 2010; 18:1570–76. - PubMed
-
- Bashir A, Gray ML, Hartke J, Burstein D. Nondestructive imaging of human cartilage glycosaminoglycan concentration by mri. Magn Reson Med 1999; 41:857–65. - PubMed
Publication types
MeSH terms
Grants and funding
LinkOut - more resources
Full Text Sources
Medical
