Hexokinase 3 enhances myeloid cell survival via non-glycolytic functions
- PMID: 35538058
- PMCID: PMC9091226
- DOI: 10.1038/s41419-022-04891-w
Hexokinase 3 enhances myeloid cell survival via non-glycolytic functions
Abstract
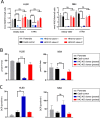
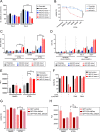
The family of hexokinases (HKs) catalyzes the first step of glycolysis, the ATP-dependent phosphorylation of glucose to glucose-6-phosphate. While HK1 and HK2 are ubiquitously expressed, the less well-studied HK3 is primarily expressed in hematopoietic cells and tissues and is highly upregulated during terminal differentiation of some acute myeloid leukemia (AML) cell line models. Here we show that expression of HK3 is predominantly originating from myeloid cells and that the upregulation of this glycolytic enzyme is not restricted to differentiation of leukemic cells but also occurs during ex vivo myeloid differentiation of healthy CD34+ hematopoietic stem and progenitor cells. Within the hematopoietic system, we show that HK3 is predominantly expressed in cells of myeloid origin. CRISPR/Cas9 mediated gene disruption revealed that loss of HK3 has no effect on glycolytic activity in AML cell lines while knocking out HK2 significantly reduced basal glycolysis and glycolytic capacity. Instead, loss of HK3 but not HK2 led to increased sensitivity to ATRA-induced cell death in AML cell lines. We found that HK3 knockout (HK3-null) AML cells showed an accumulation of reactive oxygen species (ROS) as well as DNA damage during ATRA-induced differentiation. RNA sequencing analysis confirmed pathway enrichment for programmed cell death, oxidative stress, and DNA damage response in HK3-null AML cells. These signatures were confirmed in ATAC sequencing, showing that loss of HK3 leads to changes in chromatin configuration and increases the accessibility of genes involved in apoptosis and stress response. Through isoform-specific pulldowns, we furthermore identified a direct interaction between HK3 and the proapoptotic BCL-2 family member BIM, which has previously been shown to shorten myeloid life span. Our findings provide evidence that HK3 is dispensable for glycolytic activity in AML cells while promoting cell survival, possibly through direct interaction with the BH3-only protein BIM during ATRA-induced neutrophil differentiation.
© 2022. The Author(s).
Conflict of interest statement
The authors declare no competing interests.
Figures


Similar articles
-
PU.1 is linking the glycolytic enzyme HK3 in neutrophil differentiation and survival of APL cells.Blood. 2012 May 24;119(21):4963-70. doi: 10.1182/blood-2011-09-378117. Epub 2012 Apr 12. Blood. 2012. PMID: 22498738 Free PMC article.
-
Effect of lentivirus-mediated shRNA inactivation of HK1, HK2, and HK3 genes in colorectal cancer and melanoma cells.BMC Genet. 2016 Dec 22;17(Suppl 3):156. doi: 10.1186/s12863-016-0459-1. BMC Genet. 2016. PMID: 28105937 Free PMC article.
-
CEBPA-dependent HK3 and KLF5 expression in primary AML and during AML differentiation.Sci Rep. 2014 Mar 3;4:4261. doi: 10.1038/srep04261. Sci Rep. 2014. PMID: 24584857 Free PMC article.
-
A Tumor Agnostic Therapeutic Strategy for Hexokinase 1-Null/Hexokinase 2-Positive Cancers.Cancer Res. 2019 Dec 1;79(23):5907-5914. doi: 10.1158/0008-5472.CAN-19-1789. Epub 2019 Aug 21. Cancer Res. 2019. PMID: 31434645 Free PMC article. Review.
-
Stem cell factor as a survival and growth factor in human normal and malignant hematopoiesis.Acta Haematol. 1996;95(3-4):257-62. doi: 10.1159/000203893. Acta Haematol. 1996. PMID: 8677752 Review.
Cited by
-
Transgenerational diabetogenic effects of preconception exposure to inorganic arsenic in C57BL/6 mice are associated with dysregulation of DNA methylation and gene expression in G1 and G2 offspring.Arch Toxicol. 2025 Jun 12. doi: 10.1007/s00204-025-04107-y. Online ahead of print. Arch Toxicol. 2025. PMID: 40504410
-
Identification of two key biomarkers CD93 and FGL2 associated with survival of acute myeloid leukaemia by weighted gene co-expression network analysis.J Cell Mol Med. 2024 Jul;28(14):e18552. doi: 10.1111/jcmm.18552. J Cell Mol Med. 2024. PMID: 39054581 Free PMC article.
-
Metabolic dysregulation in myelodysplastic neoplasm: impact on pathogenesis and potential therapeutic targets.Med Oncol. 2024 Dec 7;42(1):23. doi: 10.1007/s12032-024-02575-3. Med Oncol. 2024. PMID: 39644425 Review.
-
A novel risk score model of lactate metabolism for predicting outcomes and immune signatures in acute myeloid leukemia.Sci Rep. 2024 Oct 28;14(1):25742. doi: 10.1038/s41598-024-76919-4. Sci Rep. 2024. PMID: 39468216 Free PMC article.
-
CircZBTB44 promotes renal carcinoma progression by stabilizing HK3 mRNA structure.Mol Cancer. 2023 Apr 27;22(1):77. doi: 10.1186/s12943-023-01771-5. Mol Cancer. 2023. PMID: 37106446 Free PMC article.
References
-
- Gonzalez C, Ureta T, Sanchez R, Niemeyer H. Multiple molecular forms of ATP:hexose 6-phosphotransferase from rat liver. Biochem Biophys Res Commun. 1964;16:347.. - PubMed
-
- Bell G, Burant C, Takeda J, Gould GW. Structure and function of mammalian facilitative sugar transporters. J Biol Chem. 1993;268:19161–4. - PubMed
-
- Mueckler M. Facilitative glucose transporters. Eur J Biochem. 1994;219:713–25. - PubMed
Publication types
MeSH terms
Substances
LinkOut - more resources
Full Text Sources
Other Literature Sources
Medical
Molecular Biology Databases
Research Materials
Miscellaneous

