. 2022 May 10;13(1):2567.
doi: 10.1038/s41467-022-29609-6.

The pocketome of G-protein-coupled receptors reveals previously untargeted allosteric sites

Affiliations

The pocketome of G-protein-coupled receptors reveals previously untargeted allosteric sites

Janik B Hedderich et al. Nat Commun. .

Abstract

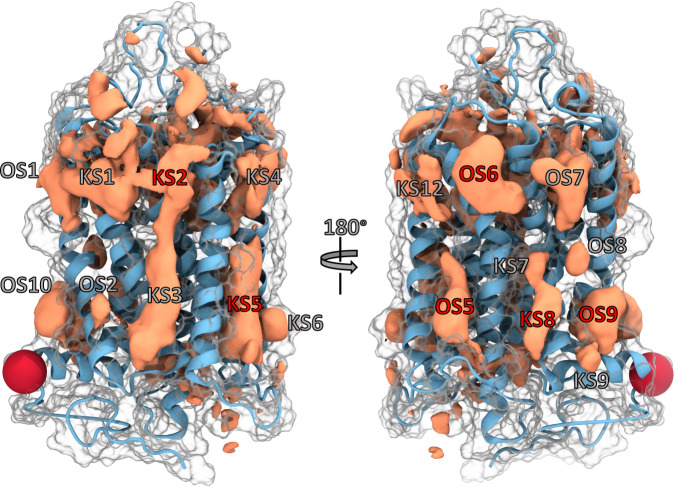
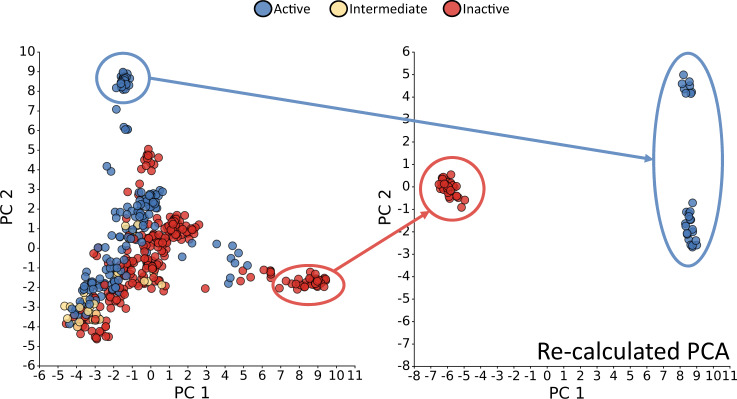
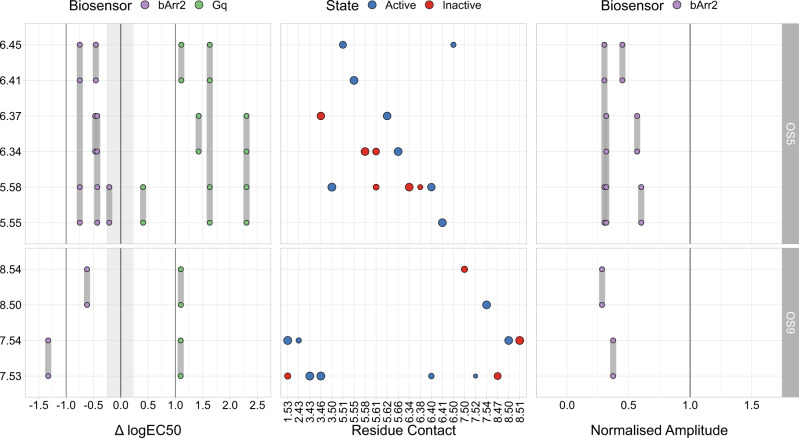
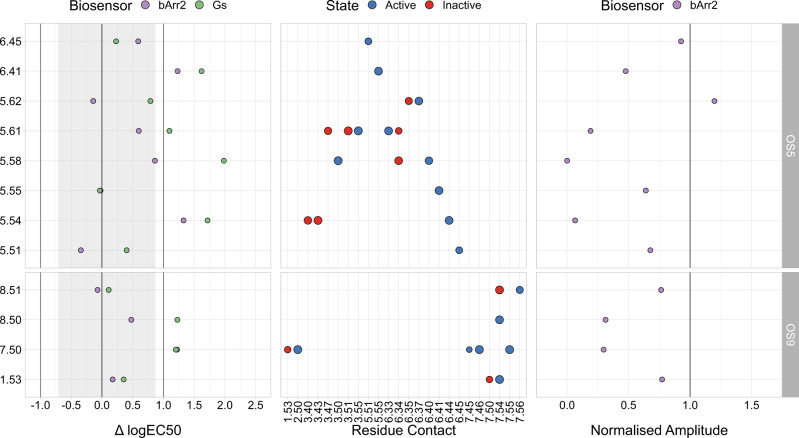
G-protein-coupled receptors do not only feature the orthosteric pockets, where most endogenous agonists bind, but also a multitude of other allosteric pockets that have come into the focus as potential binding sites for synthetic modulators. Here, to better characterise such pockets, we investigate 557 GPCR structures by exhaustively docking small molecular probes in silico and converting the ensemble of binding locations to pocket-defining volumes. Our analysis confirms all previously identified pockets and reveals nine previously untargeted sites. In order to test for the feasibility of functional modulation of receptors through binding of a ligand to such sites, we mutate residues in two sites, in two model receptors, the muscarinic acetylcholine receptor M3 and β2-adrenergic receptor. Moreover, we analyse the correlation of inter-residue contacts with the activation states of receptors and show that contact patterns closely correlating with activation indeed coincide with these sites.


Conflict of interest statement

M.B. is the president of the scientific advisory board of Domain Therapeutics, a biotechnology company which licences BRET-based biosensors for commercial use. The biosensors used in the present study are freely available for academic research through material transfer agreements. The remaining authors have no conflicts of interest.

Figures

Fig. 1
Fig. 1. Representative depiction of the GPCR pocketome.
Cumulative densities for all class A GPCRs (orange volumes) are shown projected on the structure with PDB 1F88 ([10.2210/pdb1F88/pdb]; ice blue ribbon). The surface is indicated white transparent. Visible hotspots (pockets) located at the lipid-facing receptor portion around the 7TM bundle are labelled either as OS (Orphan Site) or KS (Known Site). A more detailed description of their location is provided in the text and Table 1. We note that OS3 was described in the most recent X-ray structure PDB 7M3J [10.2210/pdb7M3J/pdb] during writing of this manuscript. We therefore re-labelled this site to KS12. Furthermore, OS4 was not found in the class A densities. Three known and three orphan pockets (red labels) are discussed in more detail in the text. The red sphere indicates the tip of HVIII and has been included for ease of orientation. Source data are provided as a source_data.xlsx file.
Fig. 2
Fig. 2. Plot of the first two principal components (PCs) of the residue contact analysis for class A structures.
Each point represents a PDB structure. They are coloured according to the GPCRdb classification into active (blue), intermediate (yellow), and inactive (red). The right panel shows the data re-calculated based on the points in the clearly separated active and inactive clusters. Each principal component (PC) value for each PDB can be seen as a linear combination of variables (i.e. contacts) that represents the residue contact landscape of a structure in a condensed manner. The first two PCs shown here explained most of the variance across all structural data, hence represent the most interesting PCs for investigating differences between receptor states on the residue contact level. Source data are provided as a source_data.xlsx file.
Fig. 3
Fig. 3. Experimental data for OS5- and OS9-mutants in the M3R.
The y-axis depicts the position of the pocket residues (Ballesteros-Weinstein numbering). Grey lines linking the points connect the respective double and quadruple mutants. The left panel shows the difference between the mutant logEC50 and the mean wildtype (wt) logEC50 values (logEC50mutlogEC50wt) and the right panel the normalised amplitude (Ampmut/Ampwt) of the extent to which β-arrestin2 was recruited. While in the left plot a value of 0 corresponds to no potency changes, a value of 1 in the right plot corresponds to no changes in efficacy compared to wt. The greyed out area indicates minimal and maximal potency shifts of multiple Gαq wt measurements. The central panel depicts interhelical residue contacts of each of the mutated residues that are important in active (blue) or inactive (red) conformations of class A GPCRs in a similar manner to Supplementary Fig. 10 (normalised PCA coefficient cut-off: 0.5). The point size correlates with the normalised PCA coefficient for a given contact and can be seen as a direct measurement of importance for a given state. Source data are provided as a source_data.xlsx file.
Fig. 4
Fig. 4. Experimental data for OS5- and OS9-mutants in the β2AR.
The y-axis depicts the position of the pocket residues (Ballesteros-Weinstein numbering). The left panel shows the difference between the mutant logEC50 and the mean wt logEC50 values (logEC50mutlogEC50wt) and the right panel the normalised amplitude (Ampmut/Ampwt) of the extent to which β-arrestin2 was recruited. While in the left plot a value of 0 corresponds to no potency changes, a value of 1 in the right plot corresponds to no changes in efficacy compared to wt. The greyed out area indicates minimal and maximal potency shifts of multiple Gαs wt measurements. The central panel depicts interhelical residue contacts of each of the mutated residues that are important in active (blue) or inactive (red) conformations of class A GPCRs in a similar manner to Supplementary Fig. 10 (normalised PCA coefficient cut-off: 0.7). The point size correlates with the normalised PCA coefficient for a given contact and can be seen as a direct measurement of importance for a given state. Part of the Gαs data was also published in. Source data are provided as a source_data.xlsx file.
Fig. 5
Fig. 5. Absolute number of observed instances of components other than synthetic ligands in the Known Sites (KS).
Shown are the total number of structures in which at least one component was resolved in each site (light grey bars) and the respective numbers for surfactants (green), anions (purple), fatty acids (red), steroids (blue), and polymers (orange). Source data are provided as a source_data.xlsx file.

Similar articles

Cited by

References

    1. Hilger D, Masureel M, Kobilka BK. Structure and dynamics of GPCR signaling complexes. Nat. Struct. Mol. Biol. 2018;25:4–12. doi: 10.1038/s41594-017-0011-7. - DOI - PMC - PubMed
    1. Weis WI, Kobilka BK. The molecular basis of G protein-coupled receptor activation. Annu. Rev. Biochem. 2018;87:897–919. doi: 10.1146/annurev-biochem-060614-033910. - DOI - PMC - PubMed
    1. Baker JG, Wilcox RG. β-blockers, heart disease and COPD: current controversies and uncertainties. Thorax. 2017;72:271–276. doi: 10.1136/thoraxjnl-2016-208412. - DOI - PubMed
    1. Christopoulos A. Advances in G protein-coupled receptor allostery: From function to structure. Mol. Phys. 2014;86:463–478. - PubMed
    1. Hilger D. The role of structural dynamics in GPCR-mediated signaling. FEBS J. 2021;288:2461–2489. doi: 10.1111/febs.15841. - DOI - PubMed

Publication types

MeSH terms

Grants and funding