. 2022 May 10;13(1):2558.
doi: 10.1038/s41467-022-30050-y.

The genomic and transcriptional landscape of primary central nervous system lymphoma

Collaborators, Affiliations

The genomic and transcriptional landscape of primary central nervous system lymphoma

Josefine Radke et al. Nat Commun. .

Abstract

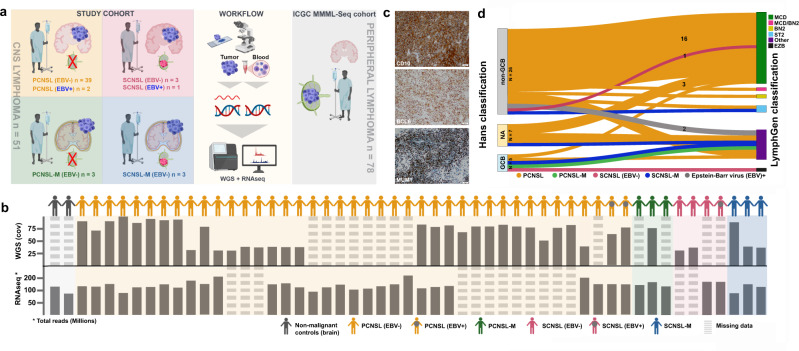
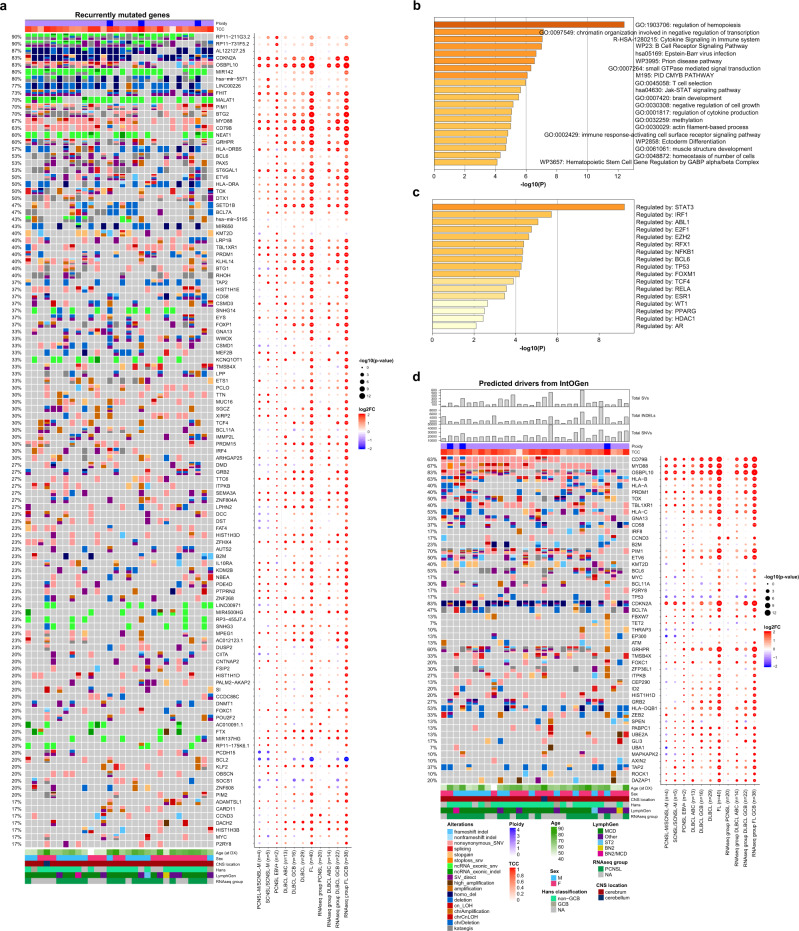
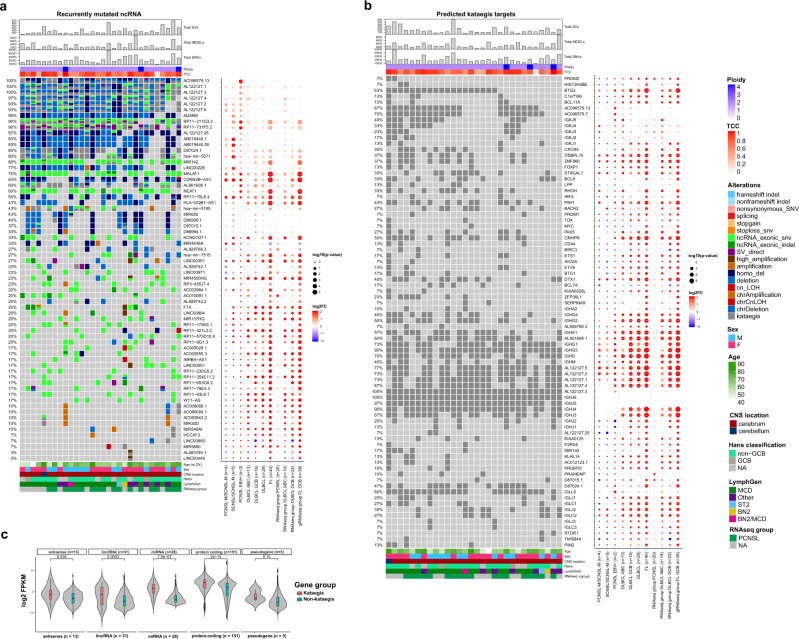
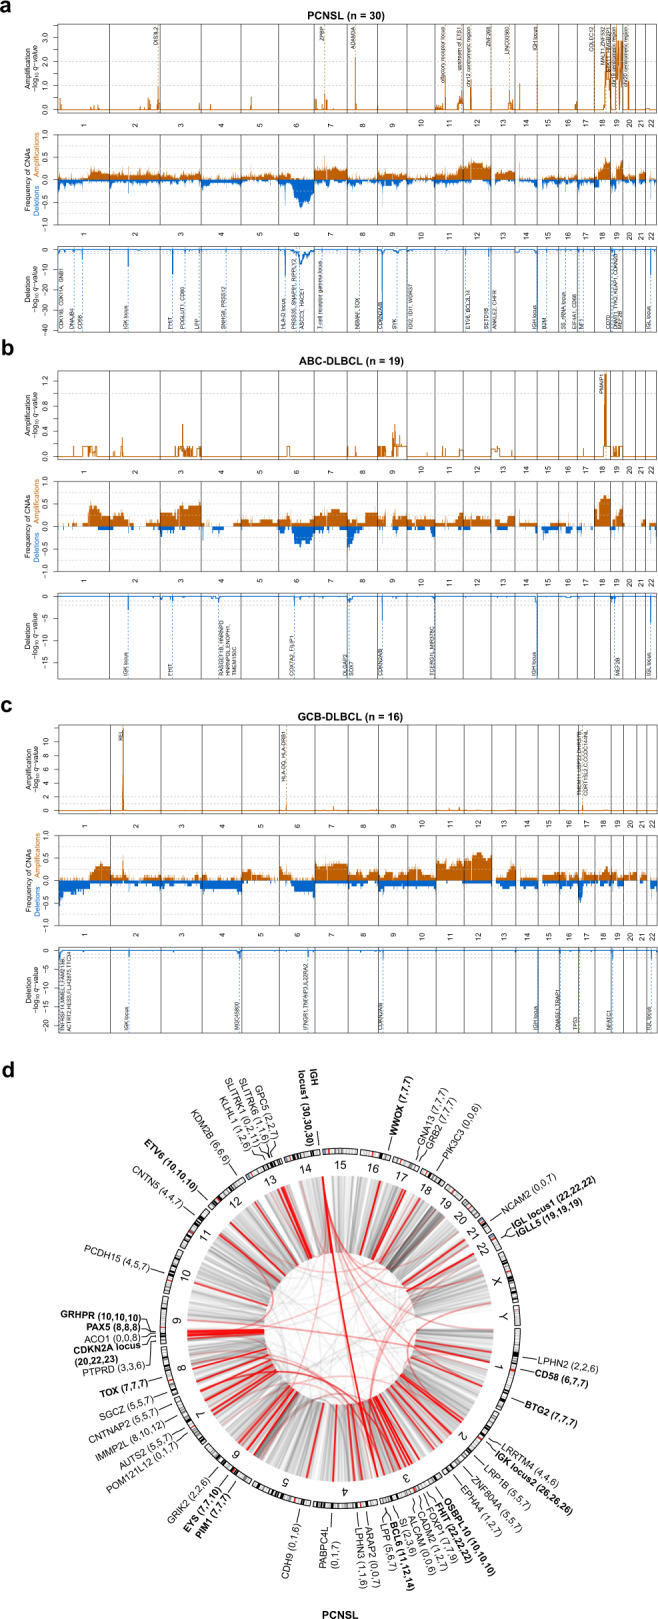
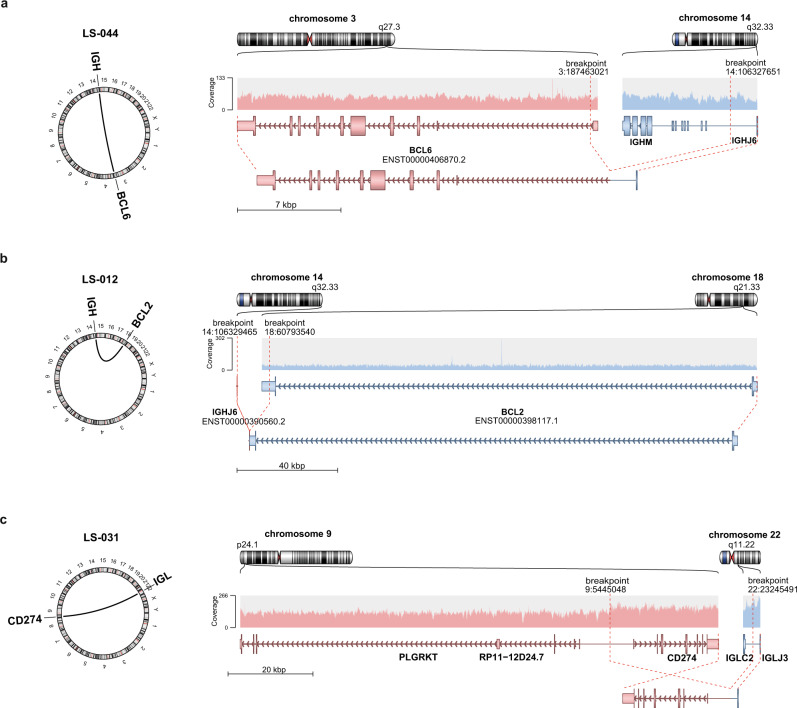
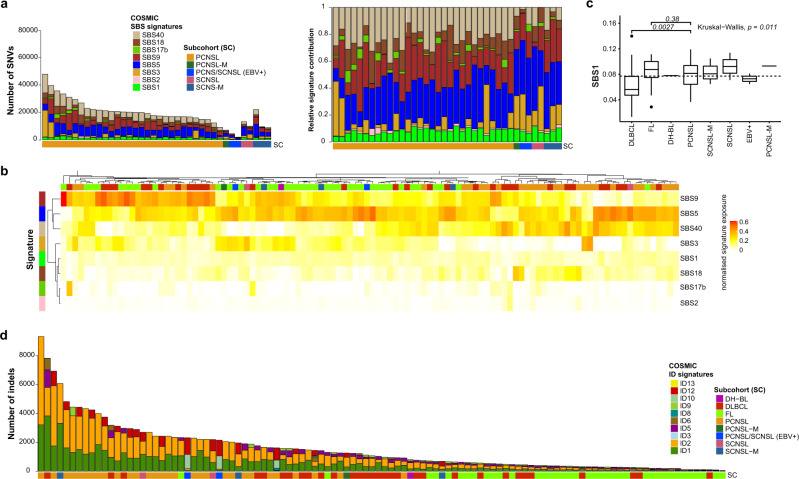
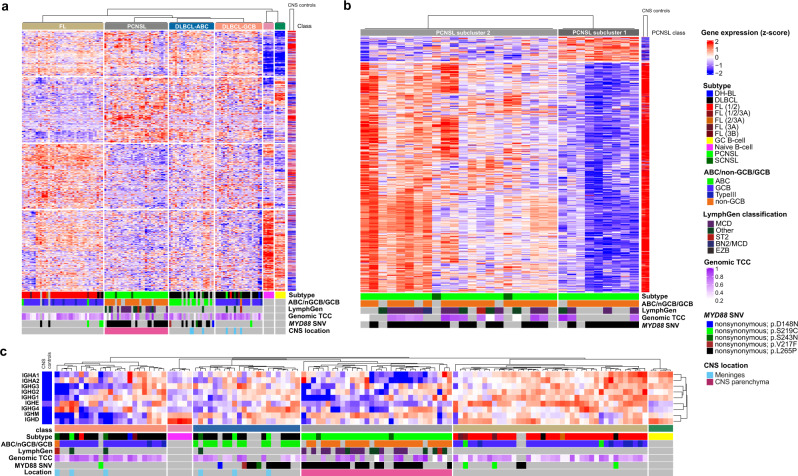
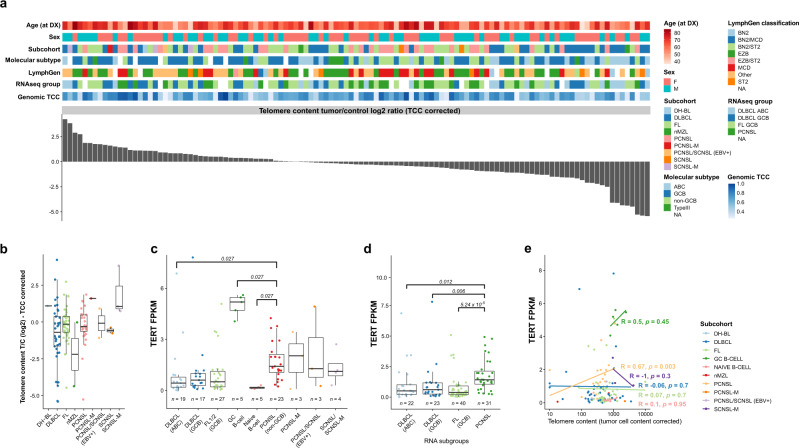
Primary lymphomas of the central nervous system (PCNSL) are mainly diffuse large B-cell lymphomas (DLBCLs) confined to the central nervous system (CNS). Molecular drivers of PCNSL have not been fully elucidated. Here, we profile and compare the whole-genome and transcriptome landscape of 51 CNS lymphomas (CNSL) to 39 follicular lymphoma and 36 DLBCL cases outside the CNS. We find recurrent mutations in JAK-STAT, NFkB, and B-cell receptor signaling pathways, including hallmark mutations in MYD88 L265P (67%) and CD79B (63%), and CDKN2A deletions (83%). PCNSLs exhibit significantly more focal deletions of HLA-D (6p21) locus as a potential mechanism of immune evasion. Mutational signatures correlating with DNA replication and mitosis are significantly enriched in PCNSL. TERT gene expression is significantly higher in PCNSL compared to activated B-cell (ABC)-DLBCL. Transcriptome analysis clearly distinguishes PCNSL and systemic DLBCL into distinct molecular subtypes. Epstein-Barr virus (EBV)+ CNSL cases lack recurrent mutational hotspots apart from IG and HLA-DRB loci. We show that PCNSL can be clearly distinguished from DLBCL, having distinct expression profiles, IG expression and translocation patterns, as well as specific combinations of genetic alterations.


Conflict of interest statement

The authors declare no competing interests.

Figures

Fig. 1
Fig. 1. Study design and multi-omic analysis of the CNSL cohort.
Panel a demonstrates the study design, study cohort along with sample size, and sequencing approach. The central nervous system lymphoma (CNSL) cohort consists of 51 primary and secondary lymphoma (PCNSL and SCNSL) patients. Whole-genome sequencing was performed using tumor tissue and matched peripheral blood samples. For RNA sequencing, we additionally analyzed normal controls (non-malignant brain tissue (frontal lobe)) and included data from peripheral lymphomas without CNS manifestation for validation (ICGC MMML-seq cohort). The lower panel b lists all CNS lymphoma derived from PCNSL or SCNSL patients as well as controls. The depth of coverage (cov) for whole-genome sequencing and total number of reads in RNA sequencing are given for each tumor sample. Whole-genome sequencing data were obtained from n = 38 PCNSL/SCNSL patients. RNA sequencing data was generated from n = 37 PCNSL/SCNSL patients and n = 2 normal controls. In 24 PCNSL/SCNSL cases, we obtained patient-matched whole-genome and RNA sequencing data. Striped bars indicate data sets missing for individual samples. The CNSL specimen were examined according to the Hans classification (CD10, BCL6, and MUM1 (c)). Additionally, we classified all n = 38 whole-genome sequencing CNSL samples according to the genetic DLBCL subtypes using the LymphGen algorithm as described by Wright et al., 2020 (d). The results are displayed in a Sankey plot. Images in panels a and b were partially created with BioRender.com.
Fig. 2
Fig. 2. Recurrent coding mutations and genomic drivers in PCNSL.
Oncoprints of recurrently mutated genes, excluding IG and chromosome Y genes (a). Mutated genes are listed from top to bottom depending on their alteration frequency. The corresponding dot plot reflects the log2 fold change and significance of alteration frequencies in the other subcohorts and RNAseq subgroups compared to PCNSL. The recurrently mutated genes (listed in the oncoprint in a) were analyzed by Metascape to identify pathway and process enrichment (b) and transcriptional regulatory networks (TRRUST) (c). Metascape adopts the hypergeometric test and employs the Benjamini-Hochberg correction for multiple testing. Oncoprints of driver genes in PCNSL (d). The top panel of the oncoprint shows the total numbers of structural variants (SVs), small insertions/deletions (INDELs), single nucleotide variants (SNVs), estimated ploidy, and genomic tumor cell content (TCC). Mutated genes are ranked by IntOGen. The corresponding dot plot reflects the log2 fold change and significance of alteration frequencies in the other subcohorts and RNAseq subgroups compared to PCNSL. In panels (a) and (d) the size of the dots demonstrate the significance according to a two-tailed Fisher’s exact test not corrected for multiple testing.
Fig. 3
Fig. 3. Recurrent non-coding RNA mutations and Kataegis events in PCNSL.
Oncoprint of recurrent non-protein-coding genes in PCNSL (a). Shown are the total numbers of structural variants (SVs), small insertions/deletions (INDELs), single nucleotide variants (SNVs), estimated ploidy, and tumor cell content (TCC) (top panel). Mutated genes are listed from top to bottom depending on their alteration frequency. Oncoprint of recurrent kataegis events in PCNSL (b). Mutated genes are listed from top to bottom depending on chromosome location. The corresponding dot plot reflects the log2 fold change and significance of alteration frequencies in the other subcohorts and RNAseq subgroups compared to PCNSL. In panels a and b the size of the dots demonstrate the significance according to a two-tailed Fisher’s exact test not corrected for multiple testing. The violin plot c shows that the RNA expression of genes with kataegis loci compared to those without were significantly higher for antisense, long non-coding RNA, miRNA and protein coding genes (one-sided Wilcoxon rank sum test, p < 0.05). Box and whisker plots are embedded in the violin plots, showing median (center line), the upper and lower quartiles (the box), and the range of the data (the whiskers), excluding outliers.
Fig. 4
Fig. 4. Genomic structural variation in PCNSL.
Recurrent somatic CNAs in PCNSL (a), ABC-DLBCL (b), and GCB-DLBCL (c). Relative prevalence of somatic copy number aberrations in tumor samples (middle panel), showing the presence of at least one copy number gain (orange bars), copy number loss (blue bars), as a proportion of analyzed samples. Significantly (q-value < 0.25) amplified and deleted regions and candidate genes are shown (upper and lower panel). For GCB-DLBCL, we added TP53 as this was detected in a significant broad deletion (Gistic2 p-value 0.0311), and the focal peak falls on the region including TP53. Circular visualization of genome rearrangements in PCNSL (d). The panels (from outside going inwards) represent recurrence per gene, chromosome ideograms, and chromosome numbering. Next to gene names, the number of SV breakpoints that lie direct on the gene, within 100 kbp of the genes, and closest to that gene are reported. Inter-chromosomal translocations are rendered with black (all) and red (highlighted if affected in 20% of samples) arcs in the center of the display. The significance of CNVs was calculated using the GISTIC 2.0 permutation test with Benjamini–Hochberg correction for multiple testing.
Fig. 5
Fig. 5. Immunoglobulin translocations in PCNSL.
Schematic representation of the translocation breakpoints involving BCL6 (PCNSL patient LS-044; a), BCL2 (SCNSL-M patient LS-012; b), and CD274 (PD-L1; PCNSL patient LS-031; c). The left panels show a circular plot displaying the location of the translocation partners. The right panel shows the original and reconstructed translocation events. Shown are (from top to bottom) chromosome ideograms, read overage of the sites, the gene models, and the reconstructed translocation partners.
Fig. 6
Fig. 6. Mutational signatures in PCNSL.
Single base substitution (SBS) signature contribution in PCNSL and SCNSL. Stacked bar plots are ordered by subgroup and then decreasing mutations load (a). The left bar plot shows the number of SNVs and the right shows the normalized signature exposures. Each color corresponds to a mutations signature and the proportion of the color reflects the number or proportion of SNVs explained by a certain mutational signature. The heatmap shows the clustering pattern of the SBS mutational signatures in all CNSL and peripheral lymphomas (b), which revealed groupings mutational signatures SBS5, SBS9, and SBS40. Pairwise comparison of PCNSL with DLBCL or FL (Mann–Whitney U test) revealed that signature SBS1 was significantly enriched in PCNSL compared to DLBCL (p = 0.027; c). Box and whisker plots show median (center line), the upper and lower quartiles (the box), and the range of the data (the whiskers), excluding outliers. Small insertion and deletion (ID) signatures in CNSL and peripheral lymphoma (d) demonstrate elevated numbers of indels and mutational patterns associated with slippage during DNA replication of the replicated DNA strand (ID1) and template DNA strand (ID2) in PCNSL.
Fig. 7
Fig. 7. Transcriptomic signatures distinguish PCNSL from DLBCL.
Global gene expression patterns clearly separate PCNSL from other subtypes (ABC-DLBCL, GCB-DLBCL, and FL; a). The heatmap shows unsupervised consensus clustering of gene expression data. All SCNSL-M and PCNSL-M cluster with non-CNS-DLBCL, distinct from intraparenchymal PCNSL. The ABC-DLBCL cluster is enriched for MYD88 mutant samples, which are distinct from MYD88 L265P mutant PCNSL. Samples of normal germinal center (GC) and naïve B-cells were included as controls. Furthermore, normal brain tissue (CNS controls) samples were added to analyze the impact of normal brain tissue contamination at the RNA level. Consensus clustering (skmeans) with intraparenchymal PCNSL samples and CNS controls revealed two groups (b). The first PCNSL expression group (PCNSL subcluster 1, on the right) consisted of samples with high tumor cell content, the second (PCNSL subcluster 2, on the left) contained mainly samples with a lower tumor cell content, which signatures correlated well with normal brain tissue expression. PCNSL can be distinguished from ABC-DLBCL, GCB-DLBCL, and FL based on the expression of IG constant genes (c).
Fig. 8
Fig. 8. TERT expression correlates with telomere content in PCNSL.
Telomere content in DLBCL, FL, PCNSL, and SCNSL was estimated from WGS data using TelomereHunter. In about 1/3 of the samples, the telomere content was higher in the tumor than in the control sample (a). There was no statistical difference between PCNSL and other subcohorts in telomere content (b). TERT expression was significantly higher in PCNSL compared to subcohort ABC-DLBCL (c) and compared to RNA subgroups ABC-DLBCL, GCB-DLBCL, and FL (d). P-values in panels c and d are calculated using the one-sided Wilcox test adjusted for multiple testing using the Holm-Bonferroni method. Box and whisker plots show median (center line), the upper and lower quartiles (the box), and the range of the data (the whiskers), excluding outliers. A significant positive correlation between TERT expression and telomere content was only observed in PCNSL (e), using the Pearson correlation-coefficient test without correction for multiple testing.

Similar articles

Cited by

References

    1. Louis, D. N., Ohgaki, H., Wiestler, O. D. & Cavenee, W. K. WHO Classification of Tumours of the Central Nervous System 4 edn, 1 (International Agency for Research on Cancer Lyon, 2016).
    1. Swerdlow, S. H. et al. WHO Classification of Tumours of Haematopoietic and Lymphoid Tissues 2 (International Agency for Research on Cancer Lyon, 2008).
    1. Maciocia P, et al. Treatment of diffuse large B-cell lymphoma with secondary central nervous system involvement: encouraging efficacy using CNS-penetrating R-IDARAM chemotherapy. Br. J. Haematol. 2016;172:545–553. doi: 10.1111/bjh.13867. - DOI - PubMed
    1. Ferreri AJM. Secondary CNS lymphoma: The poisoned needle in the haystack. Ann. Oncol. 2017;28:2335–2337. doi: 10.1093/annonc/mdx515. - DOI - PubMed
    1. Ferreri AJ. Risk of CNS dissemination in extranodal lymphomas. Lancet Oncol. 2014;15:e159–e169. doi: 10.1016/S1470-2045(13)70568-0. - DOI - PubMed

Publication types

MeSH terms