. 2022 May 10;13(1):2548.
doi: 10.1038/s41467-022-30207-9.

A genome-wide CRISPR-Cas9 knockout screen identifies essential and growth-restricting genes in human trophoblast stem cells

Affiliations

A genome-wide CRISPR-Cas9 knockout screen identifies essential and growth-restricting genes in human trophoblast stem cells

Chen Dong et al. Nat Commun. .

Abstract

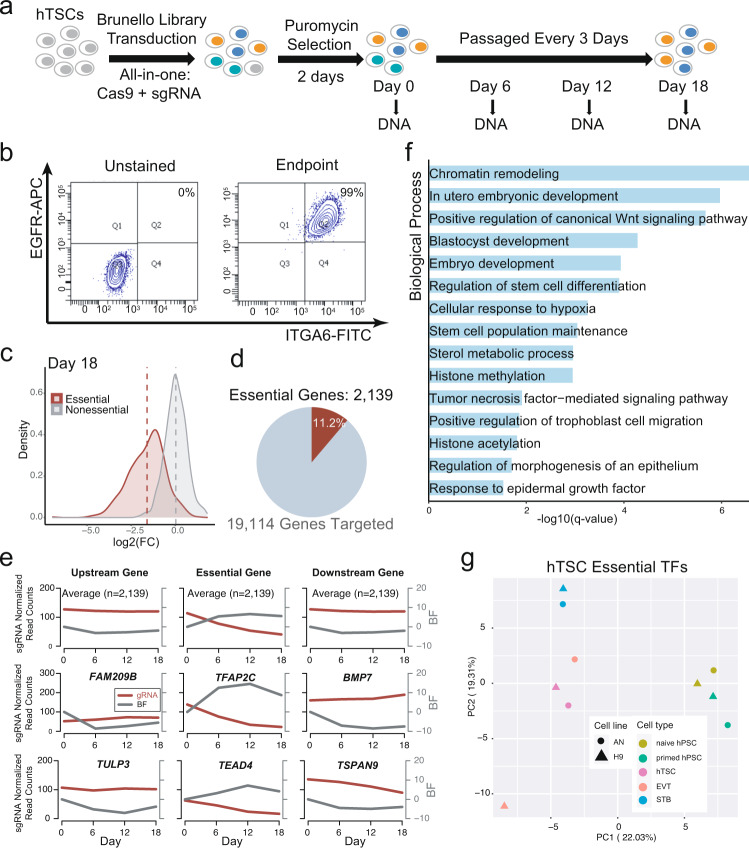
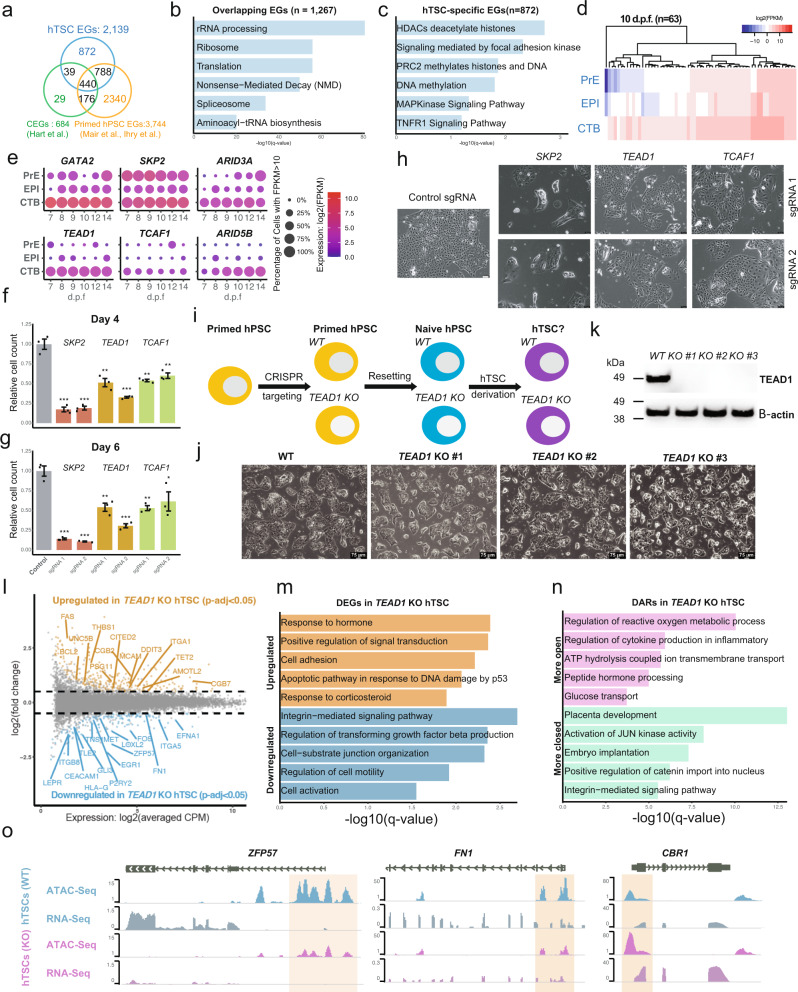
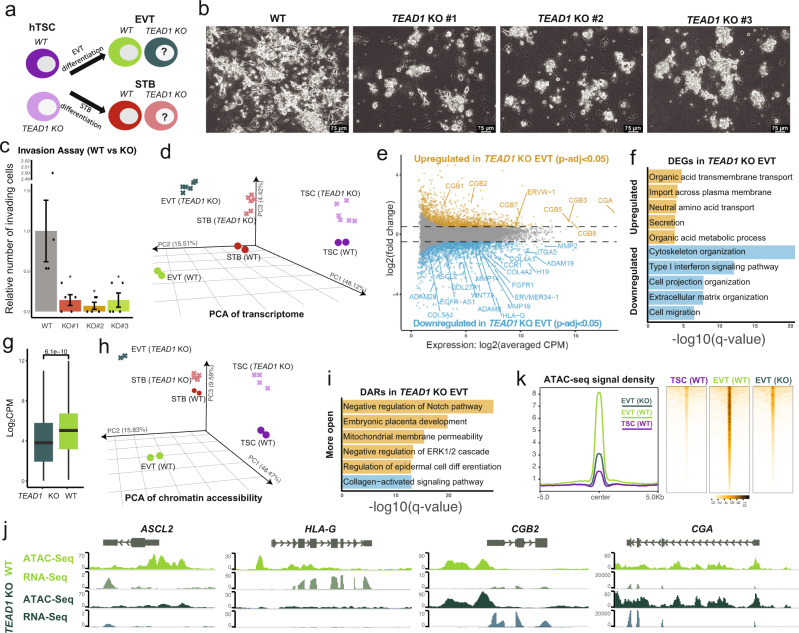
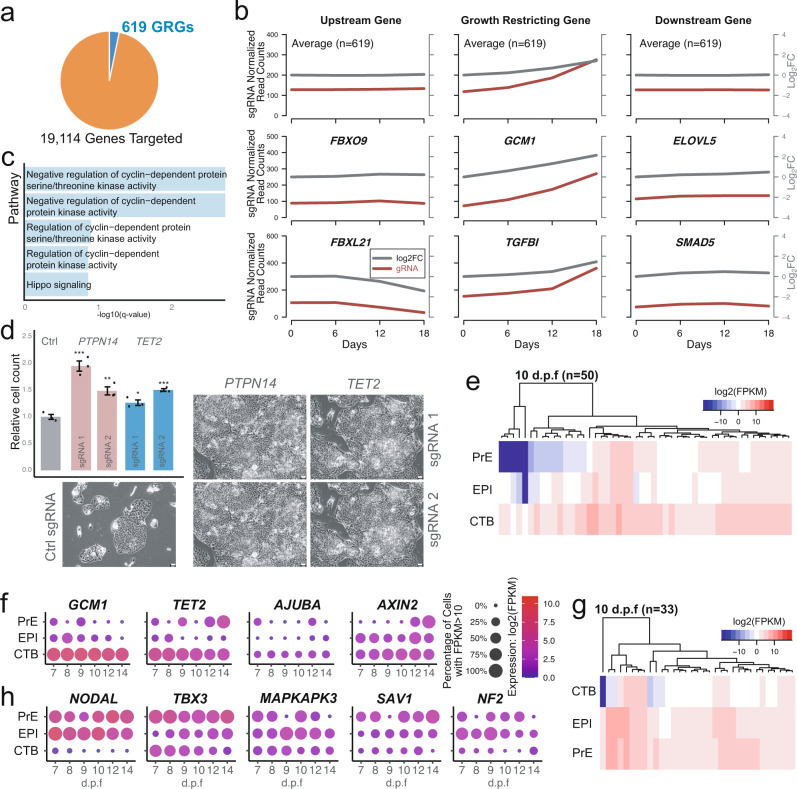
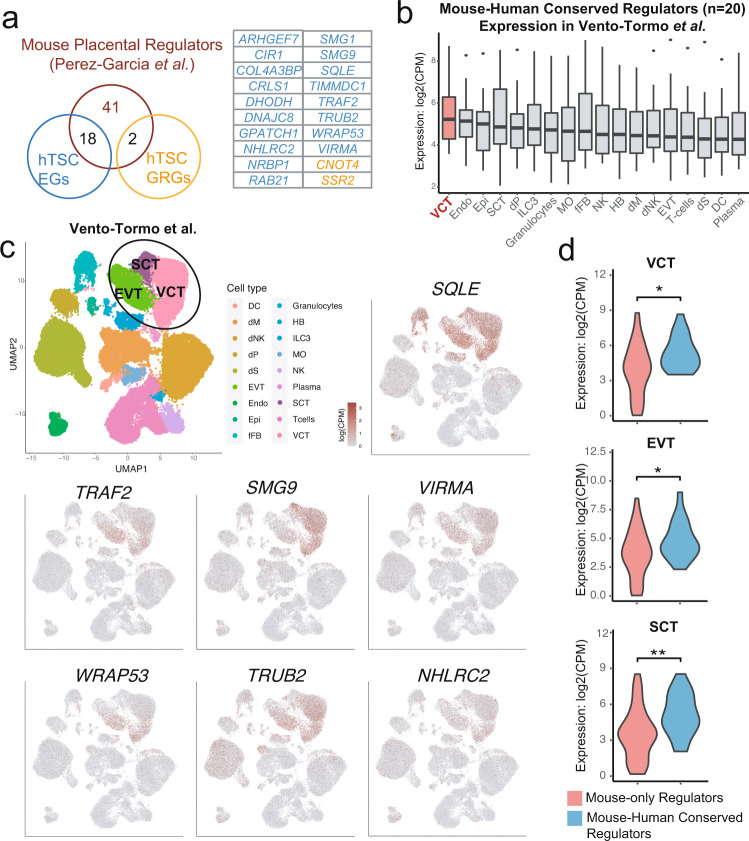
The recent derivation of human trophoblast stem cells (hTSCs) provides a scalable in vitro model system of human placental development, but the molecular regulators of hTSC identity have not been systematically explored thus far. Here, we utilize a genome-wide CRISPR-Cas9 knockout screen to comprehensively identify essential and growth-restricting genes in hTSCs. By cross-referencing our data to those from similar genetic screens performed in other cell types, as well as gene expression data from early human embryos, we define hTSC-specific and -enriched regulators. These include both well-established and previously uncharacterized trophoblast regulators, such as ARID3A, GATA2, and TEAD1 (essential), and GCM1, PTPN14, and TET2 (growth-restricting). Integrated analysis of chromatin accessibility, gene expression, and genome-wide location data reveals that the transcription factor TEAD1 regulates the expression of many trophoblast regulators in hTSCs. In the absence of TEAD1, hTSCs fail to complete faithful differentiation into extravillous trophoblast (EVT) cells and instead show a bias towards syncytiotrophoblast (STB) differentiation, thus indicating that this transcription factor safeguards the bipotent lineage potential of hTSCs. Overall, our study provides a valuable resource for dissecting the molecular regulation of human placental development and diseases.


Conflict of interest statement

The authors declare no competing interests.

Figures

Fig. 1
Fig. 1. A genome-wide CRISPR-Cas9 knockout screen identifies hTSC EGs.
a The experimental scheme of the CRISPR screen. b Flow cytometry analysis for hTSC markers ITGA6 and EGFR in BT5 hTSCs following the CRISPR screen endpoint. c Fold change distribution of sgRNAs targeting core essential and nonessential genes at day 18 of the screen. Note that the Log2 fold change (L2FC) of the core EGs gradually decreased relative to day 6 and day 12, while the L2FC of the nonessential genes largely remained unchanged across different timepoints. d Percentage of essential genes (EGs) identified among all targeted genes. e The mean of sgRNA normalized read counts and Bayes Factors (BFs) of all or selected hTSC EGs and their neighboring up- and downstream genes over time. The results are representative of two independently transduced screening experiments. f Selected GO Biological Processes terms that are significantly enriched among all hTSC EGs. g PCA featuring published AN and H9 primed hPSCs, naïve hPSCs, naïve hTSCs, EVT, and STB RNA-seq samples using the gene expression data of hTSC essential transcription factors.
Fig. 2
Fig. 2. Identification and analysis of hTSC-specific EGs.
a Overlap of hTSC EGs with core and primed hPSC EGs,. b Selected pathways that are significantly enriched among hTSC EGs that overlap with core and primed hPSC EGs. c Selected pathways that are significantly enriched among hTSC-specific EGs. d The expression of 63 CTB-enriched hTSC-specific EGs in the CTB, EPI, and PrE of 10 d.p.f. human embryo scRNA-seq data. e The expression of selected CTB-enriched hTSC-specific EGs in the CTB, EPI, and PrE of human embryo scRNA-seq data. fg Live cell counts relative to the mean of control sgRNA-transduced H9 hTSCs 4 (f) or 6 (g) days after seeding. Error bar represents standard error of three biological replicates. Two-tailed student’s t test was used for statistical analysis. “*” indicates a p-value<0.05, “**” indicates a p-value<0.01, and “***” indicates a p-value<0.001. The exact p-values from left to right are 0.000323207, 0.000310896, 0.004363306, 0.000530435, 0.002394918, and 0.005800072 (f). The exact p-values from left to right are 0.000193944, 0.00015954, 0.005236037, 0.00056065, 0.00285678, and 0.048627293 (g). h Phase contrast images of H9 hTSCs transduced with control or targeting sgRNAs at 4 days following seeding. The scale bars indicate 75 μm. The images are representative of three independent replicates in an experiment. i Experimental scheme to assess the requirement of TEAD1 during hTSC derivation and maintenance. j Phase contrast images of H9 WT and TEAD1 KO hTSCs. The scale bars indicate 75 μm. The images are representative of two independent experiments. k Western blot confirming the absence TEAD1 protein in TEAD1 KO hTSCs. The result is representative of two independent experiments. l Differential gene expression analysis between H9 WT and TEAD1 KO hTSCs. WT contains two samples, and TEAD1 KO contains two samples each from three independent clones. m Selected GO biological processes enriched among DEGs significantly upregulated or downregulated in TEAD1 KO hTSCs relative to WT hTSCs. n Selected GO biological processes enriched among DARs significantly more open or closed in TEAD1 KO hTSCs relative to WT hTSCs. o WT and TEAD1 KO hTSC RNA-seq and ATAC-seq data shown in the vicinity of selected genes.
Fig. 3
Fig. 3. Investigation of TEAD1 targets in hTSCs.
a TEAD1 gene expression in published AN and H9 pluripotent and trophoblast cell types. b Immunofluorescence staining for TEAD1 in H9 hTSCs. The scale bars indicate 75 μm. The experiment was performed once. c Selected TF binding motifs significantly enriched among TEAD1 CUT&Tag peaks and their p-values according to HOMER Motif Analysis. d TEAD1 CUT&Tag peaks overlapping with naïve hPSC or hTSC ATAC-seq peaks were categorized into three groups: those overlapping with hTSC-specific open chromatin regions (OCRs) (group 1), shared OCRs (group 2), or naïve hPSC-specific OCRs (group 3). e Top GO biological processes significantly enriched among group 1 (blue) and group 2 (gray) TEAD1 CUT&Tag peaks and their p-values. f The AN and H9 hTSC ATAC-seq signal over group 1-3 TEAD1 CUT&Tag peaks. g The AN and H9 naïve hPSC ATAC-seq signal over groups 1–3 TEAD1 CUT&Tag peaks. h CUT&Tag and hTSC ATAC-seq signal of group 1-3 TEAD1 CUT&Tag peaks. i Expression of genes in H9 hTSCs, binned by the distance of TEAD1 CUT&Tag peaks to TSS. Two independent samples were used for analysis. Boxplot presents the 25th, median, and 75th quartiles, the whiskers extend 1.5 of interquartile ranges, and the dots are outside values >1.5 times and <3 times the interquartile range beyond either end of the box. jl Percentage of all genes, all TEAD1 target genes, group 1 TEAD1 target genes, and group 2 (excluding those already in group 1) TEAD1 target genes that are significantly up- or downregulated in AN and H9 hTSCs vs. naïve hPSCs (j), hTSCs vs. STBs (k), hTSCs vs EVTs (l). m TEAD1 CUT&Tag and WT and TEAD1 KO hTSC RNA-seq data shown in the vicinity of selected genes. n TEAD1 CUT&Tag and WT and TEAD1 KO hTSC ATAC-seq data shown in the vicinity of selected genes.
Fig. 4
Fig. 4. Investigating the role of TEAD1 in EVT differentiation.
a Experimental scheme to assess the requirement of TEAD1 during EVT and STB differentiation. b Phase contrast images of H9 WT EVTs and TEAD1 KO hTSCs that have undergone EVT differentiation. The scale bars indicate 75 μm. The images are representative of four independent experiments. c The relative number of invading cells following Matrigel invasion assay of H9 WT EVTs and TEAD1 KO hTSCs that have undergone EVT differentiation. Error bars indicate ±1 standard error of five technical replicates. The center of the error bar indicates the mean. One-tailed student’s t test was used for statistical analysis.‘*‘ indicates a p-value <0.05. The exact p-values were 0.028856521 (#1), 0.020949253 (#2), and 0.029918938 (#3). d Principal component analysis (PCA) of WT and TEAD1 KO hTSCs, EVTs, and STBs based on RNA-seq data. e Scatter plot showing the differential gene expression analysis between H9 WT and TEAD1 KO EVTs. WT contains two RNA-seq samples, and TEAD1 KO contains two RNA-seq samples each from three independent clones. f Selected GO biological processes that are enriched among DEGs significantly upregulated or downregulated in TEAD1 KO “EVTs” relative to WT EVTs. g The expression of EVT-specific genes (n = 462) in H9 WT and TEAD1 KO EVTs. WT contains two RNA-seq samples, and TEAD1 KO contains two RNA-seq samples each from three independent clones. Two-tailed Wilcoxon Rank Sum Test was used for statistical analysis. Boxplot presents the 25th, median, and 75th quartiles, the whiskers extend 1.5 of interquartile ranges. h Principal component analysis (PCA) of WT and TEAD1 KO hTSCs, EVTs, and STBs based on ATAC-seq data. i Selected GO biological processes that are enriched among DARs significantly more open or closed (blue) in TEAD1 KO “EVTs” relative to WT EVTs. j WT and TEAD1 KO EVT RNA-seq and ATAC-seq data shown in the vicinity of selected genes. k Levels of WT hTSC and WT and TEAD1 KO EVT ATAC-seq signal over regions that are specifically open in WT EVTs. Each condition contains two ATAC-seq samples.
Fig. 5
Fig. 5. Identification and characterization of hTSC GRGs.
a Growth-restricting genes (GRGs) identified among all targeted genes. b The mean of sgRNA normalized read counts and Log2 fold changes of all or selected hTSC GRGs and their neighboring up- and downstream genes over time. The results are representative of two independently transduced screening experiments. c Top 5 most enriched GO Biological Processes terms among all hTSC GRGs. d Top left, live cell counts relative to the mean of control sgRNA transduced H9 hTSCs 6 days after seeding. Error bar represents the standard error of three biological replicates. Two-tailed student’s t test was used for statistical analysis. “*” indicates a p-value < 0.05, “**” indicates a p-value < 0.01, and “***” indicates a p-value < 0.001. The exact p-values from left to right are 0.000870208, 0.005413584, 0.018757677, and 0.000646371. Rest of the panel, phase contrast images of H9 naïve hTSCs transduced with control or targeting sgRNAs at 6 days following seeding. The scale bars indicate 75 μm. The images are representative of three independent replicates in an experiment. e Heatmap showing the expression of 50 CTB-enriched GRGs in the CTB, EPI, and PrE of published 10 d.p.f. human embryo scRNA-seq data. f Dot plot showing the expression of selected CTB-enriched GRGs in the CTB, EPI, and PrE of published human embryo scRNA-seq data. g Heatmap showing the expression of 33 CTB-depleted GRGs in the CTB, EPI, and PrE of published 10 d.p.f. human embryo scRNA-seq data. h Dot plot showing the expression of selected CTB-depleted GRGs in the CTB, EPI, and PrE of published human embryo scRNA-seq data.
Fig. 6
Fig. 6. Comparison of hTSC EGs and GRGs with genes required for mouse placentation.
a Overlap of hTSC EGs and GRGs with a published list of embryonic lethal genes known to cause placental defects in mouse. b Expression of genes that lead to mouse placentation defects and overlap with hTSC EG/GRG lists (n = 20) in different cell types found in published human maternal-fetal interface scRNA-seq dataset. Cell types were ranked based on mean gene expression. Boxplot presents the 25th, median, and 75th quartiles, the whiskers extend 1.5 of interquartile ranges, and the dots are outside values >1.5 times and <3 times the interquartile range beyond either end of the box. c Expression visualization of selected mouse-human conserved regulators (Fig. 6a) in the human maternal-fetal interface scRNA-seq dataset. d Expression of genes required for mouse placentation that do not (n = 41) and do (n = 20) overlap with hTSC EGs and GRGs in the VCTs (CTBs), EVTs, and SCTs (STBs) of published human maternal-fetal interface scRNA-seq dataset. Two-tailed Wilcoxon Rank Sum Test was used for statistical analysis. ‘*’ indicates a p-value < 0.05 and ‘**’ indicates a p-value < 0.01. The exact p-values are 0.011 (VCT), 0.047 (EVT), and 0.0033 (SCT). VCT: 9479 cells; EVT: 3626 cells; SCT: 1261 cells.

Similar articles

Cited by

References

    1. Shahbazi MN, Zernicka-Goetz M. Deconstructing and reconstructing the mouse and human early embryo. Nat. Cell Biol. 2018;20:878–887. doi: 10.1038/s41556-018-0144-x. - DOI - PubMed
    1. James JL, Carter AM, Chamley LW. Human placentation from nidation to 5 weeks of gestation. Part I: What do we know about formative placental development following implantation? Placenta. 2012;33:327–334. doi: 10.1016/j.placenta.2012.01.020. - DOI - PubMed
    1. Burton Graham J, Fowden Abigail L. The placenta: A multifaceted, transient organ. Philos. Trans. R. Soc. B: Biol. Sci. 2015;370:20140066. doi: 10.1098/rstb.2014.0066. - DOI - PMC - PubMed
    1. Burton GJ, Woods AW, Jauniaux E, Kingdom JC. Rheological and physiological consequences of conversion of the maternal spiral arteries for uteroplacental blood flow during human pregnancy. Placenta. 2009;30:473–482. doi: 10.1016/j.placenta.2009.02.009. - DOI - PMC - PubMed
    1. Norwitz ER. Defective implantation and placentation: Laying the blueprint for pregnancy complications. Reprod. BioMed. Online. 2006;13:591–599. doi: 10.1016/S1472-6483(10)60649-9. - DOI - PubMed

Publication types

Substances