. 2022 May 10;13(1):2545.
doi: 10.1038/s41467-022-30227-5.

Serum metabolome associated with severity of acute traumatic brain injury

Collaborators, Affiliations

Serum metabolome associated with severity of acute traumatic brain injury

Ilias Thomas et al. Nat Commun. .

Abstract

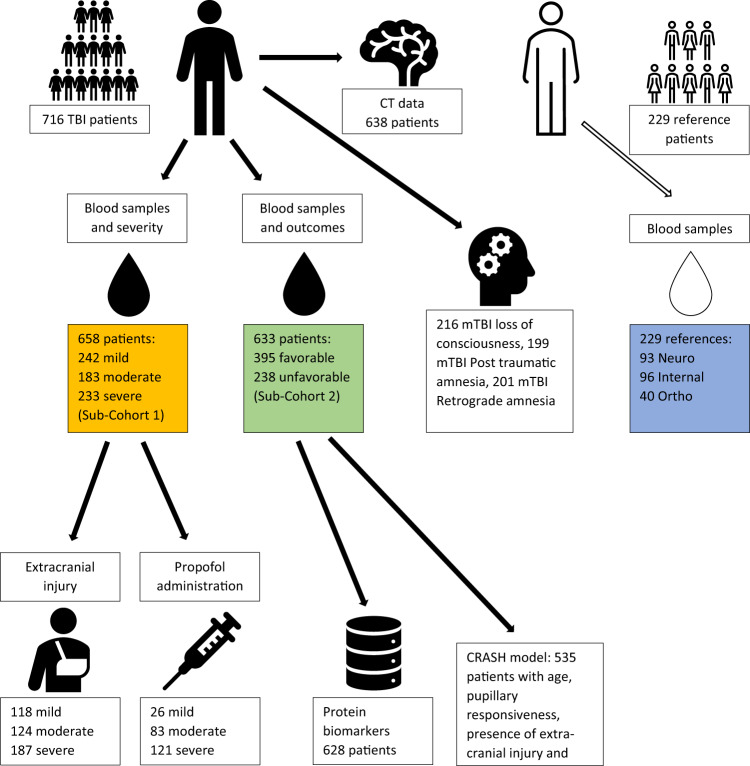
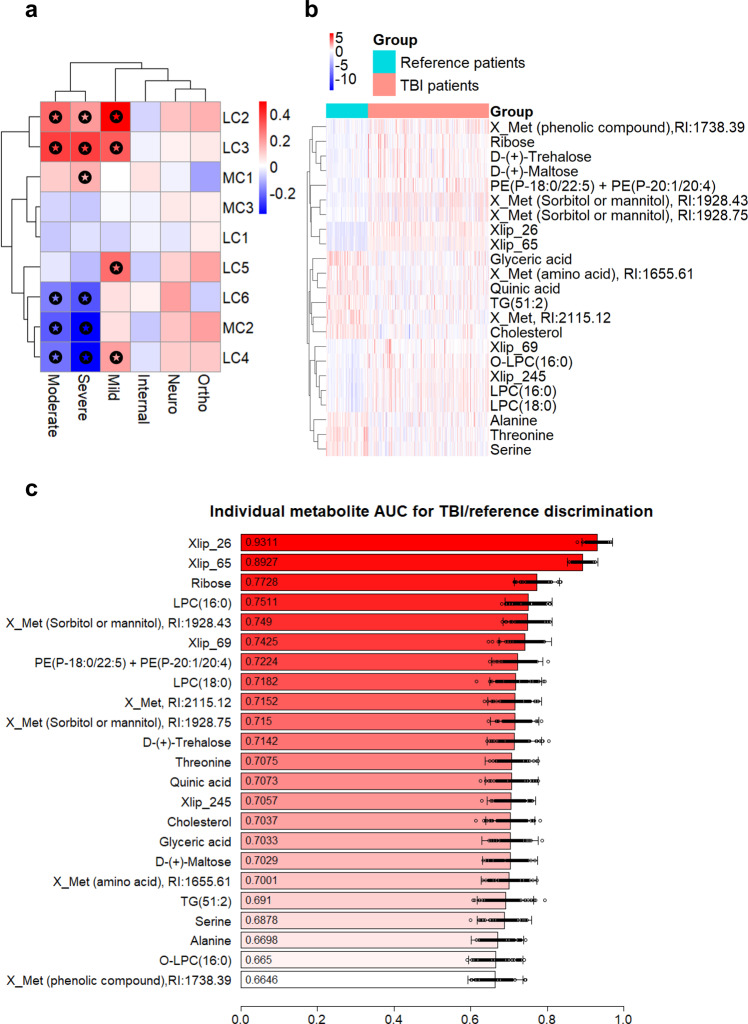
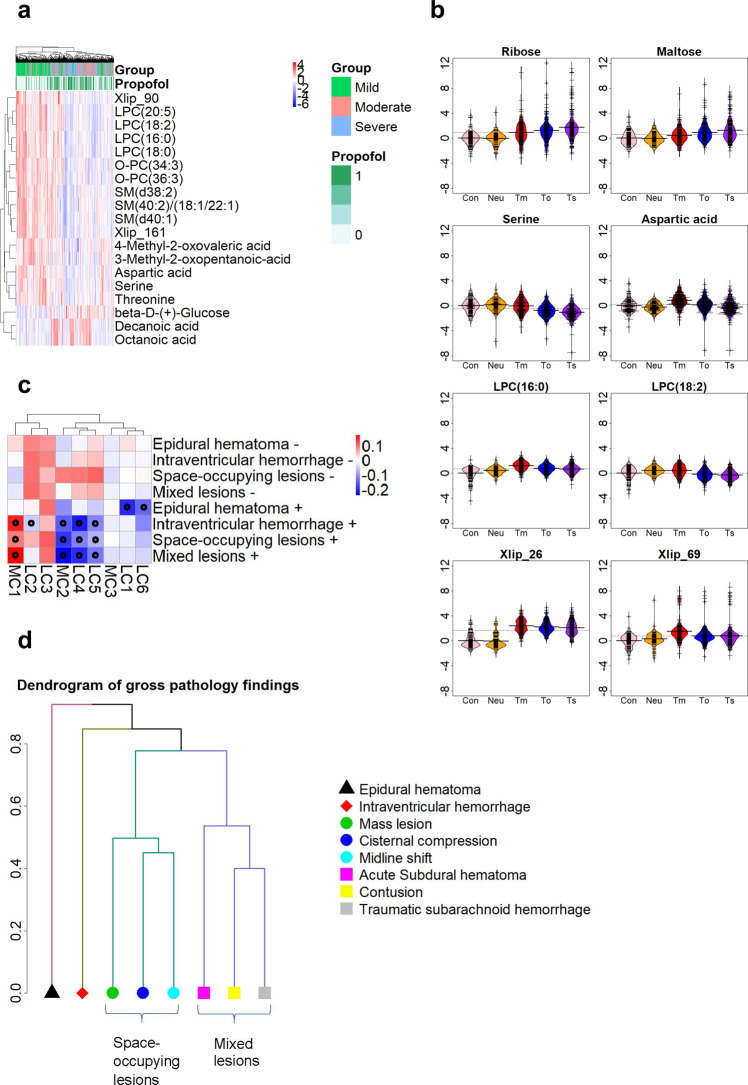
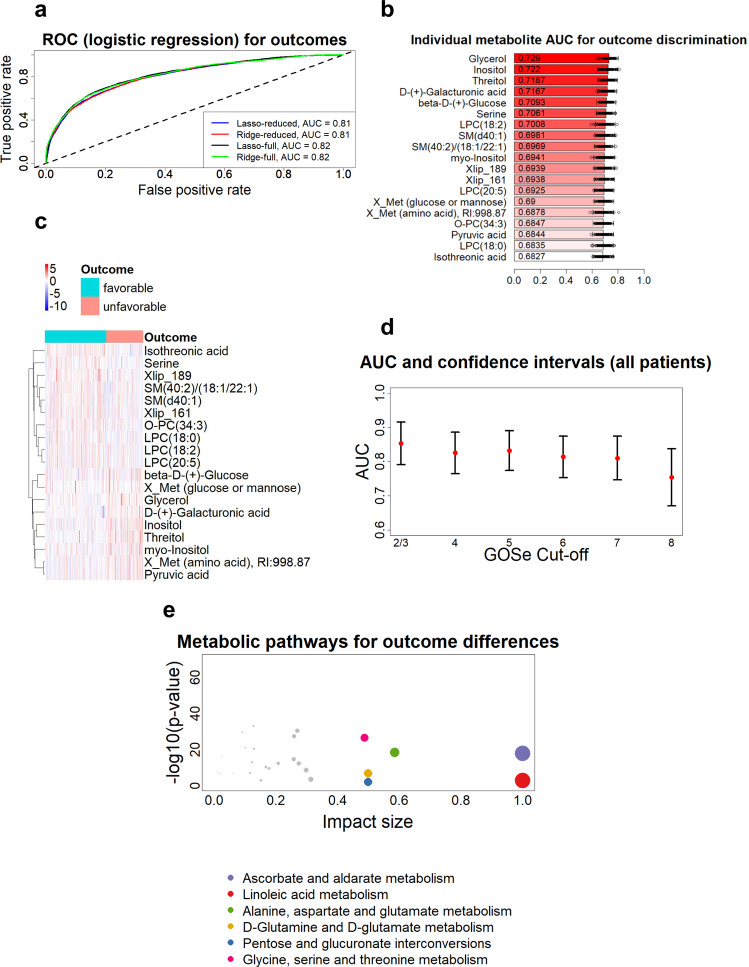
Complex metabolic disruption is a crucial aspect of the pathophysiology of traumatic brain injury (TBI). Associations between this and systemic metabolism and their potential prognostic value are poorly understood. Here, we aimed to describe the serum metabolome (including lipidome) associated with acute TBI within 24 h post-injury, and its relationship to severity of injury and patient outcome. We performed a comprehensive metabolomics study in a cohort of 716 patients with TBI and non-TBI reference patients (orthopedic, internal medicine, and other neurological patients) from the Collaborative European NeuroTrauma Effectiveness Research in Traumatic Brain Injury (CENTER-TBI) cohort. We identified panels of metabolites specifically associated with TBI severity and patient outcomes. Choline phospholipids (lysophosphatidylcholines, ether phosphatidylcholines and sphingomyelins) were inversely associated with TBI severity and were among the strongest predictors of TBI patient outcomes, which was further confirmed in a separate validation dataset of 558 patients. The observed metabolic patterns may reflect different pathophysiological mechanisms, including protective changes of systemic lipid metabolism aiming to maintain lipid homeostasis in the brain.


Conflict of interest statement

The authors declare no competing interests.

Figures

Fig. 1
Fig. 1. The study setting.
Black color denotes TBI patients and white color denotes reference patients. The TBI patients were from all three severity groups (mild, moderate, severe) and the reference patients were from three injury types: internal medicine, orthopedic, and neurological (blue box). The main analysis for severity discrimination was on patients for whom GCS scores were available (sub-cohort 1, yellow box) at baseline evaluation and the main analysis for outcome discrimination was on patients that had GOSe available (sub-cohort 2, green box). Most patients belong in both sub-cohorts. For the TBI-reference patient discrimination analysis data from sub-cohort 1 and the control patients were analyzed (yellow box plus blue box). Further sub-populations were examined from sub-cohorts 1 and 2, based on availability of more refined data (extra-cranial injury, propofol administration, protein biomarkers, and variables necessary for the evaluation of the CRASH model). For the full TBI cohort associations between the metabolomic/lipid levels and CT findings were made. Abbreviations: Neuro, patients with acute stroke or other neurological conditions; Internal, acute internal medicine illnesses (e.g., infections, cardiac symptoms, GI-symptoms) (Internal); Ortho, patients with acute orthopedic or other non-brain traumas; mTBI, mild TBI.
Fig. 2
Fig. 2. Survey of metabolome in TBI patients and controls.
a Polar metabolite (MC) and lipid (LC) clusters across the study groups. Mean of orthopedic and internal medicine controls was used as a reference, and the significant differences between the groups and the reference are marked. b Heatmap of the TBI-reference patient groups and the top 23 metabolites as selected by the overlap of the random forest feature selection and the Welch t test significant feature evaluation. Unknown polar metabolites and lipids are marked as Xmet and Xlip, respectively c Individual discriminatory performance for the top 23 metabolites. Each metabolite was used in a logistic regression model as predictor, with group affinity as response. The performance was averaged on 100 model runs of 70–30% data splits. Data are presented as mean values with the individual run performances as points (n = 100) and aggregated 95% CI.
Fig. 3
Fig. 3. Survey of metabolome in TBI severity and gross pathologies.
a Heatmap of the 19 most important features for discrimination of TBI severity, showing also study group and propofol administration. These features were selected from the overall of the top 30 metabolites from a random forest model and the top 30 metabolites as selected by the Welch F test. b Levels of selected top-ranking metabolites across six study groups. The data were standardized based on the levels of internal medicine and orthopedic patients, denoted as controls. Group abbreviations: Con (control; internal and orthopedic), Neuro (neurological patients, mostly acute stroke), Tm (mild TBI), To (moderate TBI), Ts (severe TBI). c Heatmap of the gross pathologies findings and the 11 metabolite clusters. Boxes with stars denote significant differences between positive and negative findings. d Dendrogram of the clustering results for the gross pathology types from CT. A hierarchical clustering method was applied where a similarity measure between the common combinations was used as the metric for the clustering. The y-axis in the plot denotes the dissimilarity measure based on the Jaccard distance of the difference pathologies, with distance close to 0 being the most similar. Based on these, mass lesion, cisternal compression, and midline shift were grouped in the space-occupying cluster, and acute subdural hematoma, contusion, and traumatic subarachnoid hemorrhage were grouped as the mixed lesions cluster. These clusters are seen in panel c.
Fig. 4
Fig. 4. Prediction of TBI patient outcomes.
a The ROC curves and AUC values of four penalized logistic regression models. Lasso logistic regression and ridge logistic regression were evaluated with two sets of features each. The first set of features was the full metabolomics dataset (459 features). The second set of predictors was the top features as selected by random forest feature selection and Welch t testing (19 features). The curves and AUC values are the average of 100 training/testing folds. b Individual discriminatory performance for the top 19 metabolites. Each metabolite was used in a logistic regression model as predictor, with outcome as response. The performance was averaged on 100 model runs of 70–30% data splits. Data are presented as mean values with the individual run performances as points (n = 100) and aggregated 95% CI. c Heatmap of the top 19 features (also used in the reduced models in panel a), as selected by the random forest and the Welch t test feature selection. GOSe of 1–4 is considered as unfavorable outcome and GOSe of 5–8 as favorable. Overall, patients with favorable outcomes have lower concentration of metabolite/lipid levels, with a notable exception of Glycerol, which is in higher levels in patients with favorable outcomes. d Evaluation of the discriminatory performance of logistic regression models for different cut-offs of GOSe values (1 vs. 2–8, 1–2 vs. 3–8, …. 1–7 vs. 8). The AUC (red points) and CI values are the average of 100 training/testing folds for each cut-off and each severity group. It appears that the accurate discrimination of full recovery (GOSe of 8) is not possible with the metabolomic/lipid dataset. e Pathway analysis using MetaboAnalyst tool. The enriched metabolic pathways are based on differences of serum metabolites between the favorable and unfavorable outcome groups. Only significantly different pathways (FDR corrected p-values from t test) with 2 or more hits are included.

Similar articles

Cited by

References

    1. Majdan M, et al. Epidemiology of traumatic brain injuries in Europe: a cross-sectional analysis. Lancet Public Health. 2016;1:e76–e83. doi: 10.1016/S2468-2667(16)30017-2. - DOI - PubMed
    1. Hyder AA, Wunderlich CA, Puvanachandra P, Gururaj G, Kobusingye OC. The impact of traumatic brain injuries: a global perspective. NeuroRehabilitation. 2007;22:341–353. doi: 10.3233/NRE-2007-22502. - DOI - PubMed
    1. Maas AI, Stocchetti N, Bullock R. Moderate and severe traumatic brain injury in adults. Lancet Neurol. 2008;7:728–741. doi: 10.1016/S1474-4422(08)70164-9. - DOI - PubMed
    1. Saatman KE, et al. Classification of traumatic brain injury for targeted therapies. J. Neurotrauma. 2008;25:719–738. doi: 10.1089/neu.2008.0586. - DOI - PMC - PubMed
    1. MRC Crash Trial Collaborators. et al. Predicting outcome after traumatic brain injury: practical prognostic models based on large cohort of international patients. BMJ. 2008;336:425–429. doi: 10.1136/bmj.39461.643438.25. - DOI - PMC - PubMed

Publication types