. 2022 May 10;13(1):2549.
doi: 10.1038/s41467-022-30237-3.

Environmental cues from neural crest derivatives act as metastatic triggers in an embryonic neuroblastoma model

Affiliations

Environmental cues from neural crest derivatives act as metastatic triggers in an embryonic neuroblastoma model

Dounia Ben Amar et al. Nat Commun. .

Abstract

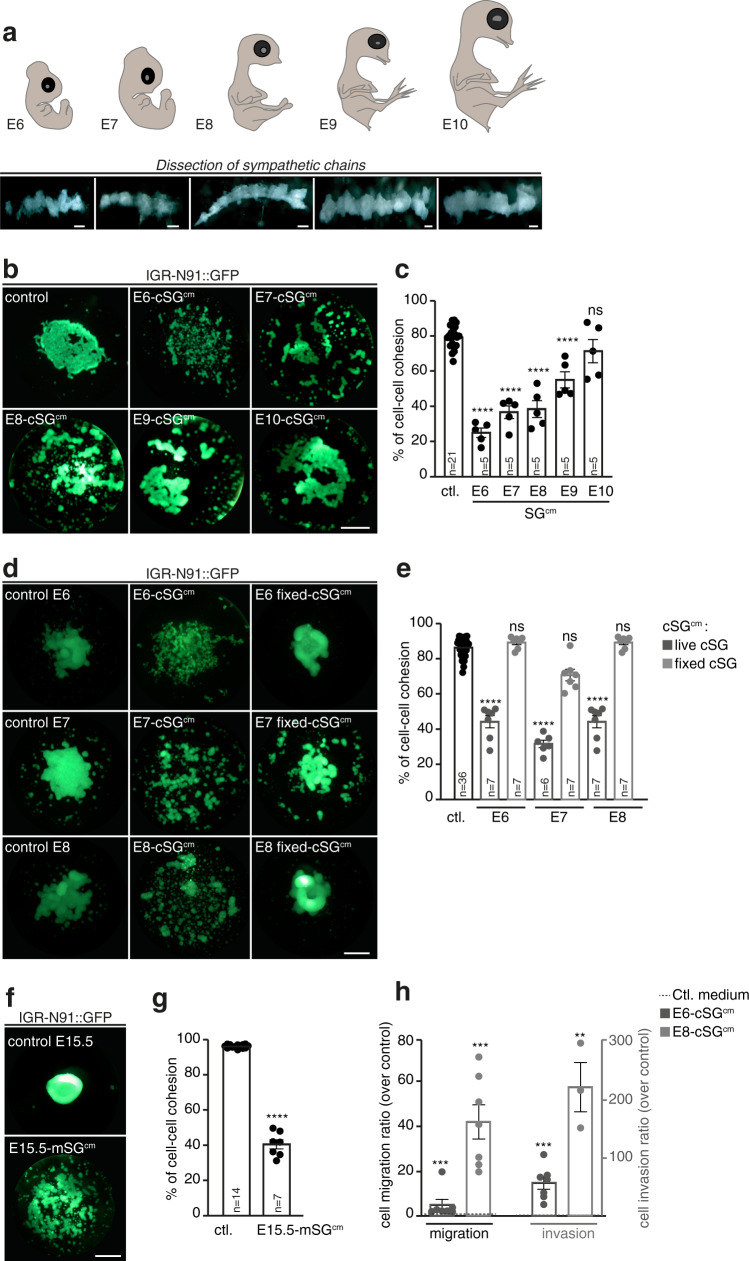
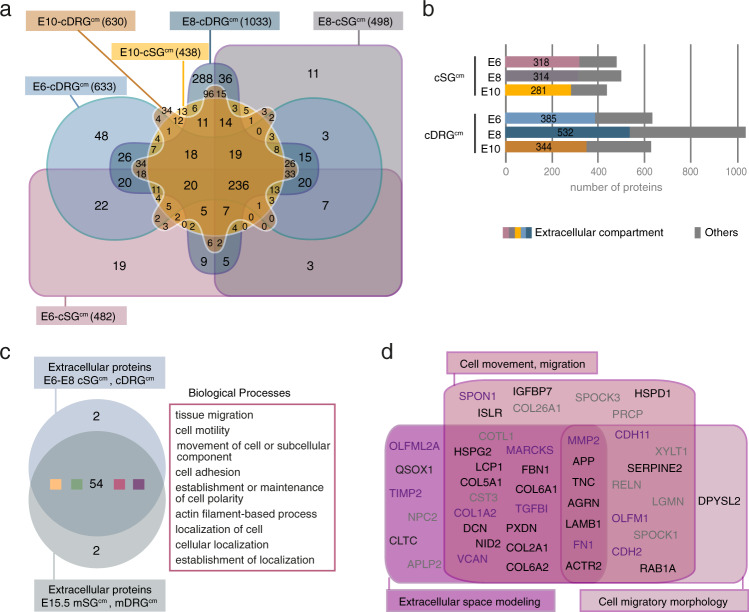
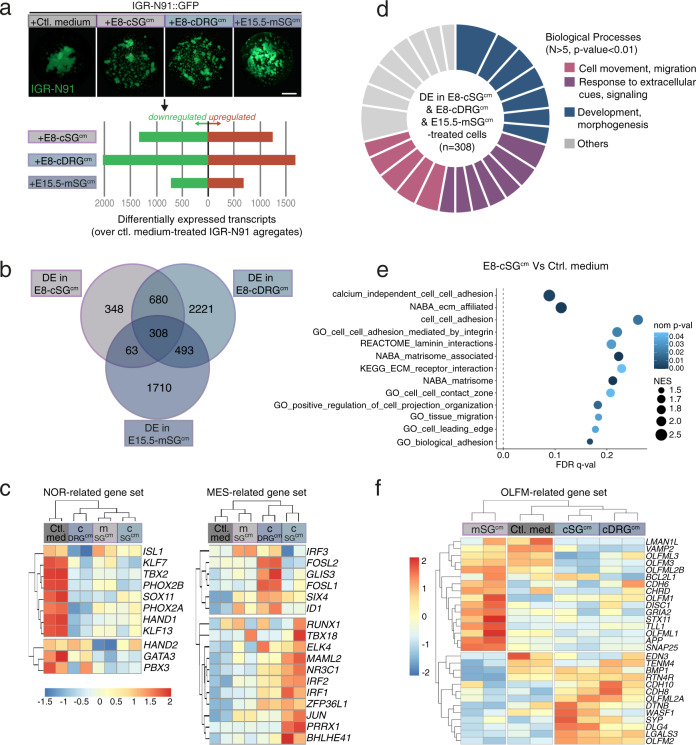
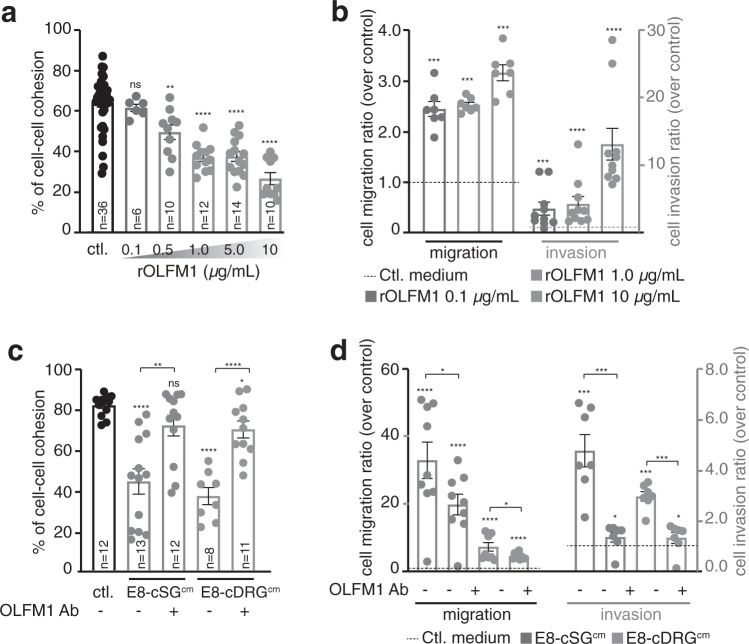
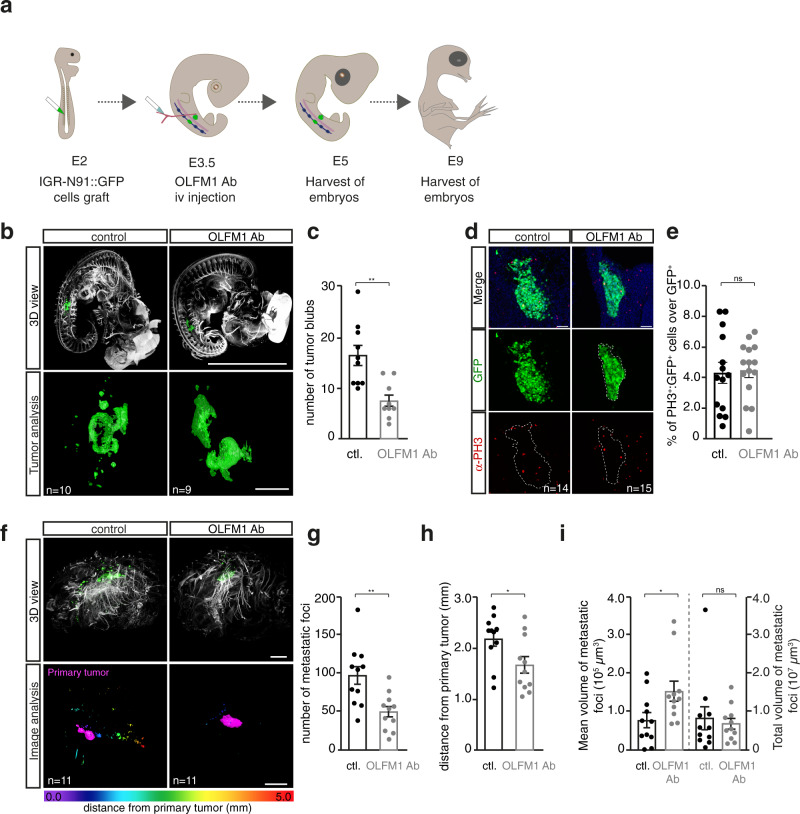
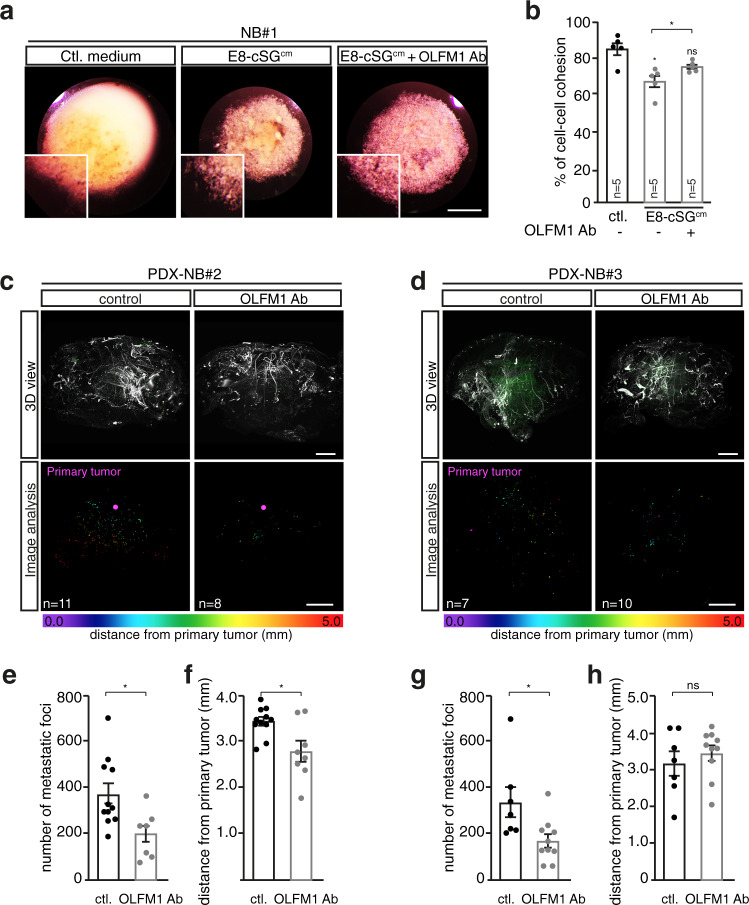
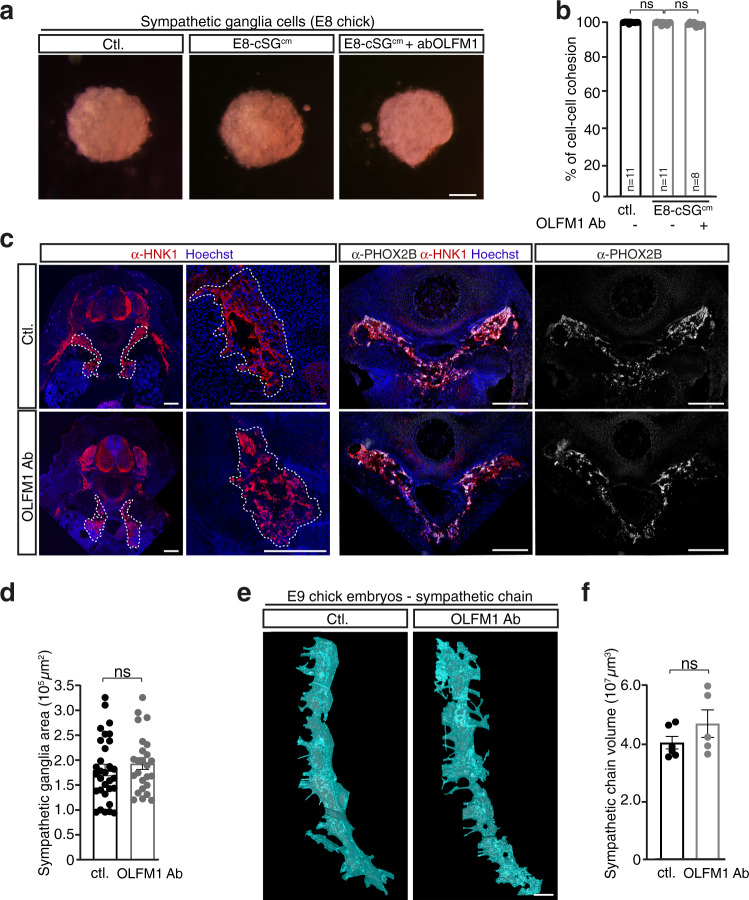
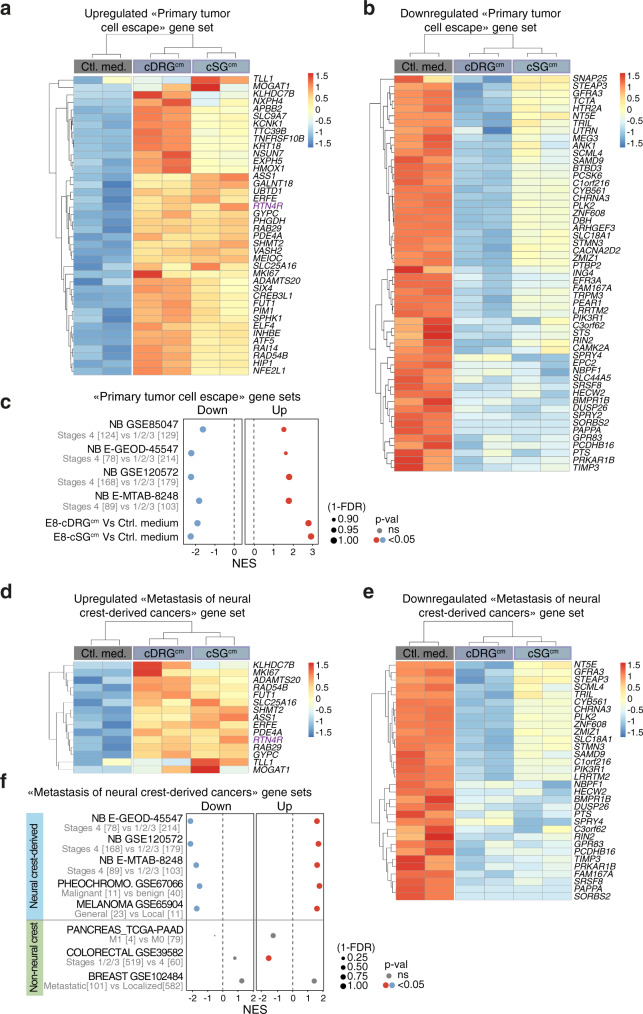
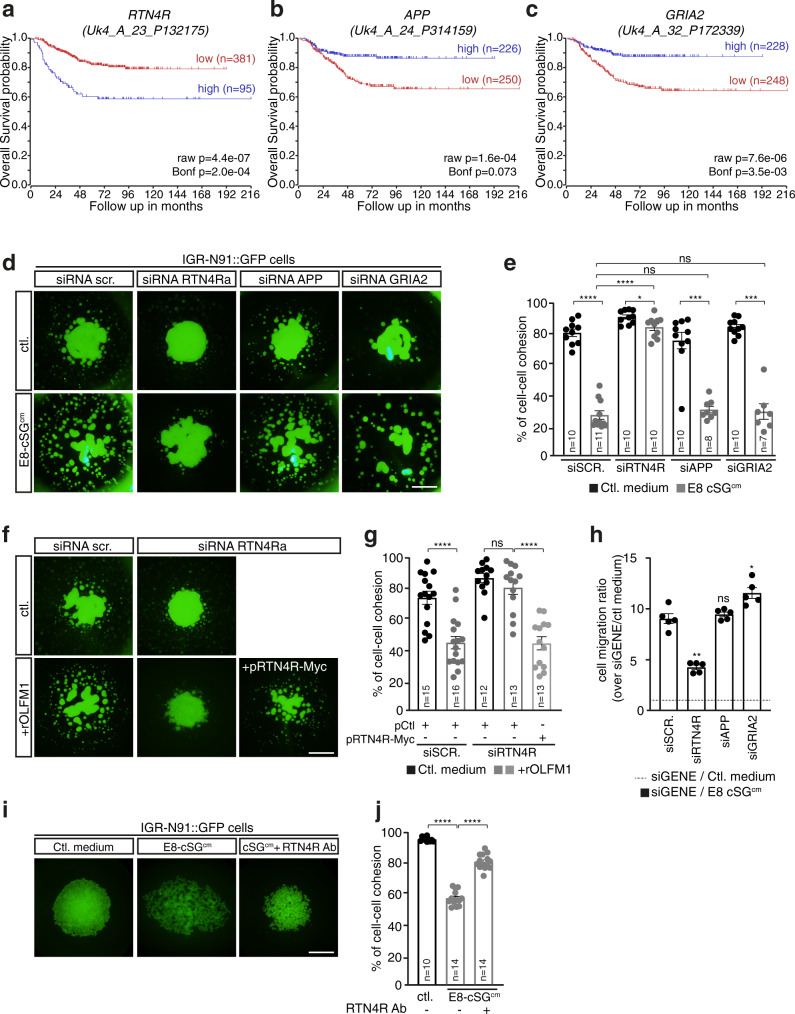
Embryonic malignant transformation is concomitant to organogenesis, often affecting multipotent and migratory progenitors. While lineage relationships between malignant cells and their physiological counterparts are extensively investigated, the contribution of exogenous embryonic signals is not fully known. Neuroblastoma (NB) is a childhood malignancy of the peripheral nervous system arising from the embryonic trunk neural crest (NC) and characterized by heterogeneous and interconvertible tumor cell identities. Here, using experimental models mimicking the embryonic context coupled to proteomic and transcriptomic analyses, we show that signals released by embryonic sympathetic ganglia, including Olfactomedin-1, induce NB cells to shift from a noradrenergic to mesenchymal identity, and to activate a gene program promoting NB metastatic onset and dissemination. From this gene program, we extract a core signature specifically shared by metastatic cancers with NC origin. This reveals non-cell autonomous embryonic contributions regulating the plasticity of NB identities and setting pro-dissemination gene programs common to NC-derived cancers.


Conflict of interest statement

The authors declare no competing interests.

Figures

Fig. 1
Fig. 1. Sympathetic Ganglia conditioned medium (SGcm) induces a decrease in neuroblastoma cell–cell cohesion.
a Illustration of the dissection procedure of chick embryonic sympathetic chains from E6 to E10 developmental stages. Upper panels are schematic representations of chick embryos and lower panels show representative pictures of dissected sympathetic chains. Scale bar: 1 mm. b, c Representative pictures of IGR-N91 cell aggregates (b) and quantification (c) of cell–cell aggregation rate of IGR-N91 cells cultured in hanging drops and treated with E6 to E10-cSGcm, compared to medium without any cultured tissue (ctl.) (N = 5 independent experiments; n: number of aggregates analyzed per condition; two-sided Mann–Whitney U test; comparison to control medium: E6- to E9-cSGcm: p < 0.0001, E10: p = 0.3476). Scale bar: 1 mm. d, e Representative pictures of IGR-N91 cell aggregates (d) and quantification (e) of of cell-cell aggregation rate of IGR-N91 cells cultured in hanging drops and treated with E6 to E8-cSGcm, prepared with live or fixed sympathetic ganglia compared to medium without any cultured tissue (ctl.) (N = 6 independent experiments; n: number of aggregates analyzed per condition; two-sided Mann–Whitney U test; comparison to control medium: E6-, E7-, E8-cSGcm: p < 0.0001, E6 fixed-cSGcm: p = 0.2070, E7 fixed-cSGcm: p = 0.0012, E8 fixed-cSGcm: p = 0.2070). Scale bar: 1 mm. f, g Representative pictures of IGR-N91 cell aggregates (f) and quantification (g) of cell–cell aggregation rate of IGR-N91 cells cultured in hanging drops and treated with E15.5-mSGcm, compared to medium without any cultured tissue (ctl.) (N = 7 independent experiments; n: number of aggregates analyzed per condition; two-sided Mann–Whitney U test; comparison to control medium: p < 0.0001). Scale bar: 1 mm. h Quantification of IGR-N91 cells migration and invasion properties in transwell assays using E6 and E8-cSGcm in the lower part of the device. Ratios over the number of migrating/invading cells in the control condition (medium without any cultured tissue in the lower part) are shown. (N = 7 independent experiments with E6-cSGcm, N = 3 independent experiments with E8-cSGcm; two-sided Mann–Whitney U test; comparison to control medium, migration/invasion: E6-cSGcm: p = 0.0006/p = 0.0006; E8-cSGcm: p = 0.0008/p = 0.0083). Error bars show SEM. Source data are provided as a Source Data file.
Fig. 2
Fig. 2. Sympathetic Ganglia conditioned medium (SGcm) contains a set of proteins involved in cell motility.
a Venn diagram indicating the number of proteins detected in the 6 types of chick conditioned media: E6-, E8- and E10-cSGcm and E6-, E8- and E10-cDRGcm. Samples were analyzed from 2 independent experiments. b Fraction of proteins depicted to have an extracellular localization in each chick conditioned medium. c Venn diagram performed on biological processes items significantly represented in extracellular proteins present in E15.5-mSGcm and in cSGcm and cDRGcm at E6 and E8. Common biological processes related to cell movement and migration are outlined in pink. d Candidate extracellular proteins present in conditioned media triggering NB loss of cell-cell cohesion and extracted from biological processes related to cell motility (items in pink in Supplementary Fig. 3b). In black and purple: proteins or related proteins found in both chick and mouse decohesive conditioned media. In purple, proteins reported in the literature to be involved in neural crest-related processes (see references in Supplementary Fig. 3c).
Fig. 3
Fig. 3. Paraspinal secreted cues trigger NB cells shift in gene programs involved in cell–cell cohesion and motility.
a RNASeq analysis performed on IGR-N91 cell cultured in hanging drops and treated with E8-cSGcm, E8-cDRGcm or E15.5-mSGcm (upper panels). Each condition was duplicated. The number of significantly differentially expressed (DE) transcripts compared to the control condition for each conditioned medium is indicated in the lower panel. Scale bar: 1 mm. b Venn diagram indicating the number of significantly differentially expressed (DE) transcripts compared to the control condition in E8-cSGcm, E8-cDRGcm or E15.5-mSGcm-treated IGR-N91 cell aggregates. c Unsupervised clustering and corresponding heatmap presenting mRNA expression for NOR-related (left panel) and MES-related (right panel) gene sets of IGR-N91 cell aggregates treated with control medium, E8-cSGcm, E8-cDRGcm or E15.5-mSGcm. The z score for each transcript is color-coded. d GO biological processes significantly represented in DE transcripts common to E8-cSGcm, E8-cDRGcm and E15.5-mSGcm-treated IGR-N91 cell aggregates (n = 308 transcripts; N > 5 hits in each biological process related-gene set; hypergeometric test; p < 0.01). Biological processes are color-coded according to 3 major classes: Cell movement & migration; Response to extracellular cues & signaling; Development & morphogenesis. Sectors thickness represents the proportion of hits detected in each GO biological process related-gene set. e Gene Set Enrichment Analysis (GSEA) of a collection of 45 gene signatures related to cell motile behaviors in E8-cSGcm-treated IGR-N91 cell aggregates compared to control. Significantly regulated gene signatures (NES > 1.3; Phenotype-based permutation test, nom p < 0.05; FDR q < 0.25) are presented in a graphical form. f Unsupervised clustering and corresponding heatmap presenting mRNA expression for OLFM-related gene set of IGR-N91 cell aggregates treated with control medium, E8-cSGcm, E8-cDRGcm or E15.5-mSGcm. The z score for each transcript is color-coded.
Fig. 4
Fig. 4. Paraspinal-derived OLFM1 boosts NB metastatic properties in vitro.
a Quantification of cell–cell cohesion rate for IGR-N91 cells treated with increasing doses of recombinant OLFM1 (rOLFM1), compared to control medium (ctl.) (N = 5 independent experiments; n: number of aggregates analyzed per condition; two-sided Mann–Whitney U test; comparison to ctl.: rOLFM1 0.1 µg/mL: p = 0.1308, 0.5 µg/mL: p = 0.0016, 1 µg/mL: p < 0.0001, 5 µg/mL: p < 0.0001, 10 µg/mL: p < 0.0001). b Quantification of IGR-N91 cells migration and invasion in transwell assays with increasing doses of rOLFM1. Ratios over the control condition are shown (N = 7 and N = 10 independent experiments for migration and invasion assays; two-sided Mann–Whitney U test; comparison to ctl.: rOLFM1 0.1 µg/mL: p = 0.0006, 1 µg/mL: p = 0.0006, 10 µg/mL: p = 0.0006 for migration; rOLFM1 0.1 µg/mL: p = 0.0006, 1 µg/mL: p < 0.0001, 10 µg/mL: p < 0.0001 for invasion) c Quantification of cell-cell cohesion rate of IGR-N91 cells treated with E8-cSGcm or E8-cDRGcm supplemented or not with OLFM1 blocking antibody (OLFM1 Ab) (N = 4 independent experiments; n: number of aggregates analyzed per condition; two-sided unpaired t test with Welch’s correction; comparison to ctl: E8-cSGcm: p < 0.0001, E8-cSGcm + OLFM1 Ab: p = 0.0882, E8-cDRGcm: p < 0.0001, E8-cDRGcm + OLFM1 Ab: p = 0.0204; E8-cSGcm vs E8-cSGcm + OLFM1 Ab: p = 0.0024; E8-cDRGcm vs E8-cDRGcm + OLFM1 Ab: p < 0.0001). d Quantification of IGR-N91 cells migration and invasion in transwell assays with E8-cSGcm or E8-cDRGcm supplemented or not with OLFM1 Ab. Ratios over the control condition are shown. (N = 9 independent experiments for migration, two-sided unpaired t test with Welch’s correction; N = 7 independent experiments for invasion, two-sided Mann–Whitney U test; comparison to ctl migration/invasion: E8-cSGcm: p = 0.0004/p = 0.0006, E8-cSGcm + OLFM1 Ab: p = 0.0003/p = 0.0169, E8-cDRGcm: p = 0.0009/p = 0.0006, E8-cDRGcm + OLFM1 Ab: p < 0.0001/p = 0.0169; E8-cSGcm vs E8-cSGcm + OLFM1 Ab: p = 0.0511/p = 0.0006; E8-cDRGcm vs E8-cDRGcm + OLFM1 Ab: p = 0.0486/p = 0.0006).
Fig. 5
Fig. 5. Paraspinal-derived OLFM1 boosts NB metastatic properties in vivo.
a Overview of the in vivo grafting procedure. E: Embryonic day. b 3D-imaging of E5 chick embryo treated or not with OLFM1 Ab and labelled with α-NF160 (nervous tracts) and α-GFP (IGR-N91 cells) antibodies. Scale bar: 250 µm. c Quantification of the mean number of tumor buds detaching from primary tumor masses (n = 10 control and n = 9 OLFM1 Ab-treated embryos; two-sided unpaired t test; p = 0.0016). d, e Representative images (d) and quantification (e) of α-PH3 (mitoses) and α-GFP (IGR-N91 cells) immunofluorescence on cryosections of E5 grafted chick embryos treated or not with OLFM1 Ab. The ratio of PH3+/GFP+ double positive cells over GFP+ cells is quantified (n = 14 slices from 5 control embryos and n = 15 slices from 5 OLFM1 Ab-treated embryos; two-sided unpaired t test, p = 0.8381). Scale bar: 100 µm. f 3D-imaging of E9 chick embryo treated or not with OLFM1 Ab and labelled with α-NF160 and α-GFP (IGR-N91 cells) antibodies (upper panels). Lower panels illustrate identification of the primary tumor (in pink) and metastatic foci color-coded according to their distance to the primary tumor. Scale bar: 1 mm. gi Quantification of the mean number of metastatic foci (g), mean distance of metastatic foci from the primary tumor (h) and volume of metastatic foci (i) in n = 11 control versus n = 11 OLFM1 Ab-treated embryo at E9. In i, mean volume of metastatic foci (left axis) and total volume occupied by metastatic foci (right axis) are presented. Two-sided Mann–Whitney tests were performed. In (g), p = 0.0035; in (h), p = 0.0288; in (i), p = 0.0336 for mean volumes and p = 0.9487 for total volumes of metastatic foci. Error bars show SEM. Source data are provided as a Source Data file.
Fig. 6
Fig. 6. Sympathetic-derived OLFM1 triggers NB patient cells escape from the primary tumor.
a Representative pictures of NB#1-patient cell aggregates treated with E8-cSGcm supplemented or not with OLFM1 blocking antibody (OLFM1 Ab). Scale bar: 1 mm. b Quantification of cell-cell cohesion rate for NB#1-patient dissociated cells, cultured in hanging drops and treated with E8-cSGcm supplemented or not with OLFM1 Ab (N = 5 independent experiments; two-sided Mann–Whitney U test; comparison to ctl: E8-cSGcm: p = 0.0159, E8-cSGcm + OLFM1 Ab: p = 0.0952, E8-cSGcm vs E8-cSGcm + OLFM1 Ab: p = 0.0317). c, d 3D lightsheet confocal imaging of E9 chick embryos grafted with NB#2 (c) or NB#3 (d) patient cells and treated or not with OLFM1 Ab. Embryos were labelled with α-NF160 and α-mito (patient cells) antibodies (upper panels). Lower panels illustrate 3D image analysis with identification of the primary tumor sites (in pink) and metastatic foci color-coded according to their distance to the primary tumor site. Scale bar: 1 mm. eh Quantification of the mean number of metastatic foci (e, g) and mean distance of metastatic foci from the primary tumor site (f, h) in control versus OLFM1 Ab-treated embryo at E9 grafted with NB#2 (e, f; n = 11 control and n = 8 OLFM1 Ab-treated embryos; two-sided unpaired t test; in (e): p = 0.0113, in (f): p = 0.0241) or NB#3 (g, h; n = 7 control and n = 10 OLFM1 Ab-treated embryos; two-sided Mann–Whitney U test; in (g): p = 0.0136, in (h): p = 0.6009) patient cells. Error bars show SEM. Source data are provided as a Source Data file.
Fig. 7
Fig. 7. Blocking sympathetic-derived OLFM1 doesn’t affect the course of sympathetic ganglia cohesion and global morphogenesis.
a Representative pictures of cell aggregates obtained from dissociated E8 chick sympathetic ganglia treated with E8-cSGcm supplemented or not with OLFM1 Ab. Scale bar: 1 mm. b Quantification of cell-cell cohesion rate for dissociated cells from E8 sympathetic ganglionic chains, cultured in hanging drops and treated with E8-cSGcm supplemented or not with OLFM1 Ab compared to control medium (ctl.). (N = 3 independent experiments; n: number of aggregates analyzed per condition; two-sided Mann–Whitney U test; ctl vs E8-cSGcm: p = 0.0991, E8-cSGcm vs E8-cSGcm + OLFM1 Ab: p = 0.1682). c Representative images of α-HNK1 (neural crest-derived cells) and α-Phox2b immunofluorescence on cryosections performed with E5.5 chick embryos treated or not with OLFM1 Ab at E3.5. Scale bar: 200 µm. d Quantification of the mean area covered by sympathetic ganglia labeled with HNK1 immunofluorescent labelling as illustrated in (c) (n = 31 sections from 5 ctl. embryos and n = 25 sections from 5 OLFM1 Ab-treated embryos; two-sided unpaired t test, p = 0.4339). e Representative illustrations of E9 chick sympathetic chains (6 caudal-most sympathetic ganglia) obtained from 3D reconstruction of lightsheet confocal imaging of HNK1 immunostaining performed on E9 chick embryos treated or not at E3.5 with OLFM1 Ab. Scale bar: 200 µm. f Quantification of the mean volume occupied by the 6 caudal most sympathetic ganglia outlined by HNK1 immunostaining in E9 chick embryos treated or not at E3.5 with OLFM1 Ab (e) (n = 6 control and n = 5 OLFM1 Ab-treated embryos; two-sided Mann–Whitney U test; p = 0.2468). Error bars show SEM. Source data are provided as a Source Data file.
Fig. 8
Fig. 8. A primary tumor cell escape gene signature outlines the metastatic features of neural crest-related cancers.
a, b Unsupervised clustering and corresponding heatmap using mRNA expression for upregulated (a) and downregulated (b) “primary tumor cell escape” gene sets in IGR-N91 cell aggregates treated with control medium, E8-cSGcm or E8-cDRGcm. The z-score for each transcript is color-coded. Each experimental condition was sequenced in duplicate. c Scores obtained from enrichment plots analyzing the behavior of the “primary tumor cell escape” gene sets in neuroblastoma cohorts (GSE85047, E-GEOD-45547, GSE120572, E-MTAB-8248) and in E8-cSGcm- and E8-cDRGcm-treated IGR-N91 cell aggregates compared to the control condition. For NB, comparison between loco-regional NBs and stage 4 metastatic NBs are performed (Phenotype-based permutation test, nom p < 0.05; FDR q < 0.25). d, e Unsupervised clustering and corresponding heatmap using mRNA expression for upregulated (d) and downregulated (e) “metastasis of neural crest-derived cancer” gene sets in IGR-N91 cell aggregates treated with control medium, E8-cSGcm or E8-cDRGcm. The z score for each transcript is color-coded. Each experimental condition was sequenced in duplicate. f Scores obtained from enrichment plots analyzing the behavior of “metastasis of neural crest-derived cancer” gene sets in published cohorts of patients having neural crest-related cancers, -ie: neuroblastoma, melanoma or pheochromocytoma or non-neural crest-related cancers -ie: colorectal, breast and pancreatic cancers-. For NB, comparison between loco-regional NBs and stage 4 metastatic NBs are performed in three cohorts (E-GEOD-45547, GSE120572, E-MTAB-8248). For melanoma, local melanomas were compared to general cases (GSE65904). Pheochromocytomas (GSE67066) were confronted according to their benign or malignant phenotype. For colorectal (GSE39582), breast (GSE102484) and pancreatic (TCGA_PAAD) cancers, local versus metastatic cases were confronted (Phenotype-based permutation test, nom p < 0.05; FDR q < 0.25).
Fig. 9
Fig. 9. The OLFM1 receptor RTN4R is functionally involved in NB loss of cell–cell cohesion and migratory response to sympathetic cues.
ac Kaplan–Meier analysis of overall survival probability according to RTN4R (a), APP (b) and GRIA2 (c) expression levels in Shi and Fischer’s published cohort (GEO: GSE62564; http://r2.amc.nl; n = 498 samples). Raw and Bonferroni corrected p values are indicated on the graphs. d, e Representative pictures (d) and quantification of cell–cell cohesion rate (e) of IGR-N91 cell aggregates transfected with a control (siSCR) or a RTN4R siRNA (siRTN4Ra) or an APP siRNA (siAPP) or a GRIA2 siRNA (siGRIA2) and treated with E8-cSGcm (N = 5 independent experiments; n: number of aggregates analyzed per condition; two-sided Mann–Whitney U test; ctl vs E8-cSGcm: siScr: p < 0.0001, siRTN4Ra: p = 0.0272, siAPP: p = 0.0003, siGRIA2: p = 0.0001; comparison to E8-cSGcm/siScr: E8-cSGcm/siRTN4Ra: p < 0.0001, E8-cSGcm/siAPP: p = 0.1343, E8-cSGcm/siAPP: p = 0.8601). f, g Representative pictures (f) and quantification of cell–cell cohesion rate (g) of IGR-N91 cell aggregates transfected with a control (siSCR) or a RTN4R siRNAs (siRTN4Ra, siRTN4Rb) together or not with a vector encoding for human RTN4R (pRTN4R-Myc), and treated with 10 µg/mL rOLFM1 (N = 3 independent experiments; n: number of aggregates analyzed per condition;; two-sided Mann–Whitney U test; ctl vs rOLFM1: siScr: p < 0.0001, siRTN4Ra: p = 0.2455; rOLFM1/siRTN4Ra pCtl vs pRTN4R-Myc: p < 0.0001). h Quantification of IGR-N91 cells migration properties in transwell assays using E8-cSGcm in the lower part of the device. Cells were transfected either with a control (siSCR) or a RTN4R siRNA (siRTN4Ra) or an APP siRNA (siAPP) or a GRIA2 siRNA (siGRIA2). Ratios over the number of migrating cells in the control condition (medium without any cultured tissue in the lower part) are shown (N = 5 independent experiments, two-sided Mann–Whitney U test; comparison to siScr: siRTN4Ra: p = 0.0079, siAPP: p = 0.4206, siGRIA2: p = 0.0159). i, j Representative pictures (i) and quantification of cell-cell cohesion rate (j) of IGR-N91 cell aggregates treated with E8-cSGcm supplemented or not with 50 μg/mL RTN4R antibody (RTN4R Ab) (N = 3 independent experiments; n: number of aggregates analyzed per condition; using two-sided unpaired t test with Welch’s correction; ctl vs E8-cSGcm: p < 0.0001, E8-cSGcm vs E8-cSGcm + RTN4R Ab: p < 0.0001). Error bars show SEM. Scale bar: 1 mm. Source data are provided as a Source Data file.

Similar articles

Cited by

References

    1. Hanahan D, Weinberg RA. The hallmarks of cancer. Cell. 2000;100:57–70. doi: 10.1016/S0092-8674(00)81683-9. - DOI - PubMed
    1. Pietras K, Östman A. Hallmarks of cancer: Interactions with the tumor stroma. Exp. Cell Res. 2010;316:1324–1331. doi: 10.1016/j.yexcr.2010.02.045. - DOI - PubMed
    1. Dong R, et al. Single-cell characterization of malignant phenotypes and developmental trajectories of adrenal neuroblastoma. Cancer Cell. 2020;38:716–733.e6. doi: 10.1016/j.ccell.2020.08.014. - DOI - PubMed
    1. Hanemaaijer, E. S. et al. Single-cell atlas of developing murine adrenal gland reveals relation of Schwann cell precursor signature to neuroblastoma phenotype. Proc. Natl. Acad. Sci. USA118, e2022350118 (2021). - PMC - PubMed
    1. Jansky, S. et al. Single-cell transcriptomic analyses provide insights into the developmental origins of neuroblastoma. Nat. Genet. 10.1038/s41588-021-00806-1 (2021). - PubMed

Publication types