. 2022 May 10;8(1):62.
doi: 10.1038/s41523-022-00426-w.

Mutual exclusivity of ESR1 and TP53 mutations in endocrine resistant metastatic breast cancer

Affiliations

Mutual exclusivity of ESR1 and TP53 mutations in endocrine resistant metastatic breast cancer

Zheqi Li et al. NPJ Breast Cancer. .

Abstract

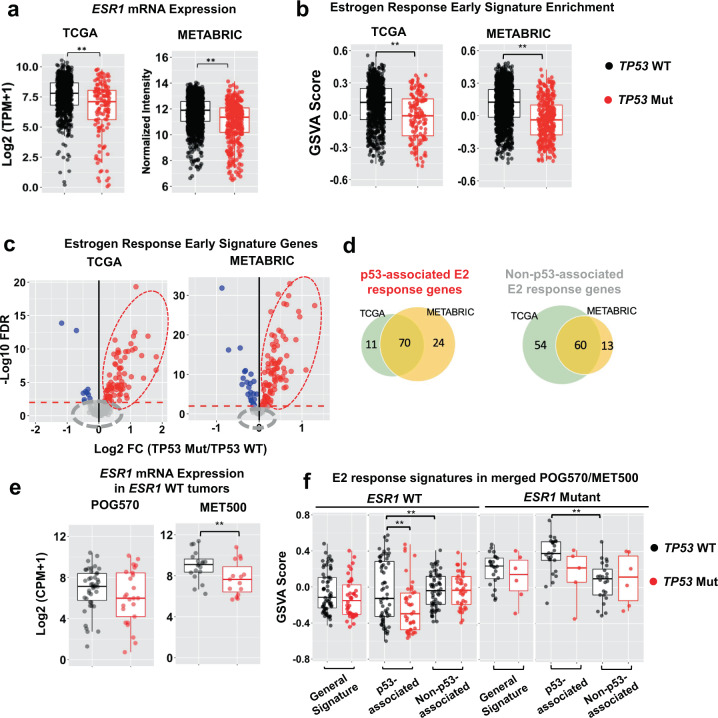
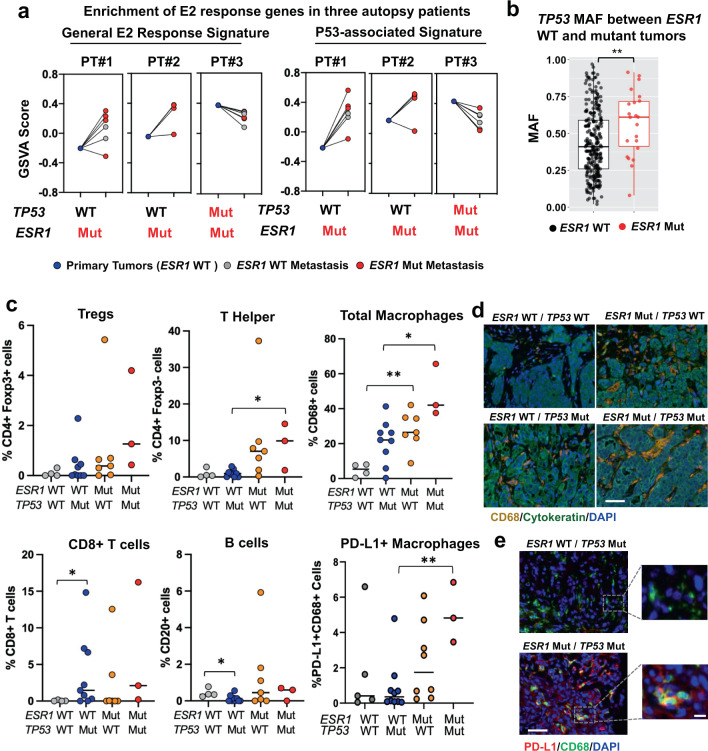
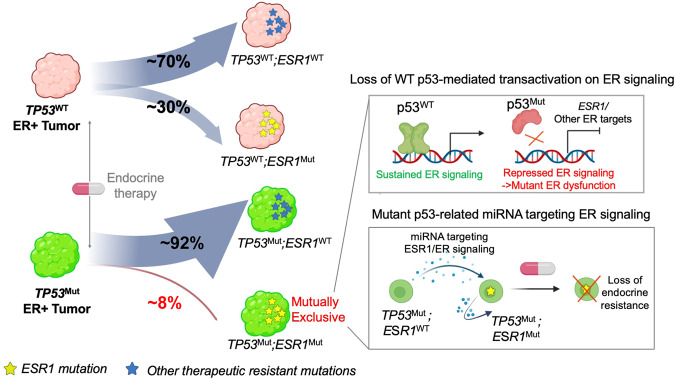
Both TP53 and ESR1 mutations occur frequently in estrogen receptor positive (ER+) metastatic breast cancers (MBC) and their distinct roles in breast cancer tumorigenesis and progression are well appreciated. Recent clinical studies discovered mutual exclusivity between TP53 and ESR1 mutations in metastatic breast cancers; however, mechanisms underlying this intriguing clinical observation remain largely understudied and unknown. Here, we explored the interplay between TP53 and ESR1 mutations using publicly available clinical and experimental data sets. We first confirmed the robust mutational exclusivity using six independent cohorts with 1,056 ER+ MBC samples and found that the exclusivity broadly applies to all ER+ breast tumors regardless of their clinical and distinct mutational features. ESR1 mutant tumors do not exhibit differential p53 pathway activity, whereas we identified attenuated ER activity and expression in TP53 mutant tumors, driven by a p53-associated E2 response gene signature. Further, 81% of these p53-associated E2 response genes are either direct targets of wild-type (WT) p53-regulated transactivation or are mutant p53-associated microRNAs, representing bimodal mechanisms of ER suppression. Lastly, we analyzed the very rare cases with co-occurrences of TP53 and ESR1 mutations and found that their simultaneous presence was also associated with reduced ER activity. In addition, tumors with dual mutations showed higher levels of total and PD-L1 positive macrophages. In summary, our study utilized multiple publicly available sources to explore the mechanism underlying the mutual exclusivity between ESR1 and TP53 mutations, providing further insights and testable hypotheses of the molecular interplay between these two pivotal genes in ER+ MBC.


Conflict of interest statement

All the authors declare no non-financial competing interests. A.V.L. is employee and consultant with UPMC Enterprises, and member of the Scientific Advisory Board, Stockholder and receives compensation from Ocean Genomics. The remaining authors declare no financial competing interests.

Figures

Fig. 1
Fig. 1. ESR1 and TP53 mutations are mutually exclusive in metastatic breast cancer.
a Stacked bar plot representing numbers of ESR1 mutant tumors cross with TP53 WT and mutant subsets among six independent cohorts. Only ER+ metastatic samples were selected for this analysis. Specific numbers of each portion were labeled below. Fisher’s exact test was performed towards each cohort. (**p < 0.01). b Mosaic plot showing the association between ESR1 and TP53 genotype status merged from all six cohorts. Fisher’s exact test was applied. c Forest plot representing the odds ratio of ESR1 and TP53 mutations within each specific subset of comparison. Error bars represent 95% CI. Each comparison utilized the merged data set of all six cohorts indicated above. Fisher’s exact test (two-sided) was used. (*p < 0.05; **p < 0.01). d Dot plot showing the correlation of log10 p values of Fisher’s exact test from each subset analysis to the sample size of each subset. Pearson correlation analysis was performed for all the data points.
Fig. 2
Fig. 2. ESR1 mutations do not affect TP53 expression or TP53 pathway activity in TP53 WT ER + metastatic tumors.
a Box plot showing TP53 mRNA expression between ESR1 WT (n = 19 for MET500; n = 43 for POG570) and mutant (n = 10 for MET500; n = 14 for POG570) in TP53 WT tumors (upper panel) and TP53 mRNA expression between TP53 WT (n = 19 for MET500; n = 43 for POG570) and mutant tumor (n = 15 for MET500; n = 25 for POG570) in ESR1 WT tumors (lower panel) in MET500 and POG570 cohorts. Log2(CPM + 1) values for TP53 gene were extracted from RNA-seq. Box plots span the upper quartile (upper limit), median (center), and lower quartile (lower limit). Whiskers extend a maximum of 1.5× IQR. Mann Whitney U test (two-sided) was applied to each comparison. b Representative images of p53 immunohistochemistry staining of 26 ER+ metastatic tumors from UC cohort. Images were classified by the genotype of ESR1 and TP53. c Dot plots representing p53 IHC quantifications of B in four different groups. Median of each group was indicated. Mann–Whitney U test (two-sided) was used (*p < 0.05; **p < 0.01). d Box plots representing the enrichment levels of four different p53-associated gene signatures between TP53 WT; ESR1 WT (n = 62) and TP53 WT; ESR1 mutant (n = 24) ER+ tumors from merged MET500 and POG570 cohort. Box plots span the upper quartile (upper limit), median (center), and lower quartile (lower limit). Whiskers extend a maximum of 1.5× IQR. Mann–Whitney U test (two-sided) was used.
Fig. 3
Fig. 3. TP53 mutation is inversely correlated with expression of ER-α and a subset of downstream genes.
a, b Box plots representing the expression levels of ESR1 gene (a) or enrichment levels of “Estrogen Response Early” signatures (b) in TP53 WT versus TP53 mutant ER+ primary tumors from TCGA (n = 672 TP53 WT; n = 136 TP53 Mut) and METABRIC (n = 1187 TP53 WT; n = 318 TP53 Mut) cohorts. Box plots span the upper quartile (upper limit), median (center), and lower quartile (lower limit). Whiskers extend a maximum of 1.5X IQR. Mann–Whitney U test (two-sided) was used (**p < 0.01). c Volcano plots showing differentially expressing genes within Estrogen Response Early signature (n = 200) in TP53 mutant tumors versus WT tumors in TCGA and METABRIC breast cancer cohorts. DE genes were selected using the cutoff of FDR < 0.01. Genes that were upregulated, downregulated, or unchanged were labeled in red, blue, and gray respectively. d Venn diagram showing the overlap of mutant p53 positively associated (left panel) or unassociated (right panel) estrogen response genes between TCGA and METABRIC cohorts. The intersected 70 and 60 genes consist of the P53-ER Signature and Non-P53-ER Signature respectively. e Box plots representing the expression levels of ESR1 gene in TP53 WT (n = 19 for MET500; n = 43 for POG570) versus TP53 mutant (n = 15 for MET500; n = 25 for POG570) metastatic tumors in MET500 and POG570 cohorts. Box plots span the upper quartile (upper limit), median (center), and lower quartile (lower limit). Whiskers extend a maximum of 1.5× IQR. Samples were pre-selected for ESR1 WT genotype. Mann–Whitney U test (two-sided) was applied to each cohort (**p < 0.01). f Box plots representing the enrichment levels of general “Estrogen Response Early” signatures, P53-ER Signature, and Non-P53-ER Signature between TP53 WT and mutant tumors in the separate contexts of ESR1 WT (left panel, n = 62 TP53 WT; n = 40 TP53 Mut) and mutant (right panel, n = 24 TP53 WT; n = 6 TP53 Mut) tumors. GSVA scores were combined from MET500 and POG570 cohorts. Box plots span the upper quartile (upper limit), median (center), and lower quartile (lower limit). Whiskers extend a maximum of 1.5X IQR. Mann–Whitney U test (two-sided) was used for each comparison. (*p < 0.05; **p < 0.01).
Fig. 4
Fig. 4. Mutant p53 links to ER repression via loss of transactivation and gain of ER-targeting miRNA.
a Genomic track screen shot of WT p53 binding at ESR1 locus before and after nutlin treatment in MCF7 cells. ChIP-seq data were obtained from GSE86164. b Line plot showing the expressional changes of ESR1 before and after transient TP53 knockdown for 36 h in four TP53 WT ER+ cell lines. Data were downloaded from GSE3178. c Box plot representing the enrichment level of potential ESR1-targeting miRNA set in TP53 WT (n = 457) versus TP53 mutant (n = 87) ER+ primary tumors in TCGA cohort. Box plots span the upper quartile (upper limit), median (center) and lower quartile (lower limit). Whiskers extend a maximum of 1.5X IQR. Mann–Whitney U test (two-sided) was used. (**p < 0.01). d Scattered plot showing the correlation of the ratios between TP53 WT/TP53 Mut tumors of the 70 TP53-ER signature genes between TCGA and METABRIC ER+ tumors. Genes were classified into four groups indicating different association with WT p53 binding (WT p53 ChIP-seq annotated genes, n = 4356 in total) and/or mutant p53-regulated miRNA (Mutant p53 miRNA annotated genes, n = 10,316 in total). Top seven genes were specified with names. e Genomic track screen shot of WT p53 binding (MCF7), GRO-seq signal (MCF7) and ER binding (MCF7/ZR75-1) at TFF1 (left panel) and STC2 (right panel) gene locus. The former two data sets were indicated with or without nutlin treatment. Shared peaks between p53 and ER at proximity of these two genes were highlighted with frames. Data were downloaded from GSE86164, GSE53499, and GSE32222. f Heatmap depicting the overlap percentages of the four p53 ChIP-seq profiles with three independent ER ChIP-seq data sets from GSE32222, GSE75779, and GSE103023. Specific peak numbers of each profile were labeled with the GSE accession numbers. Fisher’s exact test (two-sided) was used to compare overlap ratio of each p53 binding profile with ER and the corresponding randomized regions of the same peak numbers.
Fig. 5
Fig. 5. Tumors with rare co-occurrence of TP53 and ESR1 mutations recapitulate the repression of ER activity by TP53 mutation and exhibit unique immune features.
a Line plots showing the enrichment level alterations of general Estrogen Response Early signature (left panel) and TP53-ER Signature (right panel) from primary to each metastatic tumor of the three individual autopsy patients. Mutations status on specific specimens was indicated below. b Box plot showing the TP53 mutation allele frequencies between ESR1 WT and mutant tumors merged from MSKCC, POG570, MET500, INSERM, and METAMORPH cohorts (ESR1 WT n = 266; ESR1 Mut n = 22). Box plots span the upper quartile (upper limit), median (center), and lower quartile (lower limit). Whiskers extend a maximum of 1.5X IQR. Whitney U test (two-sided) was used. (**p < 0.01). c Dot plots representing the quantification of the abundance of five immune cell subtypes identified from multiplexed fluorescent staining from UC cohorts. Samples were separated based on ESR1 and TP53 genotypes (ESR1 WT/TP53 WT n = 5; ESR1 WT/TP53 Mut n = 10; ESR1 Mut/TP53 WT n = 8; ESR1 Mut/TP53 Mut n = 3). Numbers represent positive cells percentages of non-tumor cells (CK negative) from the field except PD-L1/CD68 dual staining, where number represents positive cells percentage of all cells in the corresponding filed. Median of each group was indicated. Whitney U test (two-sided) was applied for the comparisons between any of the two groups. (*p < 0.05; **p < 0.01). d Representative images showing total macrophages in tumors with different ESR1 and TP53 genotypes from UC cohort. CD68 (orange) is part of a multiplex IF containing panel including CD4 (yellow), Foxp3 (green), CD8 (magenta), CD20 (red), cytokeratin (teal), and DAPI (blue). Images were taken under 20× magnification. Scale bar = 50 μm. e Representative images showing PD-L1 + macrophages dual-IF staining on tumors with TP53 mutation only and ESR1/TP53 mutations. PD-L1 (red) and CD68 (green) were co-stained along with DAPI (blue). Images were taken under 20× magnification. Specific regions were further zoomed in to highlight target cells. Scale bar = 50 μm (left panel) and 5 μm (right panel).
Fig. 6
Fig. 6. Schema of proposed mechanism of TP53-ESR1 mutation mutual exclusivity in ER+ metastatic breast cancer.
In the scenario of TP53 mutations as the primary driver, ER signaling is disrupted by (1) loss of WT p53 transactivation and (2) mutant p53-regulated miRNA. Thus ESR1 mutations are less frequently gained in TP53 mutant tumors. In the case of a non-TP53 mutation serving as the founder, clones acquiring ESR1 mutations could efficiently outgrow under endocrine therapy and result in ESR1 mutant-dominated progression.

Similar articles

Cited by

References

    1. Siegel RL, Miller KD, Fuchs HE, Jemal A. Cancer statistics, 2021. CA: Cancer J. Clin. 2021;71:7–33. - PubMed
    1. Dai X, Cheng H, Bai Z, Li J. Breast cancer cell line classification and its relevance with breast tumor subtyping. J. Cancer. 2017;8:3131. doi: 10.7150/jca.18457. - DOI - PMC - PubMed
    1. Waks AG, Winer EP. Breast cancer treatment: A review. JAMA. 2019;321:288–300. doi: 10.1001/jama.2018.19323. - DOI - PubMed
    1. Hanker AB, Sudhan DR, Arteaga CL. Overcoming endocrine resistance in breast cancer. Cancer Cell. 2020;37:496–513. doi: 10.1016/j.ccell.2020.03.009. - DOI - PMC - PubMed
    1. Rani A, Stebbing J, Giamas G, Murphy J. Endocrine resistance in hormone receptor positive breast cancer—from mechanism to therapy. Front. Endocrinol. 2019;10:245. doi: 10.3389/fendo.2019.00245. - DOI - PMC - PubMed