

Novel mobility index tracks COVID-19 transmission following stay-at-home orders
- PMID: 35538129
- PMCID: PMC9088135
- DOI: 10.1038/s41598-022-10941-2
Novel mobility index tracks COVID-19 transmission following stay-at-home orders
Abstract
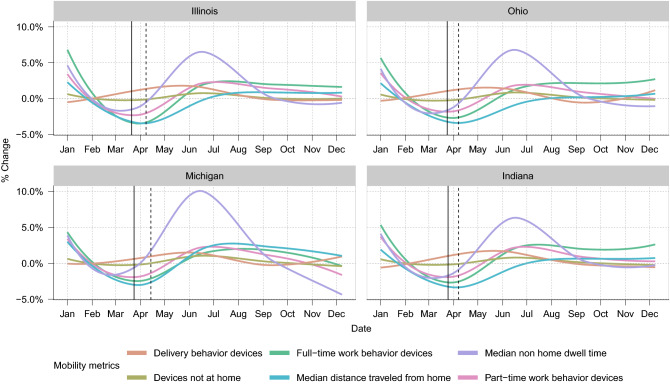
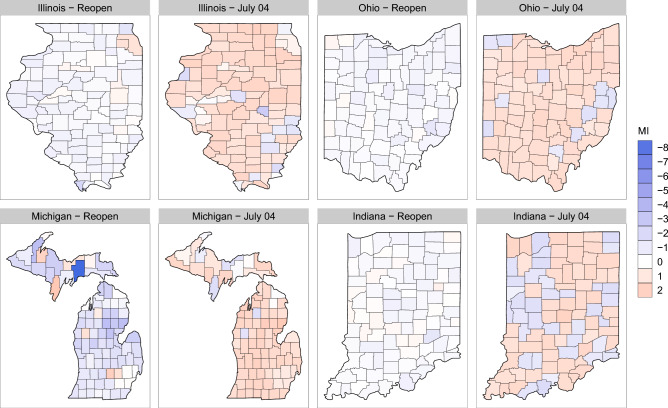
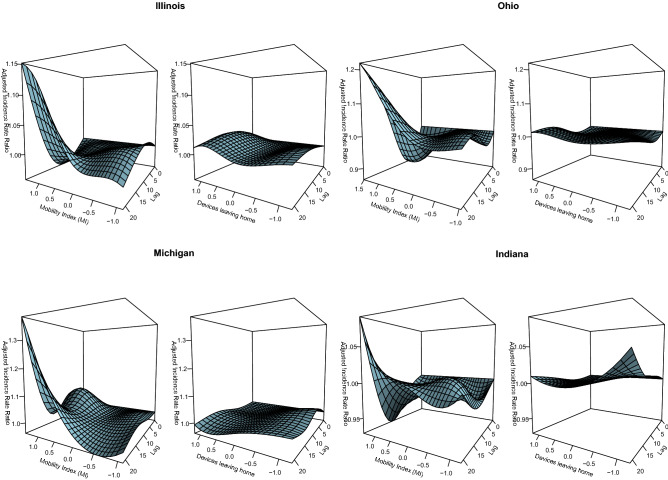
Considering the emergence of SARS-CoV-2 variants and low vaccine access and uptake, minimizing human interactions remains an effective strategy to mitigate the spread of SARS-CoV-2. Using a functional principal component analysis, we created a multidimensional mobility index (MI) using six metrics compiled by SafeGraph from all counties in Illinois, Ohio, Michigan and Indiana between January 1 to December 8, 2020. Changes in mobility were defined as a time-updated 7-day rolling average. Associations between our MI and COVID-19 cases were estimated using a quasi-Poisson hierarchical generalized additive model adjusted for population density and the COVID-19 Community Vulnerability Index. Individual mobility metrics varied significantly by counties and by calendar time. More than 50% of the variability in the data was explained by the first principal component by each state, indicating good dimension reduction. While an individual metric of mobility was not associated with surges of COVID-19, our MI was independently associated with COVID-19 cases in all four states given varying time-lags. Following the expiration of stay-at-home orders, a single metric of mobility was not sensitive enough to capture the complexity of human interactions. Monitoring mobility can be an important public health tool, however, it should be modelled as a multidimensional construct.
© 2022. The Author(s).
Conflict of interest statement
The authors declare no competing interests.
Figures
Similar articles
-
Association between mobility patterns and COVID-19 transmission in the USA: a mathematical modelling study.Lancet Infect Dis. 2020 Nov;20(11):1247-1254. doi: 10.1016/S1473-3099(20)30553-3. Epub 2020 Jul 1. Lancet Infect Dis. 2020. PMID: 32621869 Free PMC article.
-
Impact of the Timing of Stay-at-Home Orders and Mobility Reductions on First-Wave COVID-19 Deaths in US Counties.Am J Epidemiol. 2022 Mar 24;191(5):900-907. doi: 10.1093/aje/kwac027. Am J Epidemiol. 2022. PMID: 35136914 Free PMC article.
-
At-home testing to mitigate community transmission of SARS-CoV-2: protocol for a public health intervention with a nested prospective cohort study.BMC Public Health. 2021 Dec 4;21(1):2209. doi: 10.1186/s12889-021-12007-w. BMC Public Health. 2021. PMID: 34863144 Free PMC article. Clinical Trial.
-
The effect of different COVID-19 public health restrictions on mobility: A systematic review.PLoS One. 2021 Dec 8;16(12):e0260919. doi: 10.1371/journal.pone.0260919. eCollection 2021. PLoS One. 2021. PMID: 34879083 Free PMC article.
-
Nonpharmaceutical public health interventions to curb the COVID-19 pandemic: a narrative review.J Infect Dev Ctries. 2022 Apr 30;16(4):583-591. doi: 10.3855/jidc.14580. J Infect Dev Ctries. 2022. PMID: 35544617 Review.
Cited by
-
Change of urban park usage as a response to the COVID-19 global pandemic.Sci Rep. 2023 Nov 7;13(1):19324. doi: 10.1038/s41598-023-46745-1. Sci Rep. 2023. PMID: 37935778 Free PMC article.
-
Convergence in Mobility Data Sets From Apple, Google, and Meta.JMIR Public Health Surveill. 2023 Jun 22;9:e44286. doi: 10.2196/44286. JMIR Public Health Surveill. 2023. PMID: 37347516 Free PMC article.
-
A Scoping Review and Assessment of the Area-Level Composite Measures That Estimate Social Determinants of Health Across the United States.Public Health Rep. 2025 Jan-Feb;140(1):67-102. doi: 10.1177/00333549241252582. Epub 2024 Jun 19. Public Health Rep. 2025. PMID: 39663655 Free PMC article.
References
-
- Mayo Clinic. U.S. COVID-19 vaccine tracker: See your state’s progress. Retrieved March 8, 2022 from https://www.mayoclinic.org/coronavirus-covid-19/vaccine-tracker (2021).
MeSH terms
Supplementary concepts
LinkOut - more resources
Full Text Sources
Medical
Miscellaneous
