. 2022 May 10;12(1):7668.
doi: 10.1038/s41598-022-11023-z.

Radiobiological effects of wound fluid on breast cancer cell lines and human-derived tumor spheroids in 2D and microfluidic culture

Affiliations

Radiobiological effects of wound fluid on breast cancer cell lines and human-derived tumor spheroids in 2D and microfluidic culture

Shabnam Jeibouei et al. Sci Rep. .

Abstract

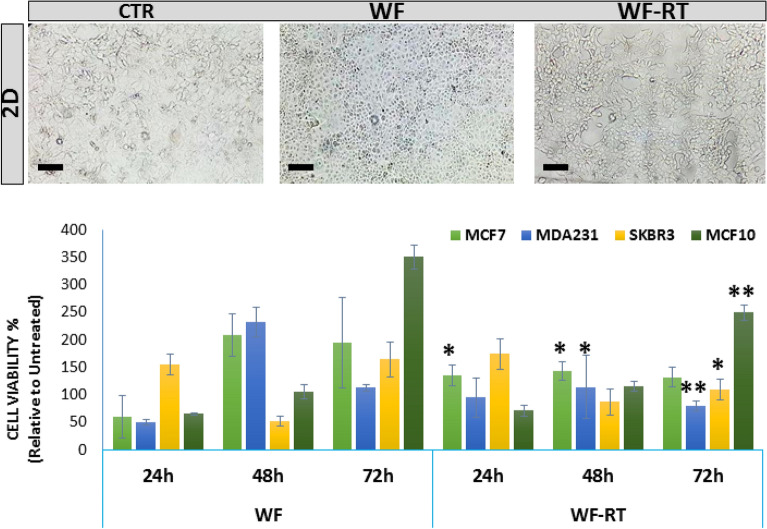
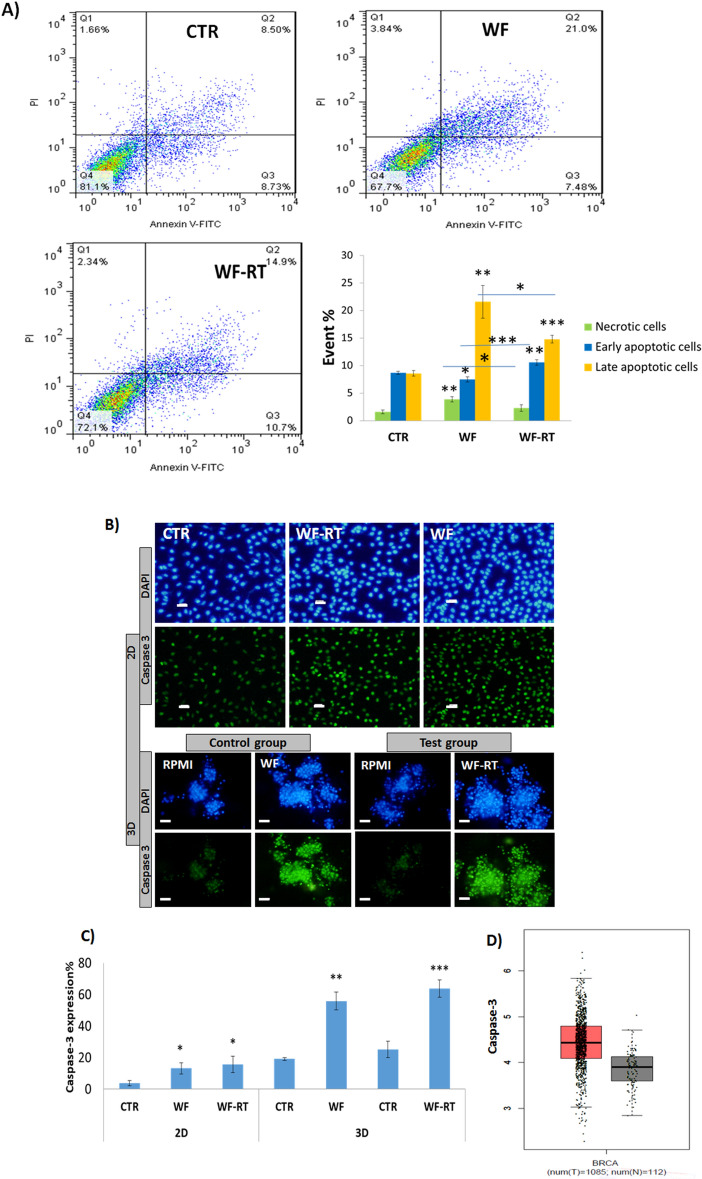
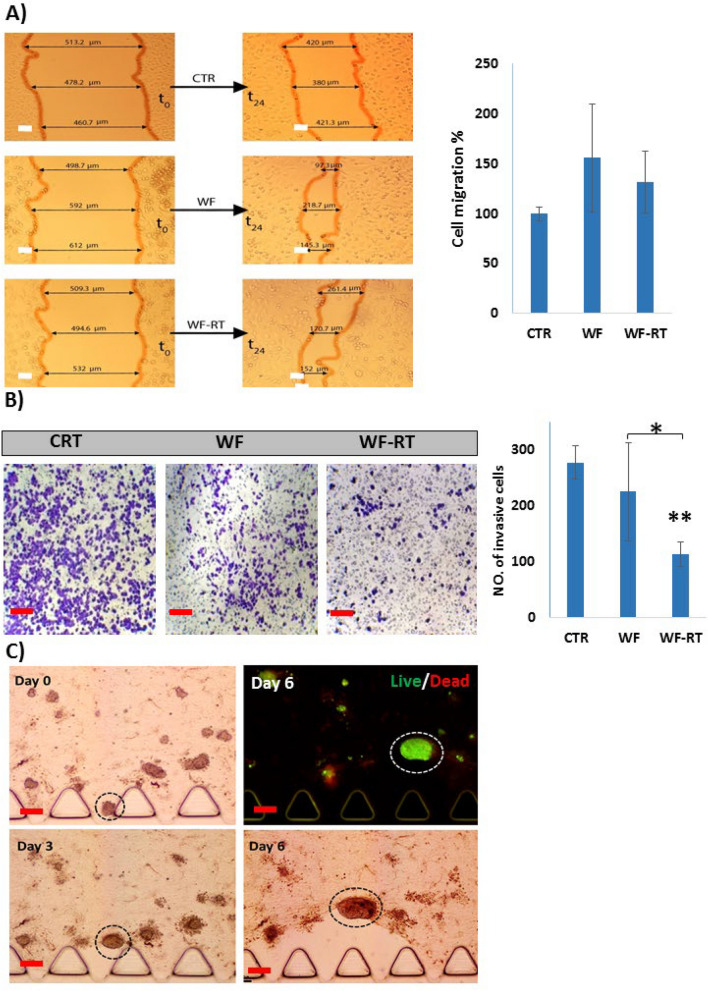
Intraoperative radiotherapy (IORT) could abrogate cancer recurrences, but the underlying mechanisms are unclear. To clarify the effects of IORT-induced wound fluid on tumor progression, we treated breast cancer cell lines and human-derived tumor spheroids in 2D and microfluidic cell culture systems, respectively. The viability, migration, and invasion of the cells under treatment of IORT-induced wound fluid (WF-RT) and the cells under surgery-induced wound fluid (WF) were compared. Our findings showed that cell viability was increased in spheroids under both WF treatments, whereas viability of the cell lines depended on the type of cells and incubation times. Both WFs significantly increased sub-G1 and arrested the cells in G0/G1 phases associated with increased P16 and P21 expression levels. The expression level of Caspase 3 in both cell culture systems and for both WF-treated groups was significantly increased. Furthermore, our results revealed that although the migration was increased in both systems of WF-treated cells compared to cell culture media-treated cells, E-cadherin expression was significantly increased only in the WF-RT group. In conclusion, WF-RT could not effectively inhibit tumor progression in an ex vivo tumor-on-chip model. Moreover, our data suggest that a microfluidic system could be a suitable 3D system to mimic in vivo tumor conditions than 2D cell culture.


Conflict of interest statement

The authors declare no competing interests.

Figures

Figure 1
Figure 1
The graphical abstract of the study. Patients were classified into two groups: the Control group (only surgery) and the Test group (surgery + IORT). 3D experiments: On day 0, (A, B) Mechanically and enzymatically dissociation of the tumor specimens, respectively. (C, D) Filtration of the dissociated specimens using 100 µm and 40 µm cell strainers, respectively. (E) Embedding the spheroids into prepared collagen gel solution. (F) Filling the gel (collagen + spheroids) into the central channels and RPMI + FBS into media channels of the microfluidic devices. On days 1–6, I: Control device whose side channels are loading up with RPMI + FBS. II: Test device whose media channels are loading up with 24 h-wound fluid (WF/WF-RT). Optical imaging and media replacement were accomplished from day 0 to day 6 (RPMI + FBS for control devices and 24 h-wound fluid for test devices). On day 6, Live/Dead staining, immunocytochemistry, and fluorescent imaging. 2D experiments: assays on breast cancer cell lines under 24 h-WF/WF-RT treatment. The figure was created using Biorender (https://biorender.com).
Figure 2
Figure 2
The microscope images and cell viability were obtained by MTT assay for BC cell lines under IORT and non-IORT wound fluid treatment. Breast cancer cells were treated with 10% concentrations of WF/WF-RT for 24, 48, and 72 h, and the inverted light microscopic images were obtained from MCF7 cells treated with WFs and DMEM after 24 h. Data were presented as mean ± SD (n = 12). All treated cells were assessed with their control, including those treated with DMEM without any WFs. The control group is not shown in the graph (cell viability = 100%). WF-RT-treated cells were compared with WF-treated cells for each cell line, and stars represent a significant value. *P < 0.05, and **P < 0.01. CTR control (DMEM + 10% FBS), WF wound fluid, WF-RT IORT-affected wound fluid.
Figure 3
Figure 3
Optical and fluorescent images of spheroids in microfluidic devices on days 0, 1, 3, and 6 of culture. (A) Tumor spheroids are observed with a convert microscope before mixing with collagen at day 0. Scale bar: 100 µm. Original magnification: ×40. (B) Tumor spheroids stained with AO/PI before injection into the microfluidic devices to find spheroid viability on day 0. Scale bar: 100 µm. Original magnification: ×40. (C) The tumor-derived spheroids were treated with WF-RT on days 0, 3, and 6 with inverted phase-contrast microscopy and fluorescent microscopy. Different behaviors of three types of spheroids treated with WF-RT were traced for 6 days and shown with the circular dotted line. White dotted lines show motility of the spheroids during 6 days, while green ones represent the in-situ proliferation of cells within the spheroids and pink ones represent the spheroid without proliferation and motility. Scale bars: 100 µm. Original magnification: ×40. (D) live/dead staining of the spheroids under RPMI treatment comparing wound fluid treatment in a control sample (spheroids from the non-IORT treated patient) and a test sample (spheroids from IORT treated patient). Scale bars: 100 µm. Original magnification: ×40. Green: AO/live cells; Red: PI/dead cells. (E) The graph presents the comparison of %live and %dead cells in control samples with test samples and between RPMI and WF treated cells in each group. Control group: patients who only went under surgery, test group: patients who received IORT during the surgery. CTR control (RPMI + 10%FBS), WF wound fluid, WF-RT IORT-treated wound fluid. ns: non-significant. ***P < 0.001.
Figure 4
Figure 4
Clonogenic survival assays following treatment with WFs. MCF7 cells were treated with WFs from different groups. After 48 h, the compounds were removed, and cells were seeded at a density of 1000 cells for MCF7 on 35 mm plates. After 7 days of incubation, the cells were stained with crystal violet, and the stained plates were scanned. (A) Represents the images of colony density in a 6-well plate. Original magnification: ×40. Scale bars: 50 µm. (B) Images of colony shape. Original magnification: ×40. Scale bars: 100 µm. (C) Quantitative analysis based on colony shapes. Significant value from comparing WF and WF-RT groups with CTR groups has shown with *P < 0.05 and **P < 0.01.
Figure 5
Figure 5
Effect of WFs on the cell cycle distribution of MDA-MD-231 cells. (A) Flow cytometry analysis for treated and untreated MDA-MB-231 cells. (B) Quantitative analysis of cell cycle arrest at the G0/G1 phase. Data represent mean ± SD of triplicate, *P < 0.05, and **P < 0.01. Scale bars: ×100. Original magnification: 10 µm. (C) The graphs represent the expression levels of P16 and P21 in MDA-MB-231 cells. The data represents the means ± standard deviations (SDs) of 3 independent tests. Green = P16 and P21, Red = PI. CTR: control (DMEM + 10%FBS), WF: wound fluid, WF-RT: IORT-treated wound fluid. (D, E) The expression levels of P16 and P21 in breast cancer and normal tissues were analyzed using GEPIA. In the box plots, the thick lines in the middle represent the median, and the upper and lower limits of the box represent the third and first quartiles, respectively. The top and bottom of the error bars represent the maximum and minimum data values, respectively; outliers were considered > 1.5 quartile spacing and excluded. *P < 0.05. T tumor, N normal, num number.
Figure 6
Figure 6
Apoptotic assays in BC cell lines and human-derived tumor spheroids. (A) Annexin V-FITC and PI staining to evaluate apoptosis in MDA-MB-231 cells following WFs treatment. MDA-MB-231 cells were treated with WF-RT (10% in DMEM, for 48 h), incubated with Annexin V-FITC and PI, and analyzed using flow cytometry. In each panel, the lower left quadrant shows cells, which are negative for both PI and Annexin V-FITC, upper left quadrant shows only PI-positive cells, which are necrotic. The lower right quadrant shows Annexin-positive cells (early apoptotic), and the upper right quadrant shows Annexin and PI-positive cells (late apoptosis cells). The percentage of necrotic, early, and late apoptotic cells are represented in the graph. (B) In 2D culture, MDA-MB-231 cells were cultured and treated with WF and WF-RT for 48 h. The expression level of Caspase 3 significantly increased in WF and WF-RT treated cells compared with DMEM-treated cells (CTR). Original magnification: ×40. Scale bars: 10 µm. In 3D culture, human-derived tumor spheroids were cultured and treated with RPMI, WF, and WF-RT for 6 days. The expression level of Caspase 3 in WF and WF-RT-treated cells was significantly increased compared with RPMI-treated cells (CTR). Original magnification: ×100. Scale bars: 50 µm. This increase was more significant in the WF-RT group than others. (C) The graph related to the expression level of Caspase 3 shows no significant difference between the IORT and non-IORT groups. (D) Expression of Caspase-3 in breast cancer and normal tissues analyzed using GEPIA. In the box plot, the thick line in the middle represents the median, and the upper and lower limits of the box represent the third and first quartile, respectively. The top and bottom of the error bars represent the maximum and minimum data values, respectively; outliers were considered > 1.5 quartile spacing and excluded. *P < 0.05, **P < 0.01 and ***P < 0.001. Control group: patients who only went under surgery, test group: patients who received IORT during the surgery. CTR (control): DMEM in 2D/RPMI in 3D, WF: wound fluid, WF-RT: IORT-treated wound fluid, T: tumor; N: normal; num: number.
Figure 7
Figure 7
Effects of WFs on migration and invasion BC cell line (MDA-MB 231) and in human-derived tumor spheroids. (A) Images and graphs related to scratch assay (wound healing compared to negative control in 0 and 24 h). The graph presents the percentage of migrated cells. (B) Images of the cells on the upper chamber in transwell assay and graph present the percentage of cell migration. *P < 0.05, and **P < 0.01. (C) Migration of BC tumor spheroids in microfluidic devices. Circular dotted lines show one of the spheroids that migrate during 6 days of incubation with WF. Scale bars: 100 µm. Original magnifications: ×40.
Figure 8
Figure 8
(A) Association of mRNA expression of E-cad and tumor stages in patients with breast cancer analyzed using GEPIA. In the violin plots, the white dots represent the median; the black bars represent the 95% confidence intervals; the black lines represent the interquartile range, and the gray shapes' width represents the distribution density. F-value, the statistical value of F test; Pr (> F), P-value. (B) Immunocytochemistry analysis of MDA-MB-231 cells following WFs treatment, including the expression levels of E-cadherin in 2D and 3D systems and the average percent of E-cadherin represented in WF and WF-RT and CTR groups. Green: E-cadherin and MMP9, Red: PI. Scale bars: 10 µm in 2D, 50 µm in 3D, magnification: ×100. (C) The expression of MMP-9 in breast cancer and normal tissues were analyzed using GEPIA. In the box plots, the thick line in the middle represents the median, and the upper and lower limits of the box represent the third and first quartile, respectively. The top and bottom of the error bars represent the maximum and minimum values of data, respectively; outliers were considered to be > 1.5 quartile spacing and were excluded. *P < 0.05. T, tumor; N, normal; num, number. (D) In 2D culture, the expression level of MMP-9 significantly increased in both WF and WF-RT treated cells compared to CTR. *P < 0.05, **P < 0.01 and ***P < 0.001. Scale bars: 10 µm. Original magnification: 40X. Control group: patients who only went under surgery, test group: patients who received IORT during the surgery.
Figure 9
Figure 9
Proposed schematic showing direct and bystander effects of WF of IORT. After surgery, tumor spheroids were established to study the tumor behavior in 3D culturing in tumor on-chip. Tumor spheroids contain many cell types, cancer cells, cancer-associated fibroblasts (CAFs), and Tumor-associated macrophages (TAMs). Negative margin exposure to IORT shows the direct effect of radiation that inhibits several signaling pathways that its effect could target the residual cancer cells in the negative margin. Wound fluid (WF) produced in the surgical cavity contains several cytokines, growth factors, and free radicals after IORT, which have a bystander effect. After 24 h of IORT, WF was collected and studied on 3D spheroid and 2D cell culturing that show several biological processes, including arrested cell cycle through free radicals and DNA fragmentation, downregulation of Hsp-90 that stabilized TP-53 in cancer cells, upregulation P21 and P16 that promote cell cycle arrest and finally senescence. Senescence-associated secretory phenotype (SASP) factors also activated pathways to inhibit the cell cycle and activated several biological processes such as apoptosis and senescence. Growth factors were increased to promote the wound healing process in the surgical cavity after IORT and increase proliferation, motility, and migration of some spheroids and cell lines. The figure was created using Biorender (https://biorender.com).

Similar articles

Cited by

References

    1. Bray F, Ferlay J, Soerjomataram I, Siegel RL, Torre LA, Jemal A. Global cancer statistics 2018: GLOBOCAN estimates of incidence and mortality worldwide for 36 cancers in 185 countries. CA Cancer J. Clin. 2018;68(6):394–424. doi: 10.3322/caac.21492. - DOI - PubMed
    1. Fitzmaurice C, Abate D, Abbasi N, Abbastabar H, Abd-Allah F, Abdel-Rahman O, et al. Global, regional, and national cancer incidence, mortality, years of life lost, years lived with disability, and disability-adjusted life-years for 29 cancer groups, 1990 to 2017: A systematic analysis for the global burden of disease study. JAMA Oncol. 2019;5(12):1749–1768. doi: 10.1001/jamaoncol.2019.2996. - DOI - PMC - PubMed
    1. Chowdhry VK, Bushey JA, Kwait RM, Goldberg S, Ritchie J, Ji Y-L, et al. Intraoperative radiation therapy as part of planned monotherapy for early-stage breast cancer. J. Radiat. Oncol. 2018;7(2):167–173. doi: 10.1007/s13566-017-0338-z. - DOI - PMC - PubMed
    1. Lemanski C, Azria D, Thezenas S, Gutowski M, Saint-Aubert B, Rouanet P, et al. Intraoperative radiotherapy given as a boost for early breast cancer: Long-term clinical and cosmetic results. Int. J. Radiat. Oncol. Biol. Phys. 2006;64(5):1410–1415. doi: 10.1016/j.ijrobp.2005.10.025. - DOI - PubMed
    1. Moaiery H, Akbari ME, Nafissi N, Mahdavi SR, Reza H. Intraoperative electron radiotherapy (IOERT) boost versus external beam radiotherapy (EBRT) boost in invasive lobular carcinoma breast cancer cases. Int. J. Cancer Manag. 2018;11(7):e69364. doi: 10.5812/ijcm.69364. - DOI

Publication types