Accumulation and penetration behavior of hypericin in glioma tumor spheroids studied by fluorescence microscopy and confocal fluorescence lifetime imaging microscopy
- PMID: 35538227
- PMCID: PMC9234035
- DOI: 10.1007/s00216-022-04107-2
Accumulation and penetration behavior of hypericin in glioma tumor spheroids studied by fluorescence microscopy and confocal fluorescence lifetime imaging microscopy
Abstract
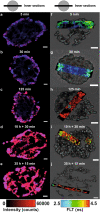
Glioblastoma WHO IV belongs to a group of brain tumors that are still incurable. A promising treatment approach applies photodynamic therapy (PDT) with hypericin as a photosensitizer. To generate a comprehensive understanding of the photosensitizer-tumor interactions, the first part of our study is focused on investigating the distribution and penetration behavior of hypericin in glioma cell spheroids by fluorescence microscopy. In the second part, fluorescence lifetime imaging microscopy (FLIM) was used to correlate fluorescence lifetime (FLT) changes of hypericin to environmental effects inside the spheroids. In this context, 3D tumor spheroids are an excellent model system since they consider 3D cell-cell interactions and the extracellular matrix is similar to tumors in vivo. Our analytical approach considers hypericin as probe molecule for FLIM and as photosensitizer for PDT at the same time, making it possible to directly draw conclusions of the state and location of the drug in a biological system. The knowledge of both state and location of hypericin makes a fundamental understanding of the impact of hypericin PDT in brain tumors possible. Following different incubation conditions, the hypericin distribution in peripheral and central cryosections of the spheroids were analyzed. Both fluorescence microscopy and FLIM revealed a hypericin gradient towards the spheroid core for short incubation periods or small concentrations. On the other hand, a homogeneous hypericin distribution is observed for long incubation times and high concentrations. Especially, the observed FLT change is crucial for the PDT efficiency, since the triplet yield, and hence the O2 activation, is directly proportional to the FLT. Based on the FLT increase inside spheroids, an incubation time > 30 min is required to achieve most suitable conditions for an effective PDT.
Keywords: Fluorescence lifetime; Fluorescence microscopy; Hypericin; Photodynamic therapy; Tumor spheroid.
© 2022. The Author(s).
Conflict of interest statement
The authors declare no competing interests.
Figures


Similar articles
-
Fluorescence lifetime imaging unravels the pathway of glioma cell death upon hypericin-induced photodynamic therapy.RSC Chem Biol. 2024 Oct 8;5(12):1219-31. doi: 10.1039/d4cb00107a. Online ahead of print. RSC Chem Biol. 2024. PMID: 39421718 Free PMC article.
-
Photodynamic therapy of transitional cell carcinoma multicellular tumor spheroids with hypericin.Int J Oncol. 2003 Nov;23(5):1445-50. Int J Oncol. 2003. PMID: 14532989
-
A new valid rhabdomyosarcoma spheroid culture model for in vitro evaluation of hypericin-based photodynamic therapy.Pediatr Blood Cancer. 2022 Aug;69(8):e29482. doi: 10.1002/pbc.29482. Epub 2021 Dec 10. Pediatr Blood Cancer. 2022. PMID: 34889033
-
Hypericin as a potential phototherapeutic agent in superficial transitional cell carcinoma of the bladder.Photochem Photobiol Sci. 2004 Aug;3(8):772-80. doi: 10.1039/b315586b. Epub 2004 Apr 2. Photochem Photobiol Sci. 2004. PMID: 15295634 Review.
-
Hypericin in photobiological assays: An overview.Photodiagnosis Photodyn Ther. 2021 Sep;35:102343. doi: 10.1016/j.pdpdt.2021.102343. Epub 2021 May 24. Photodiagnosis Photodyn Ther. 2021. PMID: 34038765 Review.
Cited by
-
Fluorescence lifetime imaging unravels the pathway of glioma cell death upon hypericin-induced photodynamic therapy.RSC Chem Biol. 2024 Oct 8;5(12):1219-31. doi: 10.1039/d4cb00107a. Online ahead of print. RSC Chem Biol. 2024. PMID: 39421718 Free PMC article.
-
The Activity of 1,8-Dihydroanthraquinone Derivatives in Nervous System Cancers.Molecules. 2024 Dec 19;29(24):5989. doi: 10.3390/molecules29245989. Molecules. 2024. PMID: 39770078 Free PMC article. Review.
-
Cell-Based Glioma Models for Anticancer Drug Screening: From Conventional Adherent Cell Cultures to Tumor-Specific Three-Dimensional Constructs.Cells. 2024 Dec 17;13(24):2085. doi: 10.3390/cells13242085. Cells. 2024. PMID: 39768176 Free PMC article. Review.
-
Spheroidal Model of SKBR3 and U87MG Cancer Cells for Live Imaging of Caspase-3 during Apoptosis Induced by Singlet Oxygen in Photodynamic Therapy.Biomedicines. 2022 Aug 31;10(9):2141. doi: 10.3390/biomedicines10092141. Biomedicines. 2022. PMID: 36140241 Free PMC article.
-
Detection of a Water-Soluble Hypericin Formulation in Glioblastoma Tissue with Fluorescence Lifetime and Intensity Using a Dual-Tap CMOS Camera System.Diagnostics (Basel). 2024 Oct 30;14(21):2423. doi: 10.3390/diagnostics14212423. Diagnostics (Basel). 2024. PMID: 39518390 Free PMC article.
References
-
- Liu Q, Wackenhut F, Wang L, Hauler O, Roldao JC, Adam P-M, Brecht M, Gierschner J, Meixner AJ. Direct observation of structural heterogeneity and tautomerization of single hypericin molecules. The Journal of Physical Chemistry Letters. 2021;12(3):1025–1031. doi: 10.1021/acs.jpclett.0c03459. - DOI - PubMed
MeSH terms
Substances
LinkOut - more resources
Full Text Sources
Medical

