. 2022 Jul;28(7):1476-1485.
doi: 10.1038/s41591-022-01807-1. Epub 2022 May 10.

Spatial and temporal fluctuations in COVID-19 fatality rates in Brazilian hospitals

Affiliations

Spatial and temporal fluctuations in COVID-19 fatality rates in Brazilian hospitals

Andrea Brizzi et al. Nat Med. 2022 Jul.

Erratum in

  • Author Correction: Spatial and temporal fluctuations in COVID-19 fatality rates in Brazilian hospitals.
    Brizzi A, Whittaker C, Servo LMS, Hawryluk I, Prete CA Jr, de Souza WM, Aguiar RS, Araujo LJT, Bastos LS, Blenkinsop A, Buss LF, Candido D, Castro MC, Costa SF, Croda J, de Souza Santos AA, Dye C, Flaxman S, Fonseca PLC, Geddes VEV, Gutierrez B, Lemey P, Levin AS, Mellan T, Bonfim DM, Miscouridou X, Mishra S, Monod M, Moreira FRR, Nelson B, Pereira RHM, Ranzani O, Schnekenberg RP, Semenova E, Sonabend R, Souza RP, Xi X, Sabino EC, Faria NR, Bhatt S, Ratmann O. Brizzi A, et al. Nat Med. 2022 Jul;28(7):1509. doi: 10.1038/s41591-022-01939-4. Nat Med. 2022. PMID: 35835884 Free PMC article. No abstract available.

Abstract

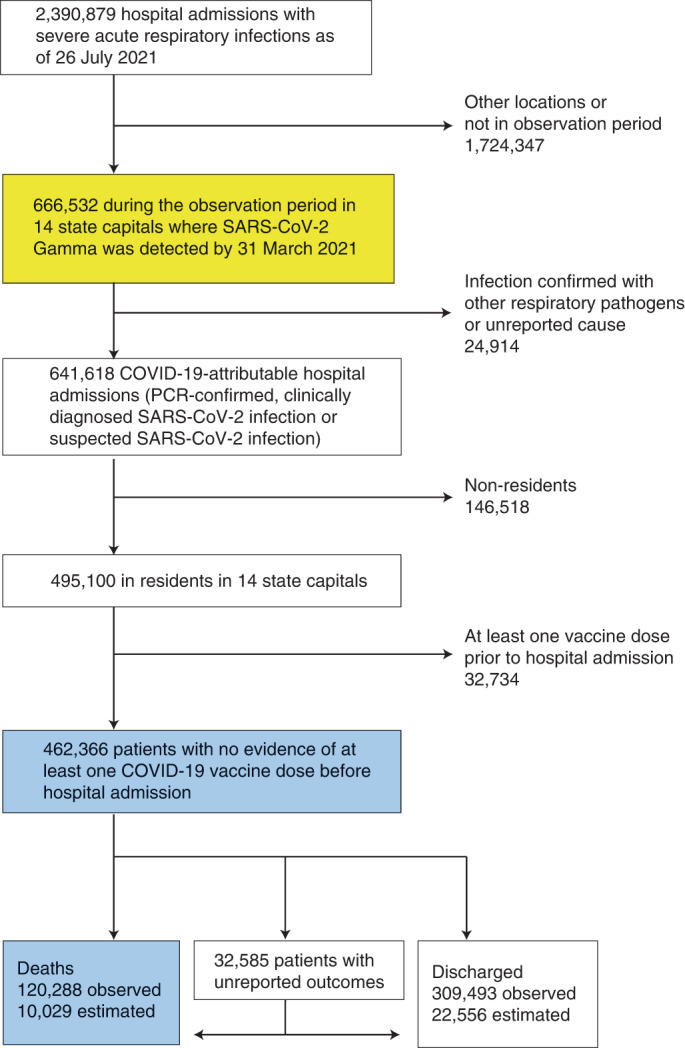
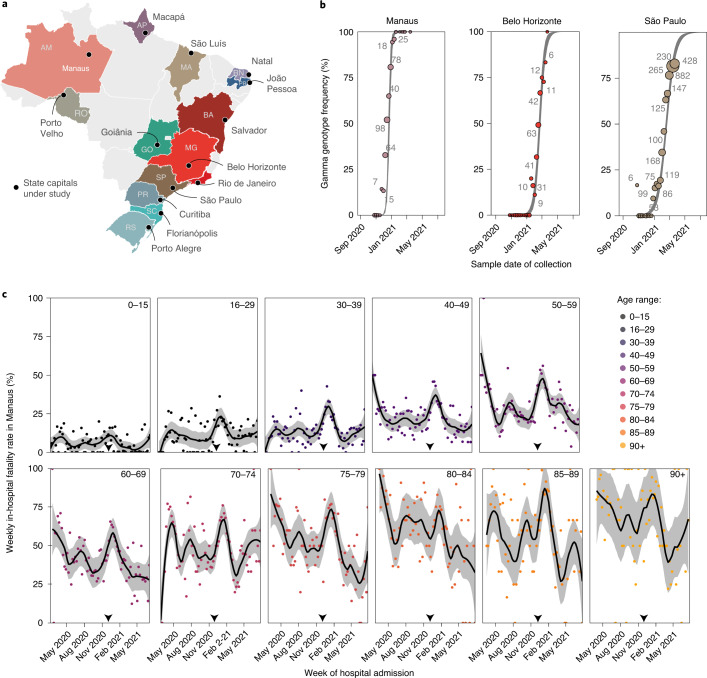
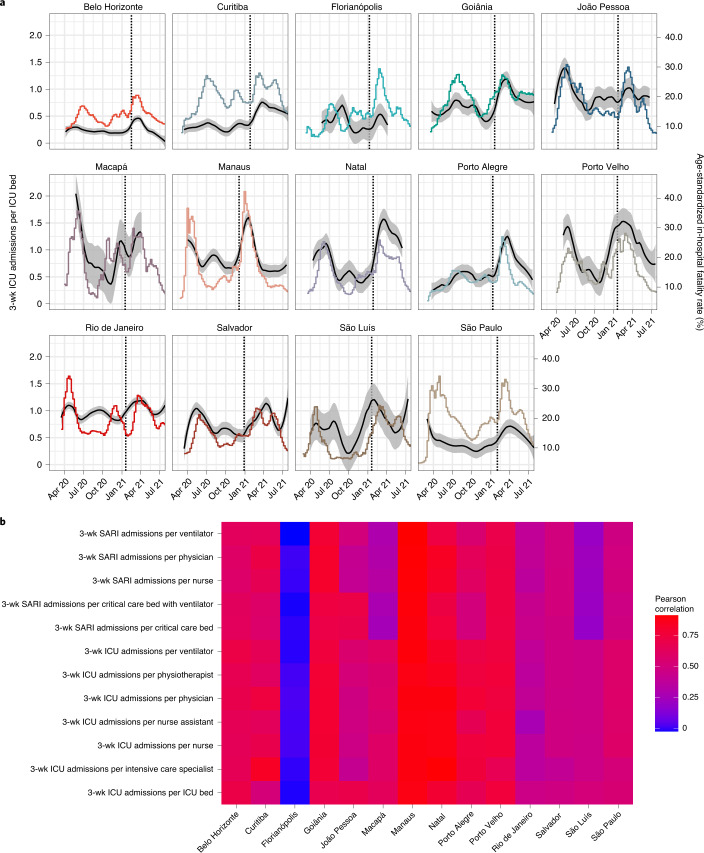
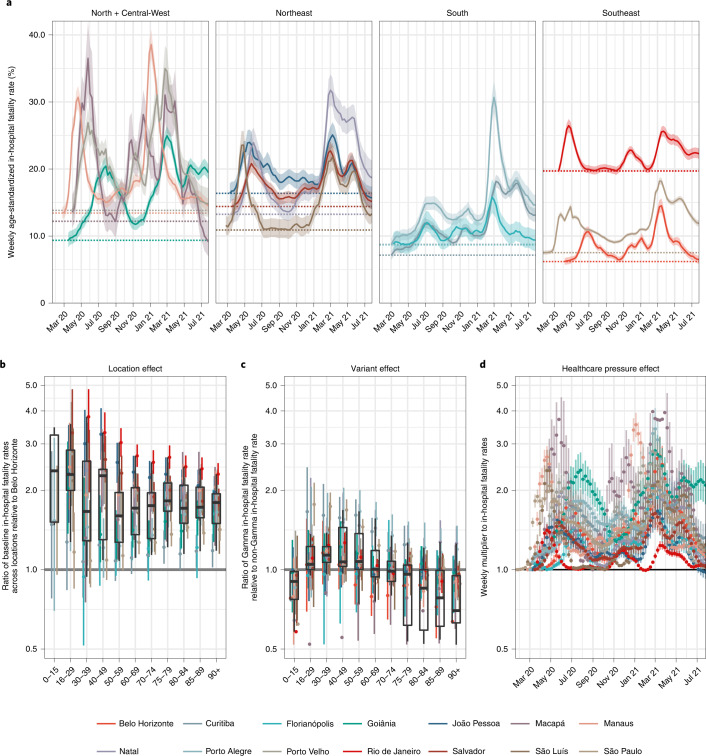
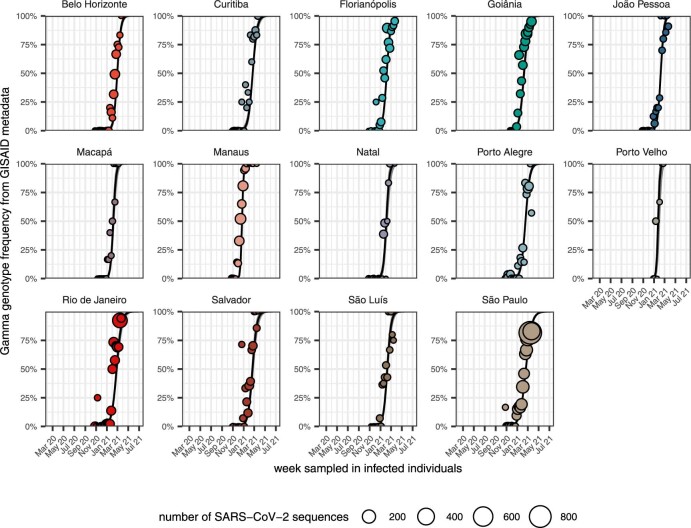
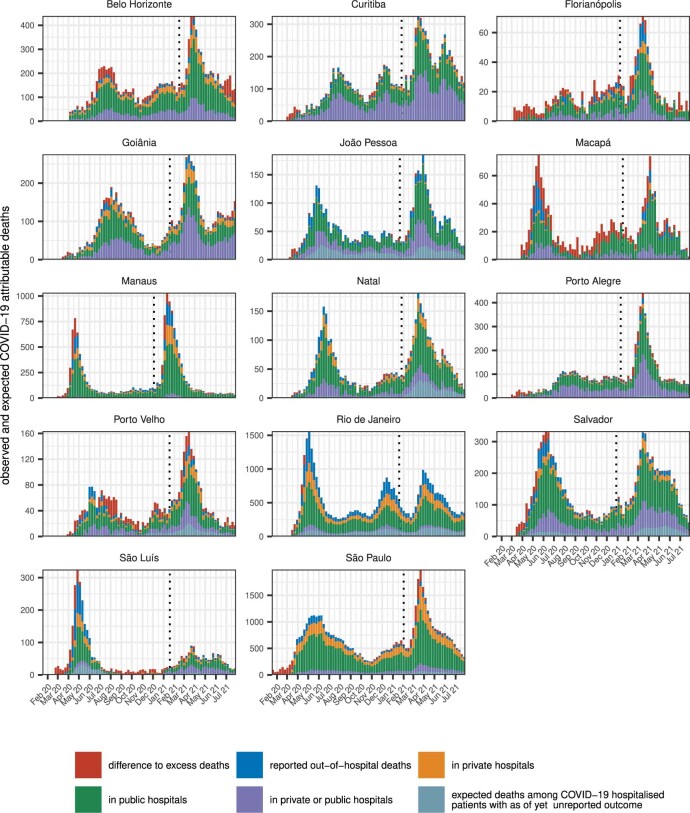
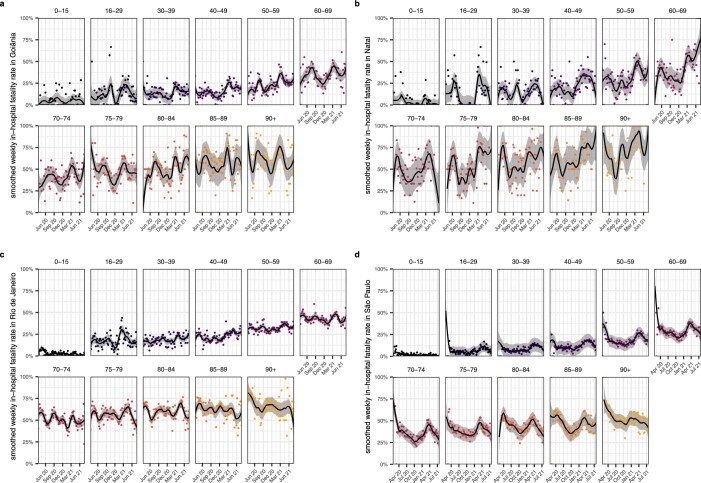
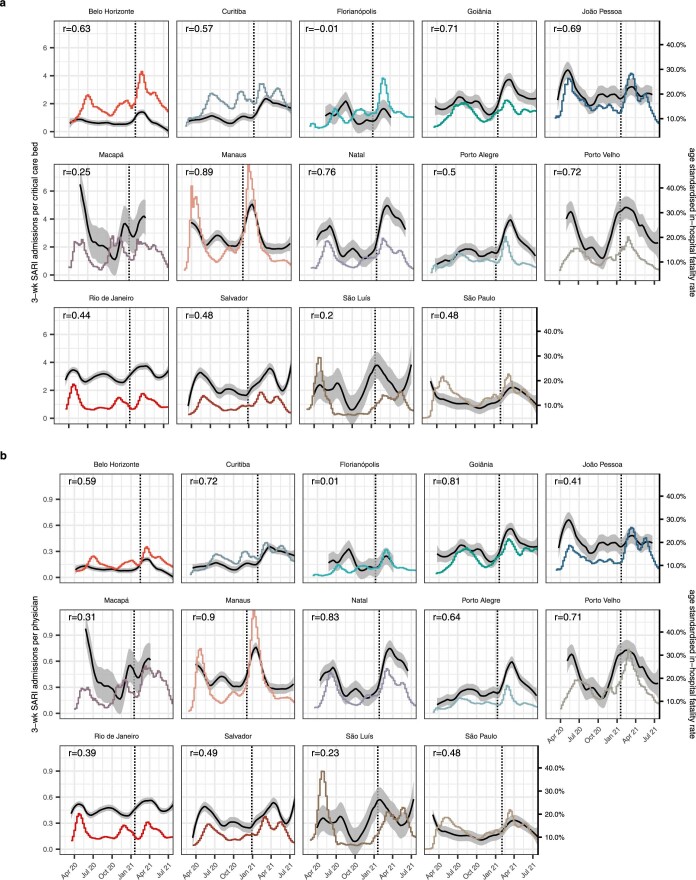
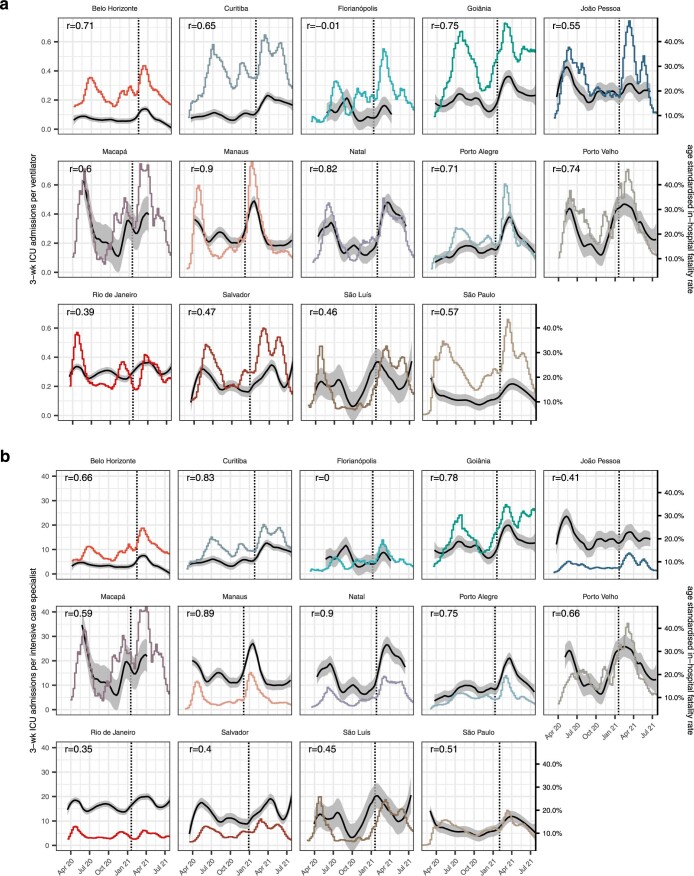
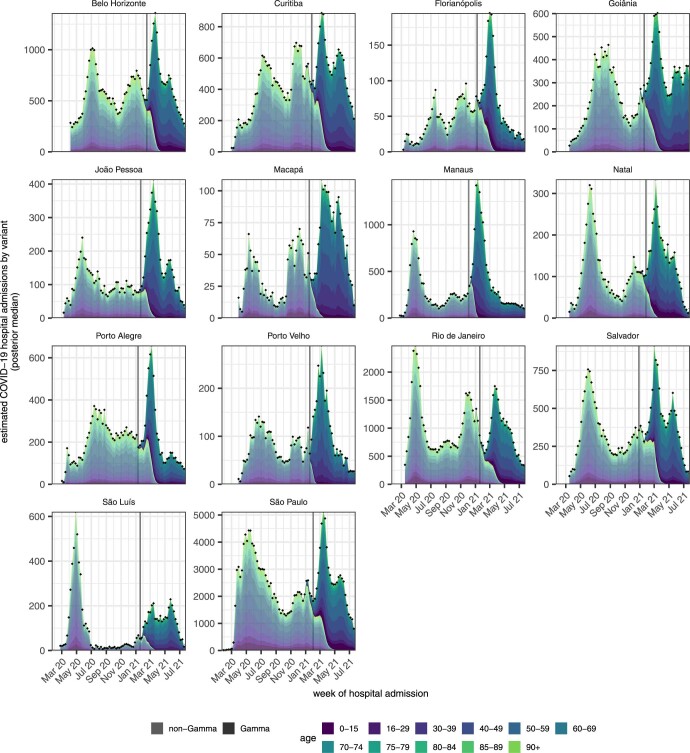
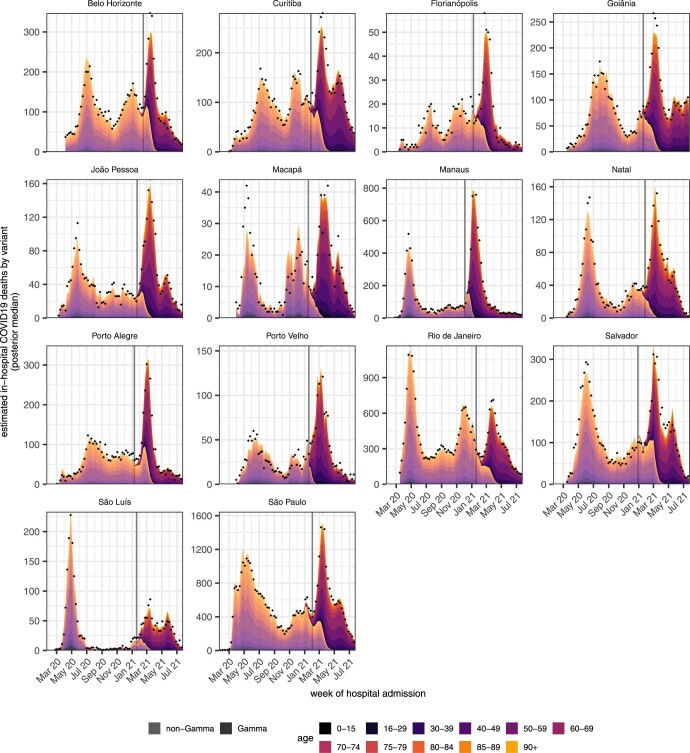
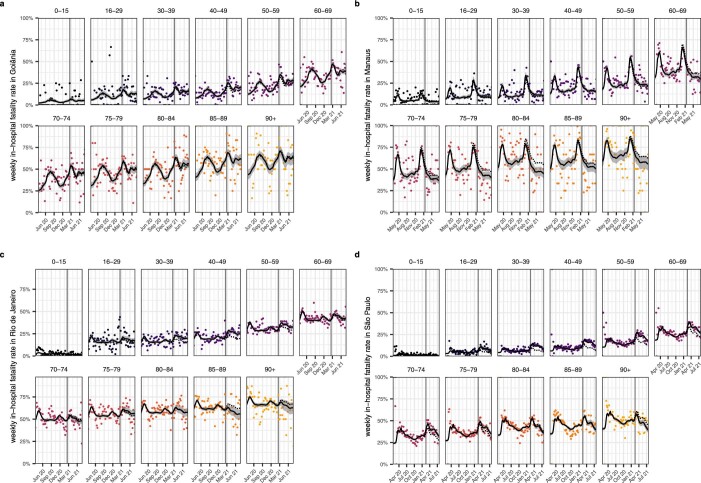
The severe acute respiratory syndrome coronavirus 2 (SARS-CoV-2) Gamma variant of concern has spread rapidly across Brazil since late 2020, causing substantial infection and death waves. Here we used individual-level patient records after hospitalization with suspected or confirmed coronavirus disease 2019 (COVID-19) between 20 January 2020 and 26 July 2021 to document temporary, sweeping shocks in hospital fatality rates that followed the spread of Gamma across 14 state capitals, during which typically more than half of hospitalized patients aged 70 years and older died. We show that such extensive shocks in COVID-19 in-hospital fatality rates also existed before the detection of Gamma. Using a Bayesian fatality rate model, we found that the geographic and temporal fluctuations in Brazil's COVID-19 in-hospital fatality rates were primarily associated with geographic inequities and shortages in healthcare capacity. We estimate that approximately half of the COVID-19 deaths in hospitals in the 14 cities could have been avoided without pre-pandemic geographic inequities and without pandemic healthcare pressure. Our results suggest that investments in healthcare resources, healthcare optimization and pandemic preparedness are critical to minimize population-wide mortality and morbidity caused by highly transmissible and deadly pathogens such as SARS-CoV-2, especially in low- and middle-income countries.


Conflict of interest statement

The authors declare no competing interests.

Figures

Fig. 1
Fig. 1. Analysis flow chart.
Individual-level records of hospital admissions with severe acute respiratory infection across Brazil are mandatory to report to the SIVEP-Gripe database, and publicly available records between 20 January 2020 and 26 July 2021 were downloaded on 31 January 2022. Data used to derive COVID-19 in-hospital fatality rates are shown in blue, and data used to derive the healthcare pressure indices are shown in yellow (Methods).
Fig. 2
Fig. 2. Spatio-temporal expansion of SARS-CoV-2 Gamma in Brazil and associated shocks in COVID-19 fatality rates in hospitals.
a, The 14 states and state capitals in which Gamma was detected by 31 March 2021 and which were included in the analysis. b, Time evolution of SARS-CoV-2 Gamma variant frequencies in three locations, suggesting rapid expansion. Data from GISAID (dots) are shown along with the number of sequenced SARS-CoV-2 samples (text) and posterior median model fits (line) and associated 95% CrIs (gray ribbon). c, Weekly COVID-19 in-hospital fatality rates among hospitalized residents in Manaus with no evidence of vaccination before admission (dots), by age group (facets). Non-parametric loess mean estimates of time trends are shown as block solid lines along with 95% confidence intervals as gray ribbons. The date of Gamma’s first detection is indicated as the gray dotted vertical line.
Fig. 3
Fig. 3. Time trends in age-standardized COVID-19 in-hospital fatality rates and pandemic healthcare pressure.
a, Non-parametric median estimates (lines) and 95% confidence interval (ribbons) of age-standardized COVID-19 in-hospital fatality rates (black, right-hand-side axis) are shown against the healthcare pressure index of ICU admissions over 3 weeks per available ICU bed in each city (color, left-hand-side axis). The date of first detection of Gamma is added as a vertical dashed line. b, Heat map of Pearson correlation coefficients between age-standardized in-hospital fatality rates and each pandemic healthcare pressure index. SARI, severe acute respiratory infection; wk, week.
Fig. 4
Fig. 4. Estimated contribution of location effects, infection severity of Gamma and pandemic healthcare pressure on COVID-19 in-hospital fatality rates.
a, Estimated weekly age-standardized COVID-19 in-hospital fatality rates, averaged across SARS-CoV-2 variants. Posterior median estimates (line) are shown with 95% CrIs (ribbon) and the lowest estimated fatality rates before detection of Gamma in each state capital (dotted horizontal line). b, Estimated ratio in lowest in-hospital fatality rates in each location relative to that seen in Belo Horizonte. c, Estimated ratio in in-hospital fatality rates for Gamma versus non-Gamma lineages of SARS-CoV-2. d, Estimated multiplier to the lowest age-standardized fatality rates before Gamma’s detection shown in a, which is associated with the pandemic healthcare pressure indices. In each plot, posterior median estimates are shown as dots and 95% CrIs as linerange. Box plots summarize posterior medians across locations (n = 14): the middle line is the median; the box limits represent the upper and lower quartiles; and the whiskers extend to the extreme values that are no further than 1.5 times the interquartile range. Multipliers and ratios in bd are reported on a logarithmic scale. Posterior estimates with CrI width larger than 3 were removed for clarity of presentation.
Extended Data Fig. 1
Extended Data Fig. 1. Spatiotemporal expansion of the SARS-CoV-2 Gamma variant across Brazil.
SARS-CoV-2 genome sequences were obtained from the GISAID repository along with confirmed lineage assignments. The frequency of the Gamma variant (dots) in weekly SARS-CoV-2 genome sequence counts (size of dots) is shown along with posterior median estimates of Gamma’s variant frequencies (black line) under the Bayesian multi-strain fatality model and 95% credible intervals (grey ribbon).
Extended Data Fig. 2
Extended Data Fig. 2. Underreporting-adjusted COVID-19 attributable deaths.
Reported COVID-19 attributable deaths in the SIVEP-Gripe platform were adjusted for in-hospital underreporting, by counting a proportion of hospitalised patients with as of yet unreported outcome as fatal, and for likely out-of-hospital under-reporting, by comparison against population excess deaths derived from all-cause mortality data of the Brazilian Civil Registry (Supplementary Information). The date of Gamma’s first detection in each city is shown as a vertical dotted line.
Extended Data Fig. 3
Extended Data Fig. 3. Time trends in age-specific COVID-19 in-hospital fatality rates.
Weekly, age-specific COVID-19 in-hospital fatality rates are shown as dots, and non-parametric loess mean estimates of time trends are shown as block solid line along with 95% confidence intervals as grey ribbon. The date of Gamma’s first detection is indicated with vertical black lines. Data are shown for Goiânia (a), Natal (b), Rio de Janeiro (c), and São Paulo (d).
Extended Data Fig. 4
Extended Data Fig. 4. Time evolution of pandemic healthcare pressure indices, part 1.
SARI admissions in this and the following two weeks per hospital resource are shown in colour, with y-axis on the left. In (a), demand per critical care bed is shown, and in (b) demand per physician. Non-parametric mean estimates of age-standardised COVID-19 in-hospital fatality rates are shown in black, with 95% confidence intervals as grey ribbons, and y-axis on the right. Pearson correlation coefficients (r) are shown in the upper left corner, and dates of Gamma’s first detection as vertical black lines.
Extended Data Fig. 5
Extended Data Fig. 5. Time evolution of pandemic healthcare pressure indices, part 2.
ICU admissions in this and the following two weeks per hospital resource are shown in colour, with y-axis on the left. In (a), demand per ventilator is shown, and in (b) demand per intensive care specialist. Non-parametric mean estimates of age-standardised COVID-19 in-hospital fatality rates are shown in black, with 95% confidence intervals as grey ribbons, and y-axis on the right. Pearson correlation coefficients (r) are shown in the upper left corner, and dates of Gamma’s first detection as vertical lines.
Extended Data Fig. 6
Extended Data Fig. 6. Estimated COVID-19 attributable hospital admissions by SARS-CoV-2 variant.
Posterior median estimates of hospital admissions among residents in each location, that are attributed to non-Gamma variants are shown for each age band (color) in lighter shades, while those for the Gamma variant are shown in darker shades. Estimates are derived using the Bayesian multi-strain fatality model. Locations are shown across facets. The date of Gamma’s detection is shown as a grey vertical line. Observed weekly hospital admissions in residents are shown as black dots.
Extended Data Fig. 7
Extended Data Fig. 7. Estimated COVID-19 attributable deaths in hospitals by SARS-CoV-2 variant.
Posterior median estimates of deaths following hospital admissions of residents in each location, that are attributed to non-Gamma variants are shown for each age band (color) in lighter shades, while those for the Gamma variant are shown in darker shades. Estimates are derived using the Bayesian multi-strain fatality model. Locations are shown across facets. The date of Gamma’s detection is shown as a grey vertical line. Observed weekly deaths following hospital admissions in residents are shown as black dots.
Extended Data Fig. 8
Extended Data Fig. 8. Model fits to age-specific COVID-19 in-hospital fatality rates.
Weekly, age-specific in-hospital fatality rates are shown as dots. Posterior median estimates of the expected in-hospital fatality rates across variants from the Bayesian multi-strain fatality model, Equation. (8), are shown on the y-axis (black line) along with 95% credible intervals (grey ribbon). The expected in-hospital fatality rates of non-Gamma variants, Equation (6a), are shown as dotted line. The date of Gamma’s first detection is indicated as a vertical line. Data are shown for Goiânia (a), Manaus (b), Rio de Janeiro (c), and São Paulo (d).
Extended Data Fig. 9
Extended Data Fig. 9. Model fits of the expected age composition of COVID-19 attributable hospital admissions.
Posterior median estimates of the expected age composition of hospital admissions in each location, age band, and week, obtained with the Bayesian multi-strain fatality model are shown on the y-axis as a black line along with 95% credible intervals. Time trends are shown by week of hospital admission (x-axis). The empirical proportions are shown as dots. Data are shown for Goiânia (a), Manaus (b), Rio de Janeiro (c), and São Paulo (d).

Update of

Similar articles

Cited by

References

    1. Davies NG, et al. Estimated transmissibility and impact of SARS-CoV-2 lineage B.1.1.7 in England. Science. 2021;372:eabg3055. doi: 10.1126/science.abg3055. - DOI - PMC - PubMed
    1. Tegally H, et al. Detection of a SARS-CoV-2 variant of concern in South Africa. Nature. 2021;592:438–443. doi: 10.1038/s41586-021-03402-9. - DOI - PubMed
    1. Faria NR, et al. Genomics and epidemiology of the P.1 SARS-CoV-2 lineage in Manaus, Brazil. Science. 2021;372:815–821. doi: 10.1126/science.abh2644. - DOI - PMC - PubMed
    1. Volz E, et al. Assessing transmissibility of SARS-CoV-2 lineage B.1.1.7 in England. Nature. 2021;593:266–269. doi: 10.1038/s41586-021-03470-x. - DOI - PubMed
    1. Dyer O. Covid-19: South Africa’s surge in cases deepens alarm over omicron variant. BMJ. 2021;375:n3013. doi: 10.1136/bmj.n3013. - DOI - PubMed

Publication types

Supplementary concepts