

The transcriptome-wide N6-methyladenosine (m6A) map profiling reveals the regulatory role of m6A in the yak ovary
- PMID: 35538402
- PMCID: PMC9092806
- DOI: 10.1186/s12864-022-08585-7
The transcriptome-wide N6-methyladenosine (m6A) map profiling reveals the regulatory role of m6A in the yak ovary
Abstract
Background and aim: Yak estrus is a seasonal phenomenon, probably involving epigenetic regulation of synthesis and secretion of sex hormones as well as growth and development of follicles. N6-methyladenosine (m6A) is the most common internal modification of the eukaryotic mRNA. However, there are no detailed reports on the m6A transcriptome map of yak ovary. Therefore, this study aimed to collected the yak ovarian tissues at three different states of anestrus (YO-A), estrus (YO-F), and pregnancy (YO-P), and obtained the full transcriptome m6A map in yak by MeRIP-seq.
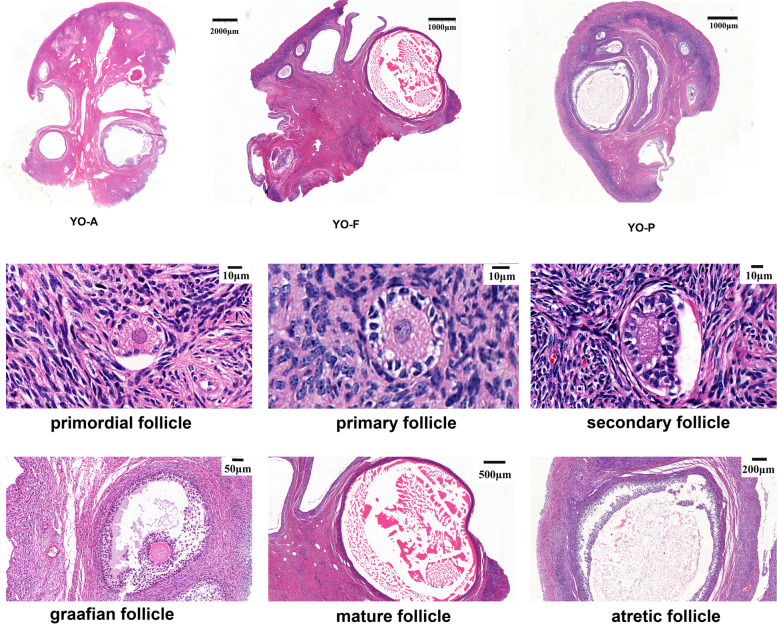
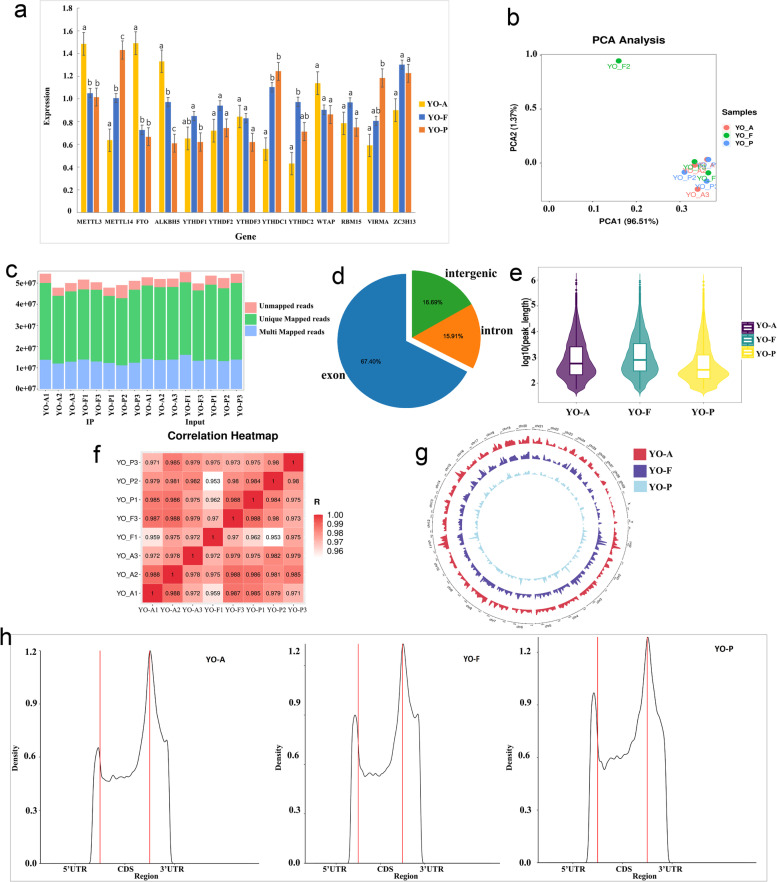
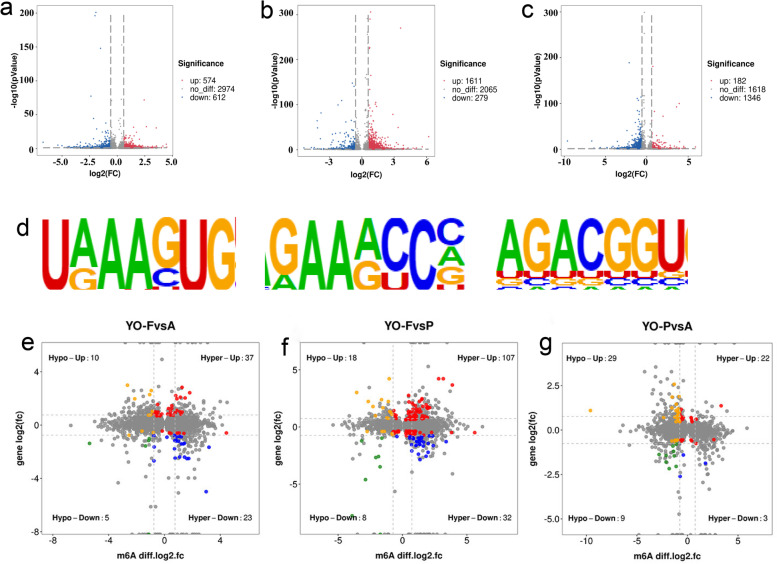
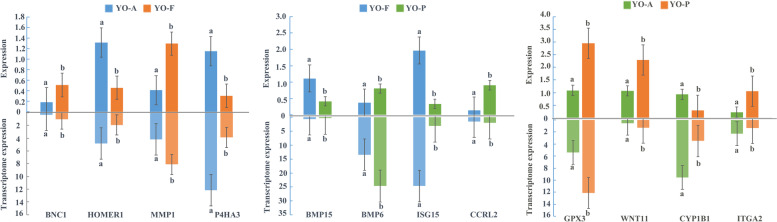
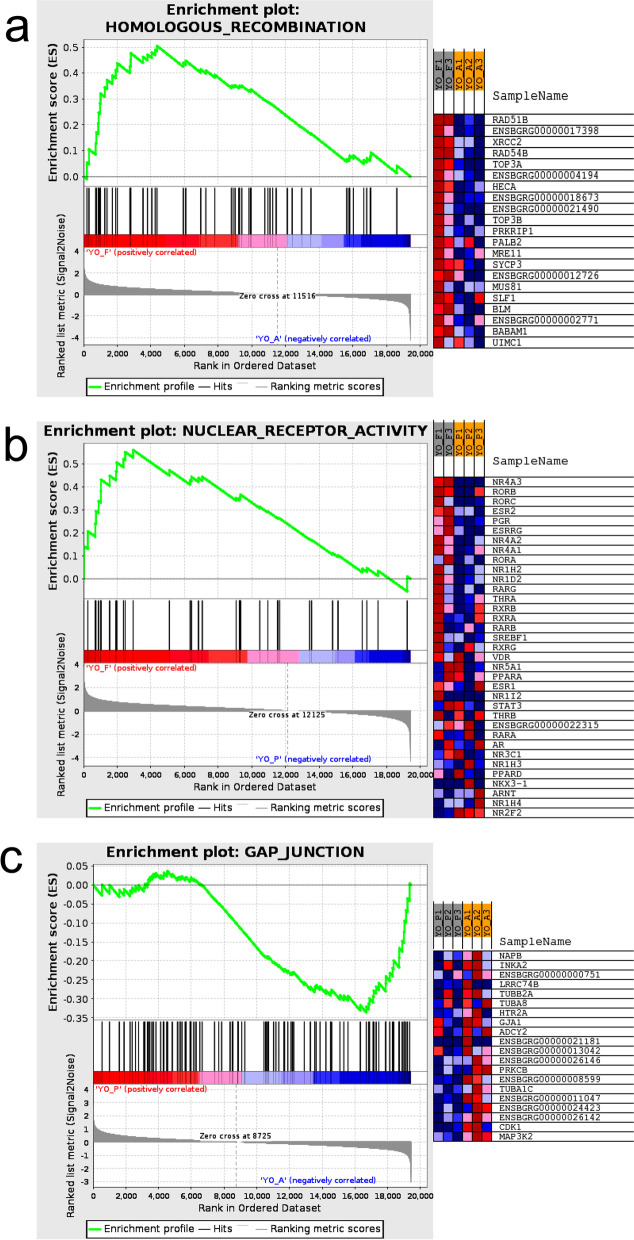
Results: The HE staining revealed that the number of growing follicles and mature follicles in the ovary during the estrus period was relatively higher than those in the anestrus period and the pregnancy period. The RT-qPCR showed that the expression of METTL3, METTL14, FTO, YTHDC1 were significantly different across different periods in the ovaries, which suggests that m6A may play a regulatory role in ovarian activity. Next, we identified 20,174, 19,747 and 13,523 m6A peaks in the three ovarian samples of YO-A, YO-F and YO-P using the methylated RNA immunoprecipitation sequencing (MeRIP-seq). The m6A peaks are highly enriched in the coding sequence (CDS) region and 3'untranslated region (3'UTR) as well as the conserved sequence of "RRACH." The GO, KEGG and GSEA analysis revealed the involvement of m6A in many physiological activities of the yak's ovary during reproductive cycle. The association analysis found that some genes such as BNC1, HOMER1, BMP15, BMP6, GPX3, and WNT11 were related to ovarian functions.
Conclusions: The comparison of the distribution patterns of methylation peaks in the ovarian tissues across different periods further explored the m6A markers related to the regulation of ovarian ovulation and follicular development in the yak ovary. This comprehensive map provides a solid foundation for revealing the potential function of the mRNA m6A modification in the yak ovary.
Keywords: Anestrus; Estrus; MeRIP-seq; Pregnancy; m6A.
© 2022. The Author(s).
Conflict of interest statement
The authors declare no competing interests.
Figures
Similar articles
-
Dynamic m6A Modification Landscape During the Egg Laying Process of Chickens.Int J Mol Sci. 2025 Feb 16;26(4):1677. doi: 10.3390/ijms26041677. Int J Mol Sci. 2025. PMID: 40004144 Free PMC article.
-
Regulatory Role of N6-Methyladenosine in Longissimus Dorsi Development in Yak.Front Vet Sci. 2022 Apr 13;9:757115. doi: 10.3389/fvets.2022.757115. eCollection 2022. Front Vet Sci. 2022. PMID: 35498742 Free PMC article.
-
Synchronous profiling of mRNA N6-methyladenosine modifications and mRNA expression in high-grade serous ovarian cancer: a pilot study.Sci Rep. 2024 May 7;14(1):10427. doi: 10.1038/s41598-024-60975-x. Sci Rep. 2024. PMID: 38714753 Free PMC article.
-
Epigenetic regulation of mRNA N6-methyladenosine modifications in mammalian gametogenesis.Mol Hum Reprod. 2021 May 8;27(5):gaab025. doi: 10.1093/molehr/gaab025. Mol Hum Reprod. 2021. PMID: 33823008 Review.
-
Mapping N6 -Methyladenosine (m6 A) in RNA: Established Methods, Remaining Challenges, and Emerging Approaches.Chemistry. 2019 Mar 7;25(14):3455-3464. doi: 10.1002/chem.201804043. Epub 2019 Jan 8. Chemistry. 2019. PMID: 30347476 Review.
Cited by
-
Dynamic m6A Modification Landscape During the Egg Laying Process of Chickens.Int J Mol Sci. 2025 Feb 16;26(4):1677. doi: 10.3390/ijms26041677. Int J Mol Sci. 2025. PMID: 40004144 Free PMC article.
-
Photoperiod alters testicular methyltransferase complex mRNA expression in Siberian hamsters.Gen Comp Endocrinol. 2023 Mar 1;333:114186. doi: 10.1016/j.ygcen.2022.114186. Epub 2022 Dec 12. Gen Comp Endocrinol. 2023. PMID: 36521516 Free PMC article.
-
Transcriptome-wide m6A methylation profiling of Wuhua yellow-feathered chicken ovary revealed regulatory pathways underlying sexual maturation and low egg-laying performance.Front Genet. 2023 Oct 20;14:1284554. doi: 10.3389/fgene.2023.1284554. eCollection 2023. Front Genet. 2023. PMID: 37928247 Free PMC article.
-
Research Progress on the Role of M6A in Regulating Economic Traits in Livestock.Int J Mol Sci. 2024 Jul 31;25(15):8365. doi: 10.3390/ijms25158365. Int J Mol Sci. 2024. PMID: 39125935 Free PMC article. Review.
-
Ribo-Seq Analysis-Based Elucidation of the Dynamic Translation Landscape of Yak Ovarian Tissues in Different Reproductive Stages.FASEB J. 2025 Aug 15;39(15):e70924. doi: 10.1096/fj.202500646RR. FASEB J. 2025. PMID: 40779359 Free PMC article.
References
MeSH terms
Substances
Grants and funding
LinkOut - more resources
Full Text Sources
Miscellaneous
