. 2022 May 10;21(1):111.
doi: 10.1186/s12943-022-01549-1.

N6-methyladenosine-modified TRAF1 promotes sunitinib resistance by regulating apoptosis and angiogenesis in a METTL14-dependent manner in renal cell carcinoma

Affiliations

N6-methyladenosine-modified TRAF1 promotes sunitinib resistance by regulating apoptosis and angiogenesis in a METTL14-dependent manner in renal cell carcinoma

Yuanlei Chen et al. Mol Cancer. .

Abstract

Background: Sunitinib resistance can be classified into primary and secondary resistance. While accumulating research has indicated several underlying factors contributing to sunitinib resistance, the precise mechanisms in renal cell carcinoma are still unclear.

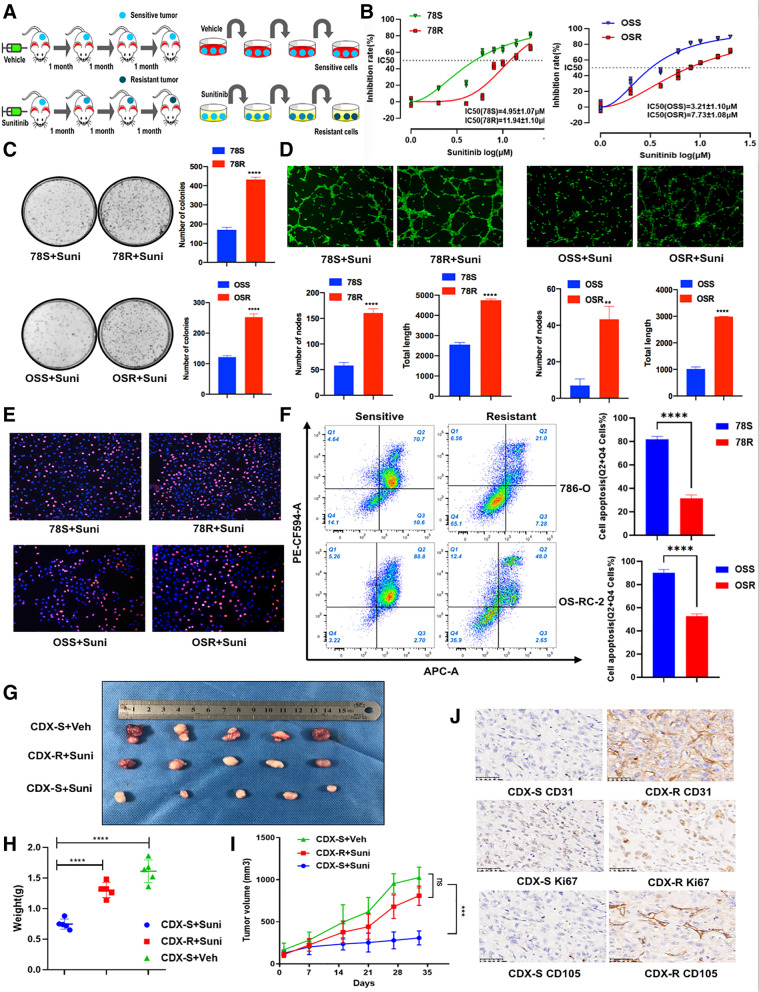
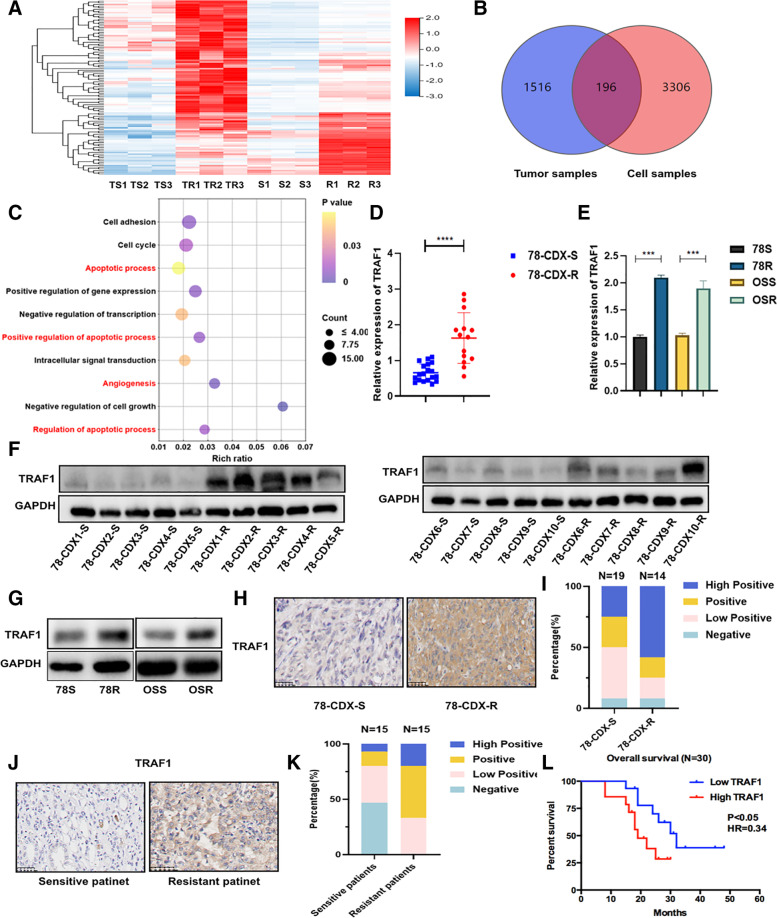
Methods: RNA sequencing and m6A sequencing were used to screen for functional genes involved in sunitinib resistance. In vitro and in vivo experiments were carried out and patient samples and clinical information were obtained for clinical analysis.

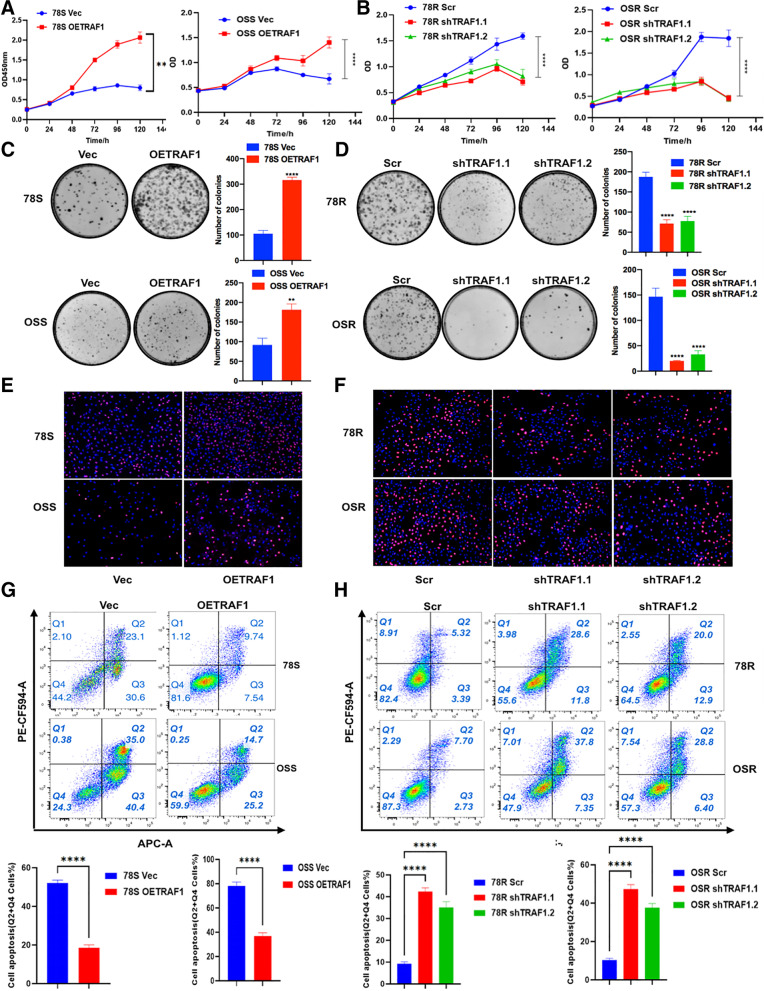
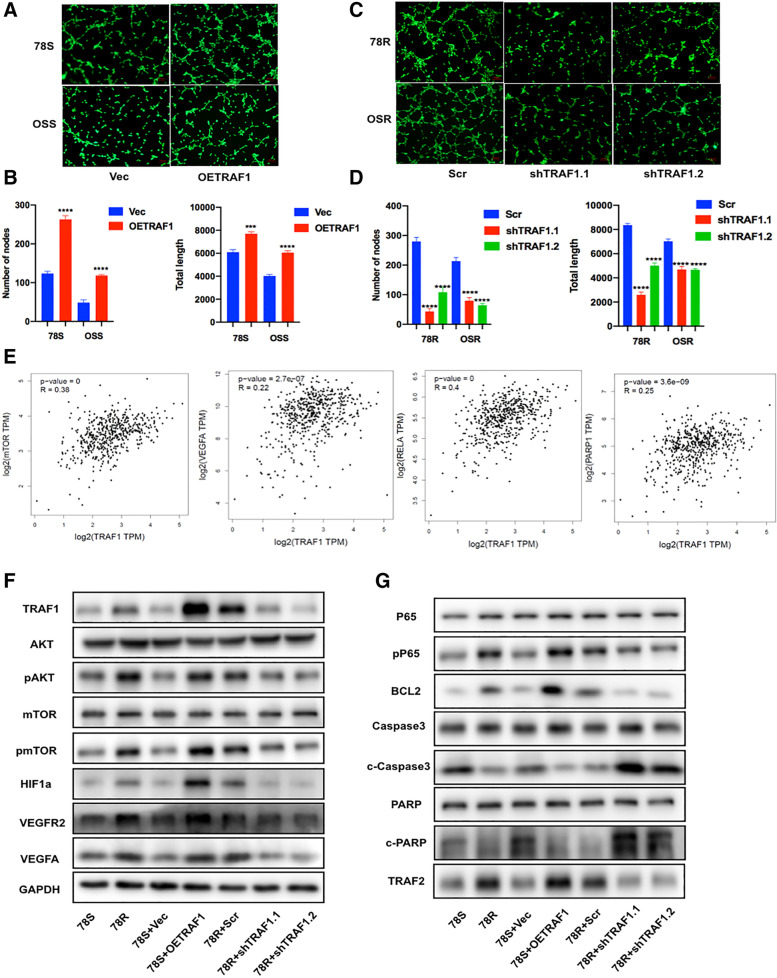
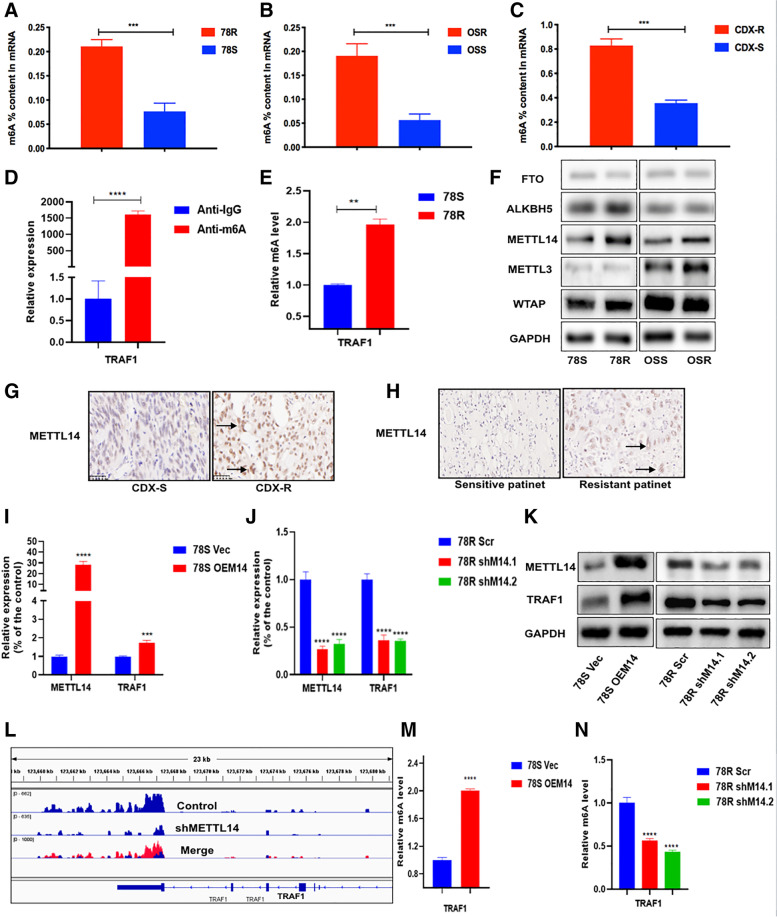
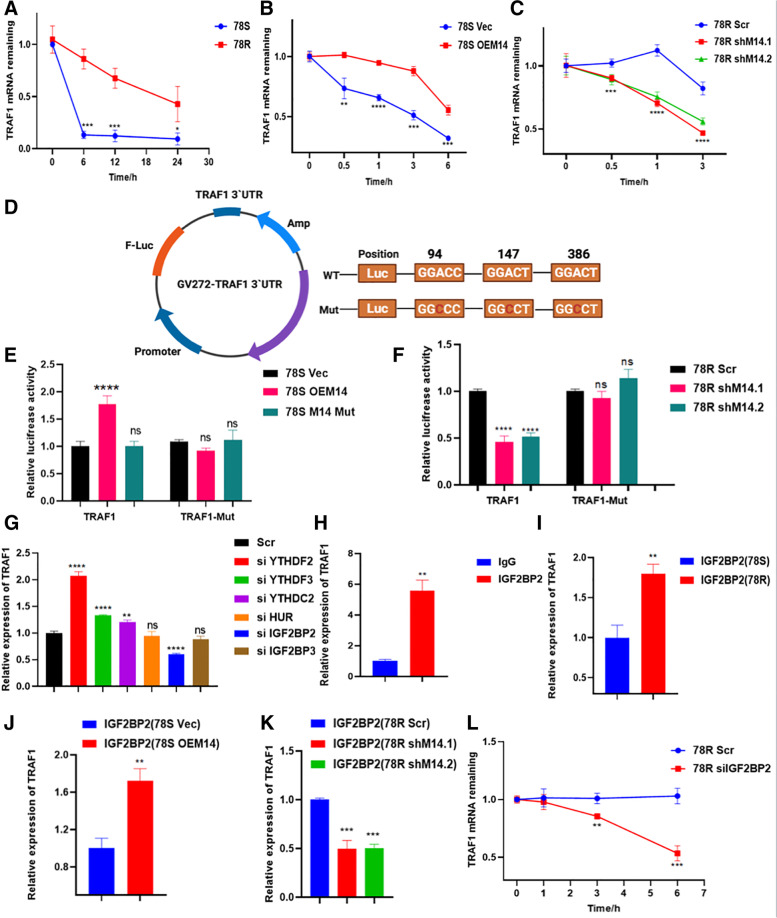
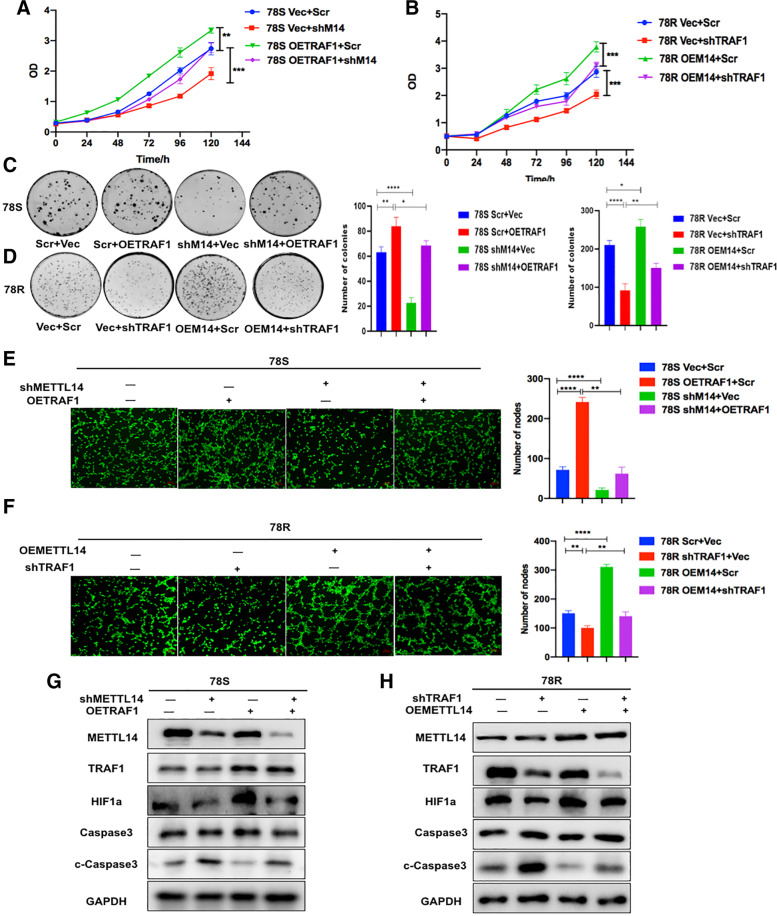
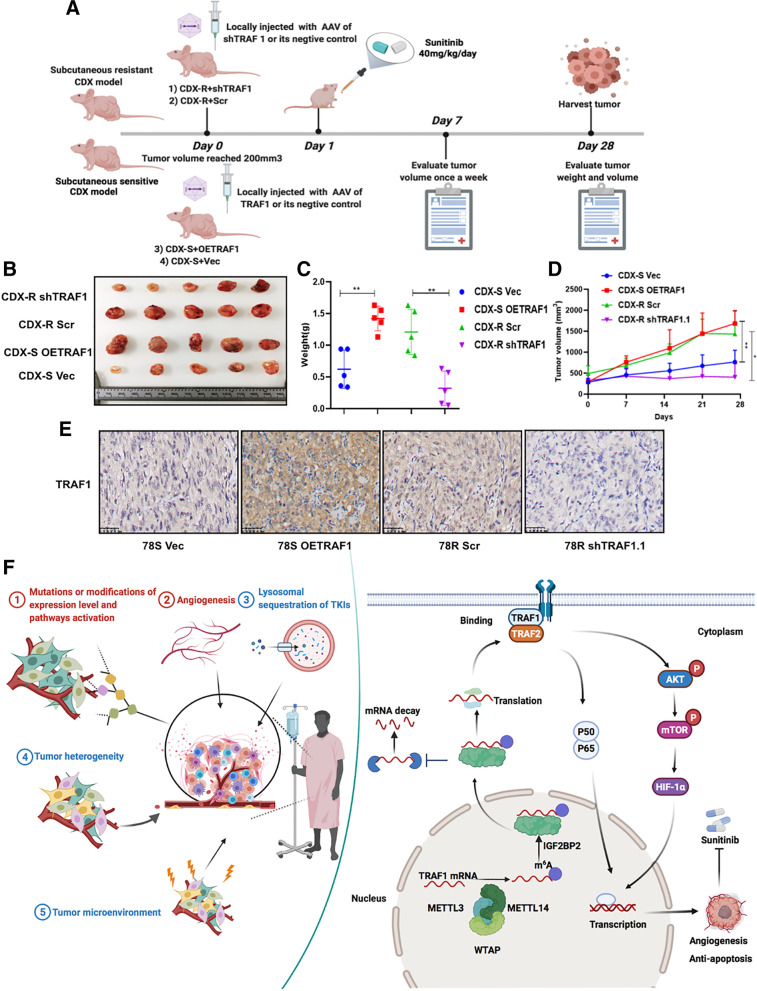
Results: We identified a tumor necrosis factor receptor-associated factor, TRAF1, that was significantly increased in sunitinib-resistant cells, resistant cell-derived xenograft (CDX-R) models and clinical patients with sunitinib resistance. Silencing TRAF1 increased sunitinib-induced apoptotic and antiangiogenic effects. Mechanistically, the upregulated level of TRAF1 in sunitinib-resistant cells was derived from increased TRAF1 RNA stability, which was caused by an increased level of N6-methyladenosine (m6A) in a METTL14-dependent manner. Moreover, in vivo adeno-associated virus 9 (AAV9) -mediated transduction of TRAF1 suppressed the sunitinib-induced apoptotic and antiangiogenic effects in the CDX models, whereas knockdown of TRAF1 effectively resensitized the sunitinib-resistant CDXs to sunitinib treatment.

Conclusions: Overexpression of TRAF1 promotes sunitinib resistance by modulating apoptotic and angiogenic pathways in a METTL14-dependent manner. Targeting TRAF1 and its pathways may be a novel pharmaceutical intervention for sunitinib-treated patients.

Keywords: METTL14; N6-methyladenosine; RCC; Sunitinib-resistance; TRAF1.


Conflict of interest statement

The authors declare no competing interests.

Figures

Fig. 1
Fig. 1
Establishment and verification of sunitinib-resistant models. A The graphical representation of sunitinib-resistant models. B CCK8 assay of sunitinib-resistant cell lines and control cell lines with sunitinib treatment at indicated concentrations for 48 h. C Colony formation assay of sunitinib-resistant cell lines and control cell lines with sunitinib treatment (2 uM) in 6-well dish for 3 weeks (n = 3). Representative images (left) and average number of colonies (right) are shown. D Tube formation assay of sunitinib-resistant cell lines and control cell lines in 48-well dish. Representative images (up) and total number of nodes and length (below) are shown. E EdU assay was applied to compare the cell proliferation ability in sunitinib-resistant cell lines and control cell lines with sunitinib treatment (7 uM for 78S/R, 5 uM for OSS/R) (scale bar, 100 μm). F Analysis of apoptosis in 78R, 78S, OSR and OSS cells with sunitinib treatment by flow cytometry (7 uM for 78S/R, 5 uM for OSS/R). G-I Tumor volume, tumor weight and tumor growth curve of CDX-S and CDX-R under sunitinib or vehicle treatment(40 mg/kg/day) for 30 days. J Immunohistochemistry for KI67, CD31 and CD105 comparing CDX-S and control CDX-R. Scale bar, 50 μm. Data are expressed as the mean ± SEM. Statistical analyses used Student’s t-test and Kaplan–Meier survival analysis. p < 0.05 was considered statistically significant. * p < 0.05, ** p < 0.01, *** p < 0.001 and **** p < 0.0001
Fig. 2
Fig. 2
Elevated level of TRAF1 in sunitinib-resistant RCC. A Identification of differently expressed genes by RNA sequence in sunitinib resistant cell line and CDX-R compared to the corresponding sensitive groups (TS: sensitive tumor sample; TR: resistant tumor sample; S: sensitive cells; R: resistant cells). B The venn diagram was generated from the gene sets enriched for transcripts between tumor samples and cell samples. C Gene ontology analysis of differential expressed genes. D and E The expression of TRAF1 mRNA was determined by RT-qPCR in CDX models and cell lines. F and G The expression of TRAF1 protein was analyzed by western blotting in CDX samples(n = 10) and cell lines. H and I Immunohistochemistry for TRAF1 in CDX-S and CDX-R. Left panels show images and quantification is shown on the right. J and K Immunohistochemistry for TRAF1 in clinical patient samples. Left panels show images and quantification is shown on the right. L Kaplan–Meier survival analysis for RCC patients treated with sunitinib with low and high TRAF1 expression. The low and high TRAF1 expression was cut off by the median expression. p < 0.05 was considered statistically significant. Three different independent experiments with three technical repetitions were performed. Data are expressed as the mean ± SEM. Statistical analyses used Student’s t-test and Kaplan–Meier survival analysis. p < 0.05 was considered statistically significant. * p < 0.05, ** p < 0.01, *** p < 0.001 and **** p < 0.0001
Fig. 3
Fig. 3
TRAF1 plays a critical role in sunitinib-resistance. A CCK8 assay (450 nm) of sunitinib-sensitive cell lines with and without TRAF1 overexpression under sunitinib treatment (5 μM for 78S, 3 μM for OSS) for 5 days. B CCK8 assay of sunitinib-resistant cell lines with and without TRAF1 knock-down under sunitinib treatment (5 μM for 78R, 3 μM for OSR) for 5 days. C Colony formation assay of sunitinib-sensitive cell lines with and without TRAF1 overexpression under sunitinib treatment (2 μM). D Colony formation assay of sunitinib-resistant cell lines with and without TRAF1 knock-down under sunitinib treatment (2 μM). Representative images (left) and average number of colonies (right) are shown. E EdU assay of sunitinib-sensitive cell lines with and without TRAF1 overexpression under sunitinib treatment (3 μM). F EdU assay of sunitinib-resistant cell lines with and without TRAF1 knock-down under sunitinib treatment (5 μM). G Flow cytometry of sunitinib-sensitive cell lines with and without TRAF1 overexpression under sunitinib treatment (3 μM). H Flow cytometry of sunitinib-resistant cell lines with and without TRAF1 knock-down under sunitinib treatment (5 μM). Stable expression cell lines were used in the above experiments. * p < 0.05, ** p < 0.01, *** p < 0.001 and **** p < 0.0001
Fig. 4
Fig. 4
TRAF1 plays a critical role in sunitinib-resistance. A and B Tube formation assay of sunitinib-sensitive cell lines with and without TRAF1 overexpression under sunitinib treatment. C and D Tube formation assay of sunitinib-resistant cell lines with and without TRAF1 knock-down under sunitinib treatment. Representative images (up) and total number of nodes and length (below) are shown. E Correlation analysis of relative RNA expression of TRAF1 with mTOR, VEGFA, p53 and PARP. F Proteins involved in angiogenesis signaling were mediated by TRAF1. G Proteins involved in apoptotic signal pathways were mediated by TRAF1
Fig. 5
Fig. 5
TRAF1 is modulated by m6A RNA methylation. A The m6A contents of mRNAs in 78S and 78R cells. B The m6A contents of mRNAs in OSS and OSR cells. C The m6A contents of mRNAs in CDX-S and CDX-R tissues. D and E MeRIP assays for m6A-modified TRAF1 in 78S and 78R cells. F Protein level of m6A modification–associated genes in sunitinib-sensitive/resistant cells. G The protein level of METTL14 in CDX-S and CDX-R. H The protein level of METTL14 in clinical patient samples. I and J The positive correlation of METTL14 and TRAF1 in RNA level. K The positive correlation of METTL14 and TRAF1 in protein level. L Identification of m6A abundances on TRAF1 transcripts in METTL14 knockdown cell line and control via m6A-sequence. M and N The m6A levels of TRAF1 with modulation of METTL14
Fig. 6
Fig. 6
METTL14 regulates mRNA stability of TRAF1. A The mRNA half-life (t1/2) of TRAF1 transcripts in 78S and 78R cell lines. B The mRNA half-life (t1/2) of TRAF1 transcripts in 78S cells with (OEM14) or without (Vec) METTL14 overexpression. C The mRNA half-life (t1/2) of TRAF1 transcripts in 78R cells with (shM14.1 or shM14.2) or without (Scr) METTL14 depletion. D TRAF1 3′-UTR plasmid contain wild-type or mutant seed sequences. E Relative luciferase activity of TRAF1 3′-UTR constructs containing wild-type or mutant seed sequences after co-transfection with vector (Vec), METTL14 overexpression (OEM14) or mutant METTL14 overexpression (M14 Mut) into 78S cells. F Relative luciferase activity of TRAF1 3′-UTR constructs containing wild-type or mutant seed sequences after co-transfection with scramble (Scr) or shMETTL14(shM14) into 78R cells. Firefly luciferase activity was measured and normalized to Renilla luciferase activity. G qPCR analysis of the mRNA levels of TRAF1 after knock-down of readers. IGF2BP2 was screened out to positively influence the expression of TRAF1. IGF2BP2 was screened out to positively influence the expression of TRAF1. H and I RIP assay for the enrichment of TRAF1 in 78S and 78R incubated with IGF2BP2 antibody. TRAF1 is highly enriched in 78R cells compared to 78S cells. J and K RIP assay for the enrichment of TRAF1 in 78S cells with METTL14 overexpression (J) and in 78R cells with METTL14 depletion(K) incubated with IGF2BP2 antibody. L The decay rate of mRNA and qPCR analysis of TRAF1 at the indicated times after actinomycin D (5 μg/ml) treatment in 78R cells with IGF2BP2 knockdown
Fig. 7
Fig. 7
TRAF1 maintained sunitinib resistance in a METTL14-dependent manner. A and B CCK8 rescue experiments in 78S cells and 78R cells C and D Colony formation rescue experiments in 78S cells and 78R cells E and F Tube formation rescue experiments in 78S cells and 78R cells. G The protein levels of HIF-1a, Caspase3 and cleaved caspase3 were measured by western blot analysis in 78S cells transfected with lentiviruses carrying TRAF1 and/or sh-METTL14. H The protein levels of HIF-1a, Caspase3 and cleaved caspase3 were measured by western blot analysis in 78R cells transfected with lentiviruses carrying METTL14 and/or sh-TRAF1
Fig. 8
Fig. 8
Targeting TRAF1 in vivo retards sunitinib-resistant RCC. A Schematic diagram of in vivo experiments. B-D Tumor volume, tumor weight and tumor growth curve of CDX models with TRAF1 overexpression, TRAF1 knockdown or its relative controls. E IHC analysis of the TRAF1 expression. F The factors associated with resistance to TKIs (left panel); Proposed model depicting regulation and role of TRAF1 in sunitinib-resistance (right panel)

Similar articles

Cited by

References

    1. Siegel RL, Miller KD, Fuchs HE, Jemal A. Cancer Statistics, 2021. CA Cancer J Clin. 2021;71:7–33. doi: 10.3322/caac.21654. - DOI - PubMed
    1. Cancer Genome Atlas Research N Comprehensive molecular characterization of clear cell renal cell carcinoma. Nature. 2013;499:43–49. doi: 10.1038/nature12222. - DOI - PMC - PubMed
    1. Capitanio U, Montorsi F. Renal cancer. Lancet. 2016;387:894–906. doi: 10.1016/S0140-6736(15)00046-X. - DOI - PubMed
    1. Nerich V, Hugues M, Paillard MJ, Borowski L, Nai T, Stein U, Nguyen Tan Hon T. Montcuquet P, Maurina T, Mouillet G, et al. Clinical impact of targeted therapies in patients with metastatic clear-cell renal cell carcinoma. Onco Targets Ther. 2014;7:365–374. doi: 10.2147/OTT.S56370. - DOI - PMC - PubMed
    1. Bhatt JR, Finelli A. Landmarks in the diagnosis and treatment of renal cell carcinoma. Nat Rev Urol. 2014;11:517–525. doi: 10.1038/nrurol.2014.194. - DOI - PubMed

Publication types

MeSH terms