. 2022 May 10;20(1):63.
doi: 10.1186/s12964-022-00871-x.

Melanoma cells with diverse invasive potential differentially induce the activation of normal human fibroblasts

Affiliations

Melanoma cells with diverse invasive potential differentially induce the activation of normal human fibroblasts

Justyna Mazurkiewicz et al. Cell Commun Signal. .

Abstract

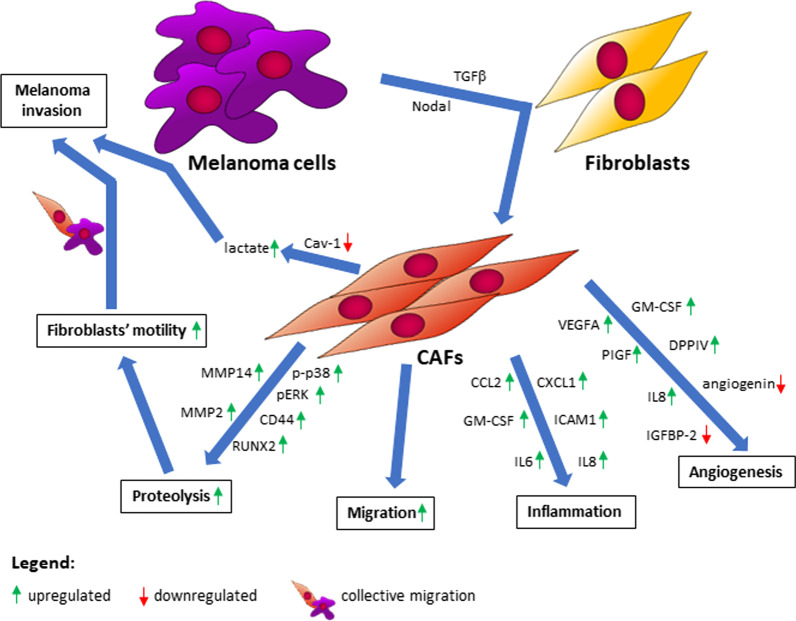
Background: The tumor microenvironment consists of stromal cells, extracellular matrix, and physicochemical properties (e.g., oxygenation, acidification). An important element of the tumor niche are cancer-associated fibroblasts (CAFs). They may constitute up to 80% of the tumor mass and share some features with myofibroblasts involved in the process of wound healing. CAFs can facilitate cancer progression. However, their interaction with melanoma cells is still poorly understood.

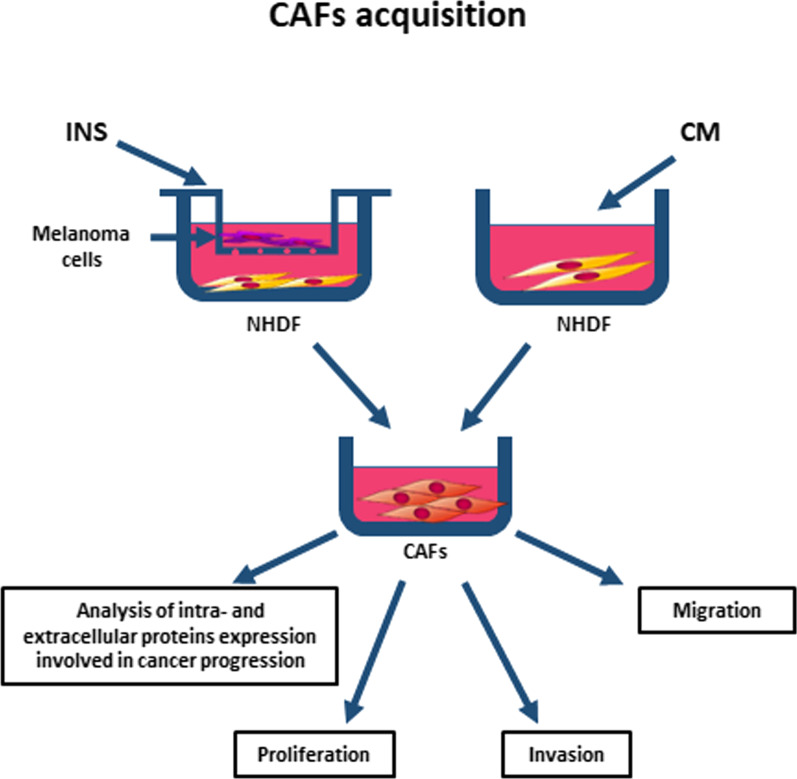
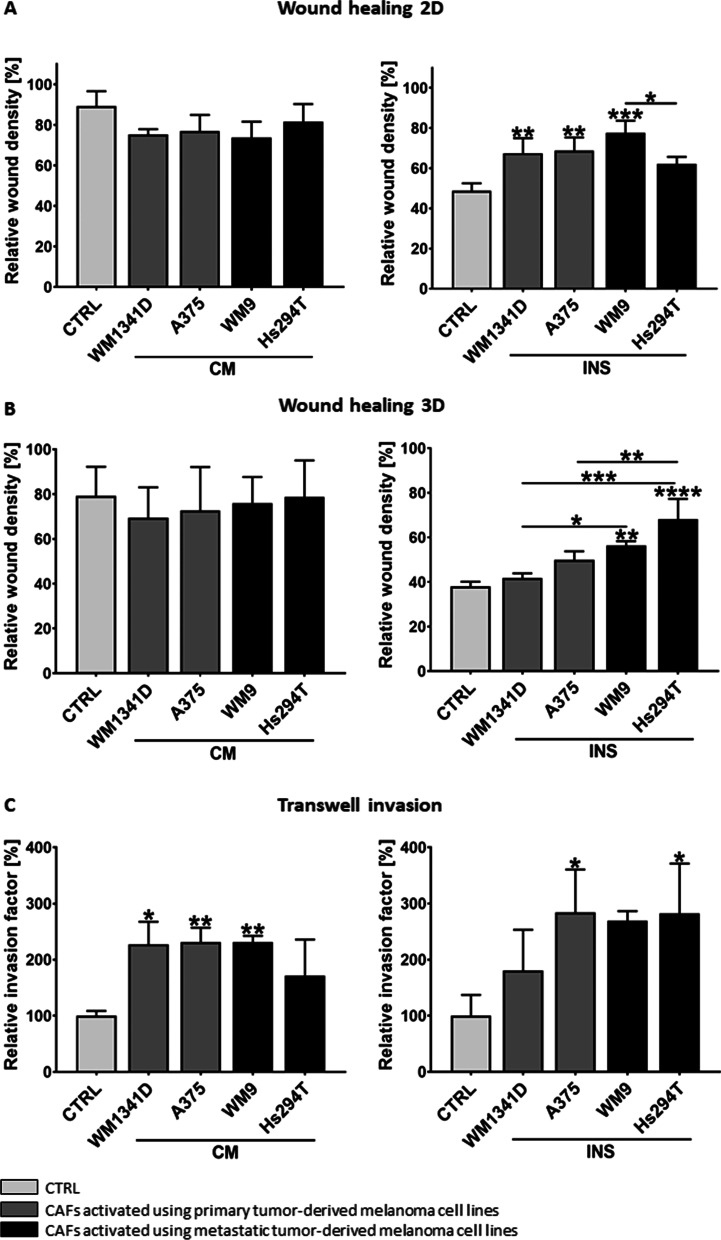
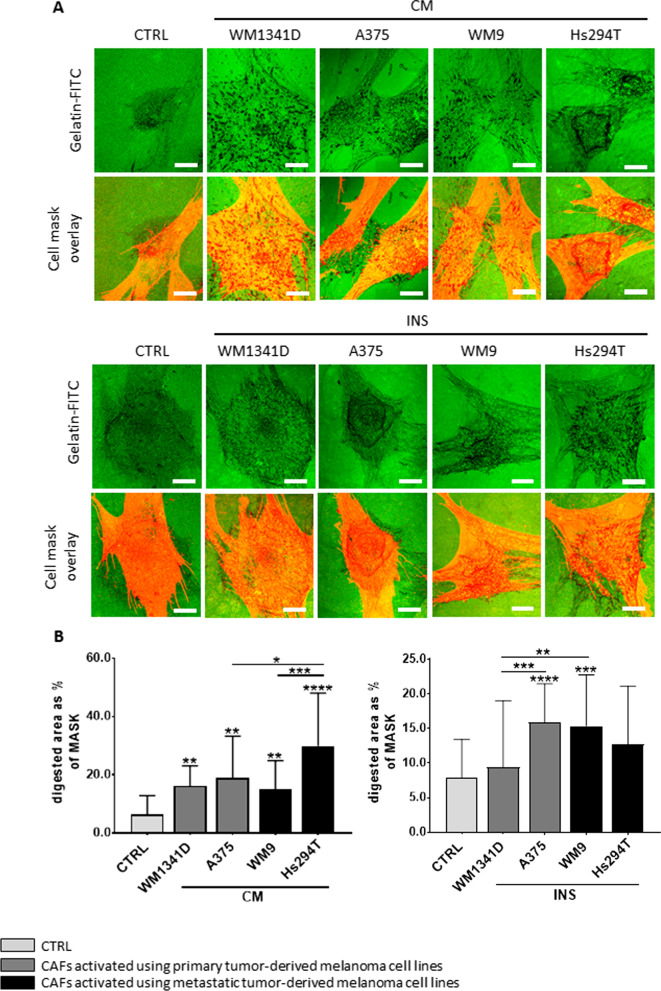
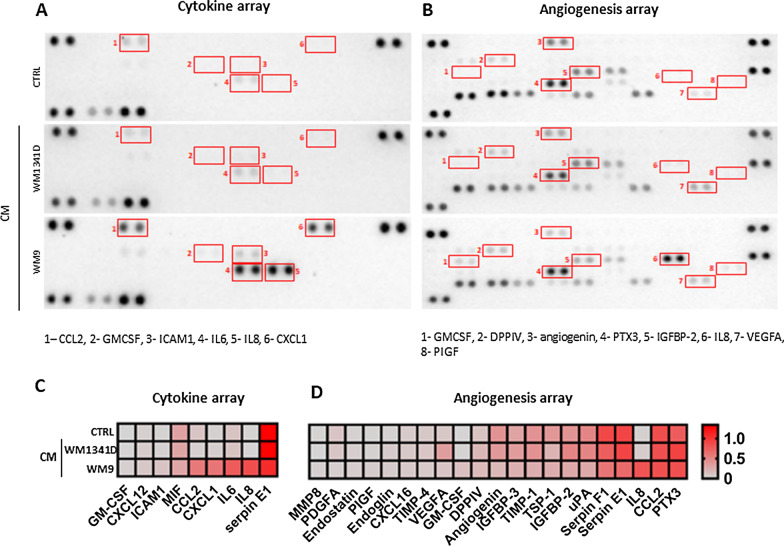
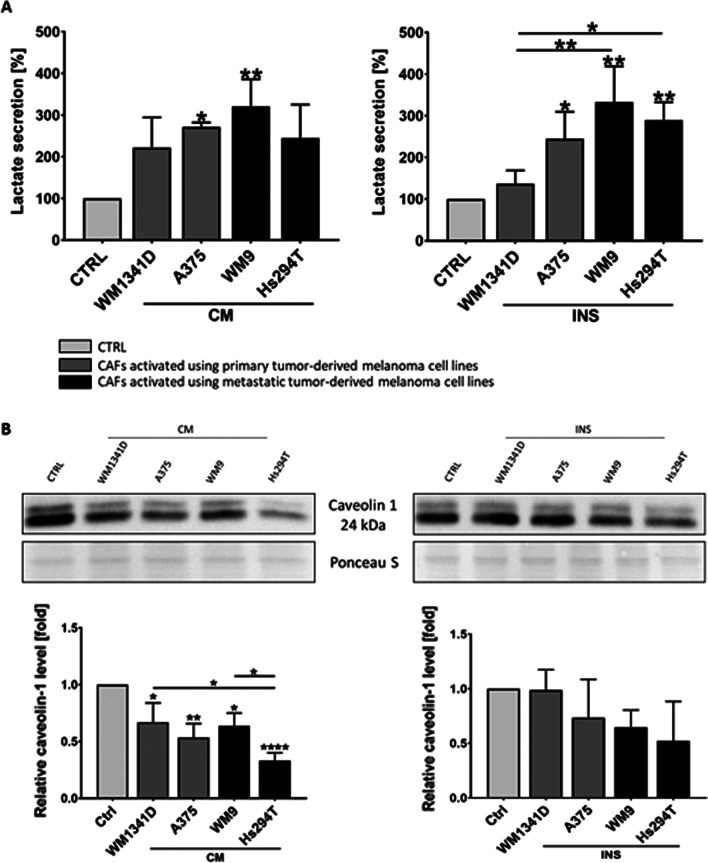
Methods: We obtained CAFs using conditioned media derived from primary and metastatic melanoma cells, and via co-culture with melanoma cells on Transwell inserts. Using 2D and 3D wound healing assays and Transwell invasion method we evaluated CAFs' motile activities, while coverslips with FITC-labeled gelatin, gelatin zymography, and fluorescence-based activity assay were employed to determine the proteolytic activity of the examined cells. Western Blotting method was used for the identification of CAFs' markers as well as estimation of the mediators of MMPs' (matrix metalloproteinases) expression levels. Lastly, CAFs' secretome was evaluated with cytokine and angiogenesis proteomic arrays, and lactate chemiluminescence-based assay.

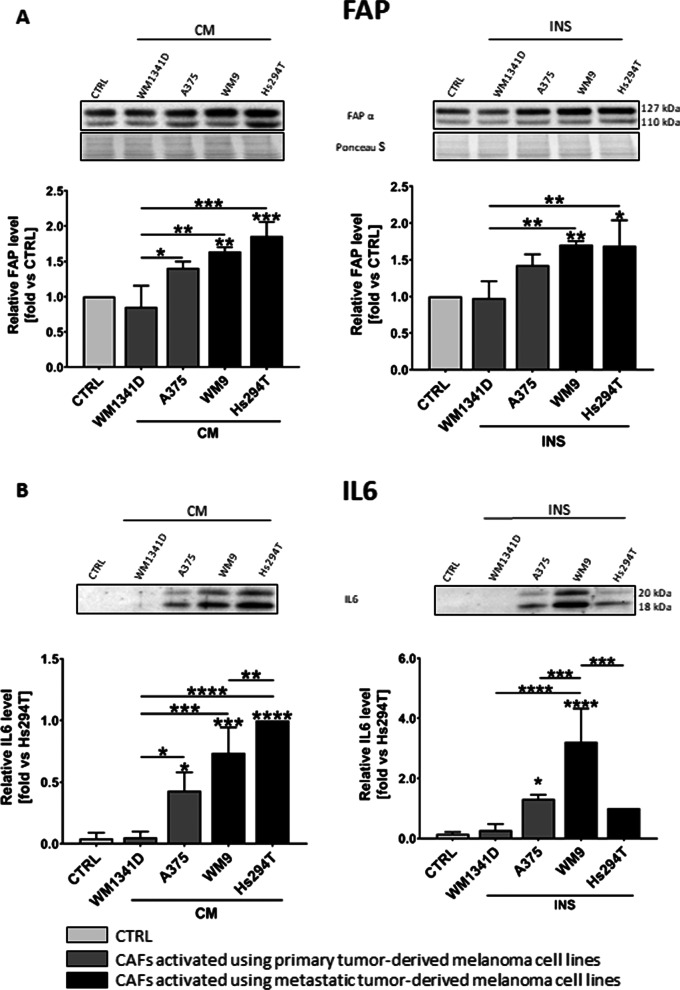
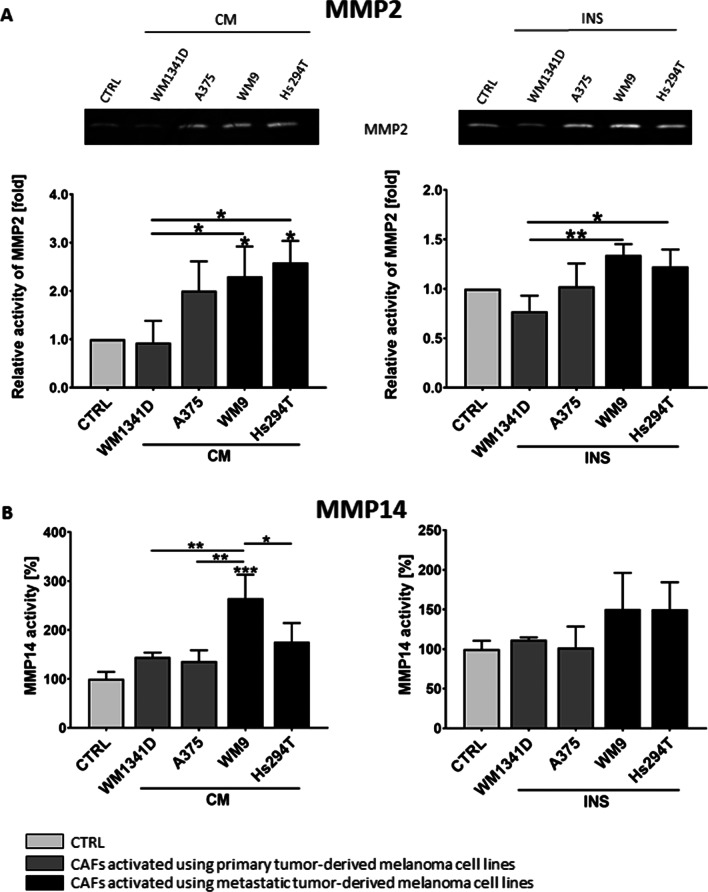
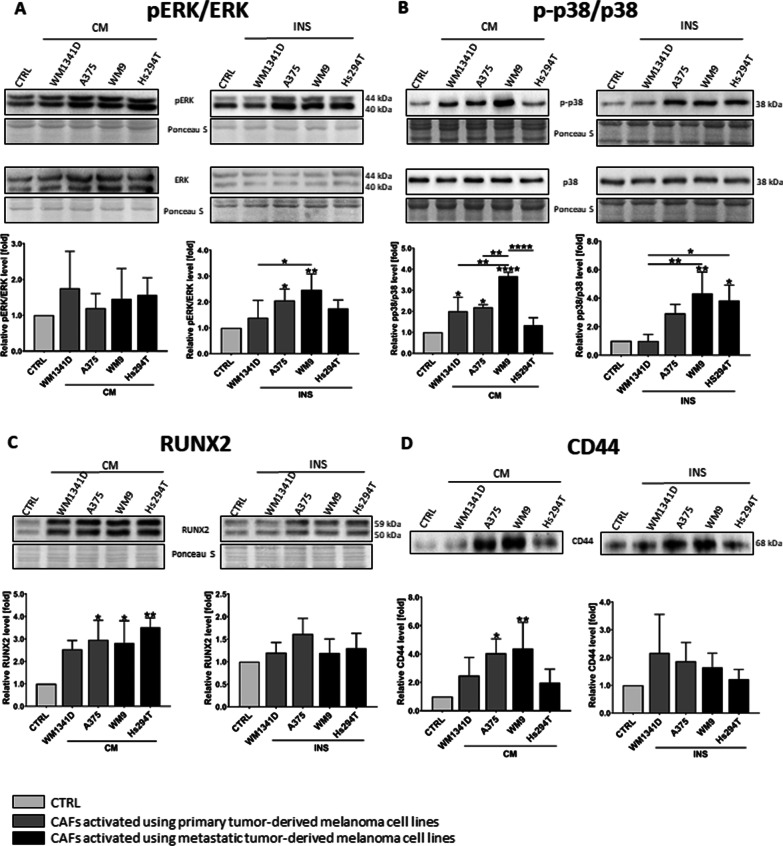
Results: Acquired FAP-α/IL6-positive CAFs exhibited elevated motility expressed as increased migration and invasion ratio, as well as higher proteolytic activity (area of digestion, MMP2, MMP14). Furthermore, fibroblasts activated by melanoma cells showed upregulation of the MMPs' expression mediators' levels (pERK, p-p38, CD44, RUNX), enhanced secretion of lactate, several cytokines (IL8, IL6, CXCL1, CCL2, ICAM1), and proteins related to angiogenesis (GM-CSF, DPPIV, VEGFA, PIGF).

Conclusions: Observed changes in CAFs' biology were mainly driven by highly aggressive melanoma cells (A375, WM9, Hs294T) compared to the less aggressive WM1341D cells and could promote melanoma invasion, as well as impact inflammation, angiogenesis, and acidification of the tumor niche. Interestingly, different approaches to CAFs acquisition seem to complement each other showing interactions between studied cells. Video Abstract.


Conflict of interest statement

The authors declare that there is no conflict of interest.

Figures

Fig. 1
Fig. 1
CAFs acquisition methods. Fibroblasts were cultured in the presence of melanoma cells cultured on Transwell inserts (INS) or with a melanoma-conditioned cell culture medium (CM) for 7 days. Next, cells were harvested and used for further experiments (analysis of migration, invasion, proliferation, level of intracellular proteins involved in cancer progression), or medium was changed for FBM without FBS, collected after 72 h and then used for the analysis of extracellular proteins level
Fig. 2
Fig. 2
Identification of CAFs. Western Blot analysis of protein level of FAP (A) in cell lysates and IL6 (B) in media collected from activated fibroblasts cultured with melanoma-conditioned media (CM) or with melanoma cells growing on Transwell inserts (INS). Signal was normalized to total protein content assessed by Ponceau S staining. Control (CTRL) constitutes fibroblasts cultured in FBM:DMEM (1:1 ratio) media analogous to tested cells. In the case of IL6, due to the lack of signal in CTRL, the fold is set vs signal from the last lane (Hs294T). The mean of at least three biological repetitions ± SD is shown. Asterisks indicate statistically important differences between control cells and CAFs or between different types of CAFs. The significance level was set at p ≤ 0.05 (*), p ≤ 0.01 (**), p ≤ 0.001 (***), and p ≤ 0.0001 (****)
Fig. 3
Fig. 3
Analysis of CAFs’ migratory and invasive abilities obtained in culture with melanoma-conditioned media (CM) or melanoma cells on Transwell inserts (INS). Control (CTRL) constitutes of fibroblasts cultured in FBM:DMEM (1:1 ratio) analogous to tested cells. To investigate migration and invasion A 2D and B 3D wound healing assays were performed. Relative wound density—determined using IncuCyte® Live-Cell Analysis System—is shown. Transwell invasion tests were also conducted (C). The number of control cells that invaded was set as 100%. The relative invasion factor was calculated. All experiments were conducted three times, each performed in triplicate and the mean ± SD is shown. Asterisks indicate statistically important differences between control cells and CAFs or between different types of CAFs. The significance level was set at p ≤ 0.05 (*), p ≤ 0.01 (**), p ≤ 0.001 (***), and p ≤ 0.0001 (****)
Fig. 4
Fig. 4
The influence of melanoma cells on the proteolytic activity of fibroblasts. CAFs obtained using melanoma-conditioned media (CM) and melanoma cells on Transwell inserts (INS) were seeded on coverslips coated with gelatin-FITC (green). Control (CTRL) constitutes of fibroblasts cultured in FBM:DMEM (1:1 ratio) analogous to tested cells. A After 8 h of incubation, cells were fixed and stained using phalloidin to visualize F-actin, which then were used to create a cell mask. Areas of gelatin degradation are visible as dark holes on a green background. Scale bar—25 µm. B Digestion areas were determined in Fiji software. F-actin staining was used to create a cell mask and determine its area. Asterisks indicate statistically important differences between control cells and CAFs or between different types of CAFs. The significance level was set at p ≤ 0.05 (*), p ≤ 0.01 (**), p ≤ 0.001 (***), and p ≤ 0.0001 (****)
Fig. 5
Fig. 5
Matrix metalloproteases’ activity in CAFs. A Images of representative gelatin zymography gels performed on media collected from CAFs. The mean of densitometry quantification of at least three independent repetitions of gelatin zymography ± SD is shown. B As MMP14 is a membrane metalloprotease, its activity was measured in cell lysates collected from CAFs, using a fluorimetric activity assay. The data represent the mean MMP14 activity of three independent measurements ± SD. In both experiments, CAFs were obtained from fibroblasts cultured with melanoma-conditioned media (CM) or with melanoma cells on Transwell inserts (INS). Control (CTRL) constitutes of samples collected from fibroblasts cultured in a composition of FBM:DMEM (1:1 rate) medium. Asterisks indicate differences between control cells and CAFs or between different types of CAFs. The significance level was set at p ≤ 0.05 (*), p ≤ 0.01 (**) and p ≤ 0.001 (***)
Fig. 6
Fig. 6
The expression level of proteins connected to MMPs expression. CAFs were obtained from fibroblasts cultured with melanoma-conditioned media (CM) or with melanoma cells on Transwell inserts (INS). Control (CTRL) constitutes of fibroblasts cultured in a composition of FBM:DMEM (1:1 rate) medium. Representative membranes from Western Blot analysis of regulators of MMPs expression performed using CAFs lysates (pERK, ERK (A), p38 (B), RUNX2 (C)) and CAFs’ conditioned media (CD44 (D)). Signal was normalized to total protein content assessed by Ponceau S staining. At least three repetitions were performed. Asterisks indicate statistically important differences between control cells and CAFs or between different types of CAFs. The significance level was set at p ≤ 0.05 (*), p ≤ 0.01 (**), and p ≤ 0.0001 (****)
Fig. 7
Fig. 7
CAFs’ secretome analysis. To identify proteins secreted by CAFsCM’, conditioned media were used for cytokine (A, C) and angiogenesis (B, D) arrays. Based on obtained signals (A, B) quantitative analysis (C, D) was performed. Densitometric data were normalized to reference spots and are presented in a form of heatmaps, where darker red indicates a higher increase in signal. Abbreviations: CCL2, C-C Motif Chemokine Ligand 2; GM-CSF, Granulocyte–macrophage colony-stimulating factor; ICAM1, Intercellular Adhesion Molecule 1; IL6, interleukin 6; CXCL1, C-X-C Motif Chemokine Ligand 1; DPPIV, Dipeptidyl‐peptidase VI; PTX3, Pentraxin 3; IGFBP-2, Insulin-Like Growth Factor Binding Protein 2; VEGFA, vascular endothelial growth factor A; PIGF, Placental growth factor A; MIF, macrophage migration inhibitory factor; PDGF A, Platelet-derived growth factor; TIMP-4, tissue inhibitor of metalloproteinases 4; TSP-1, Thrombospondin 1; uPA, urokinase-type plasminogen activator
Fig. 8
Fig. 8
Influence of melanoma cells on lactate secretion (A) and caveolin 1 level (B) in CAFs. CAFs were obtained from fibroblasts cultured with melanoma conditioned media (CM) or with melanoma cells on Transwell inserts (INS) for 7 days. Control (CTRL) constitutes of medium collected from fibroblasts cultured in a composition of FBM:DMEM (1:1 rate) medium. The level of secreted lactate was measured using a chemiluminescent reaction (A), whereas caveolin 1 level was estimated in western blotting analysis (B). The mean of at least three independent repetitions ± SD is shown. Asterisks indicate statistically important differences between control cells and CAFs or between different types of CAFs. The significance level was set at p ≤ 0.05 (*), p ≤ 0.01 (**), and p ≤ 0.0001 (****)
Fig. 9
Fig. 9
Crosstalk between melanoma and CAFs. Abbreviations: MMP, matrix metalloproteinase; p-p38, phosphorylated-p38; pERK, phosphorylated extracellular signal-regulated kinase; CD44, cluster of differentiation 44; RUNX2, runt-related transcription factor 2; CCL2, C-C Motif Chemokine Ligand 2; CXCL1, C-X-C Motif Chemokine Ligand 1; GM-CSF, Granulocyte–macrophage colony-stimulating factor; ICAM1, Intercellular Adhesion Molecule 1; IL6, interleukin 6; VEGFA, vascular endothelial growth factor A; PIGF, Placental growth factor; IGFBP-2, Insulin-Like Growth Factor Binding Protein 2; DPPIV, Dipeptidyl‐peptidase VI; TGFβ, transforming growth factor-beta; Cav-1, caveolin 1; CAFs, cancer-associated fibroblasts

References

    1. Williams PF, Olsen CM, Hayward NK, Whiteman DC. Melanocortin 1 receptor and risk of cutaneous melanoma: a meta-analysis and estimates of population burden. Int J Cancer. 2011;129:1730–1740. doi: 10.1002/ijc.25804. - DOI - PubMed
    1. Ruiter D, Bogenrieder T, Elder D, Herlyn M. Melanoma–stroma interactions: structural and functional aspects. Lancet Oncol. 2002;3:35–43. doi: 10.1016/S1470-2045(01)00620-9. - DOI - PubMed
    1. Falcone I, Conciatori F, Bazzichetto C, Ferretti G, Cognetti F, Ciuffreda L, Milella M. Tumor microenvironment: implications in melanoma resistance to targeted therapy and immunotherapy. Cancers. 2020;12:2870. doi: 10.3390/CANCERS12102870. - DOI - PMC - PubMed
    1. Gascard P, Tlsty TD. Carcinoma-associated fibroblasts: orchestrating the composition of malignancy. Genes Dev. 2016;30:1002–1019. doi: 10.1101/gad.279737.116. - DOI - PMC - PubMed
    1. Busse A, Keilholz U. Role of TGF-β in Melanoma. Curr Pharm Biotechnol. 2011;12:2165–2175. doi: 10.2174/138920111798808437. - DOI - PubMed

Publication types