

Using genomic prediction to detect microevolutionary change of a quantitative trait
- PMID: 35538786
- PMCID: PMC9091855
- DOI: 10.1098/rspb.2022.0330
Using genomic prediction to detect microevolutionary change of a quantitative trait
Abstract
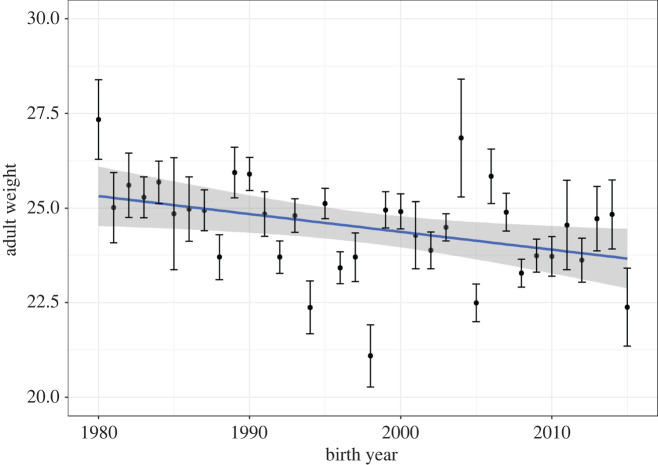
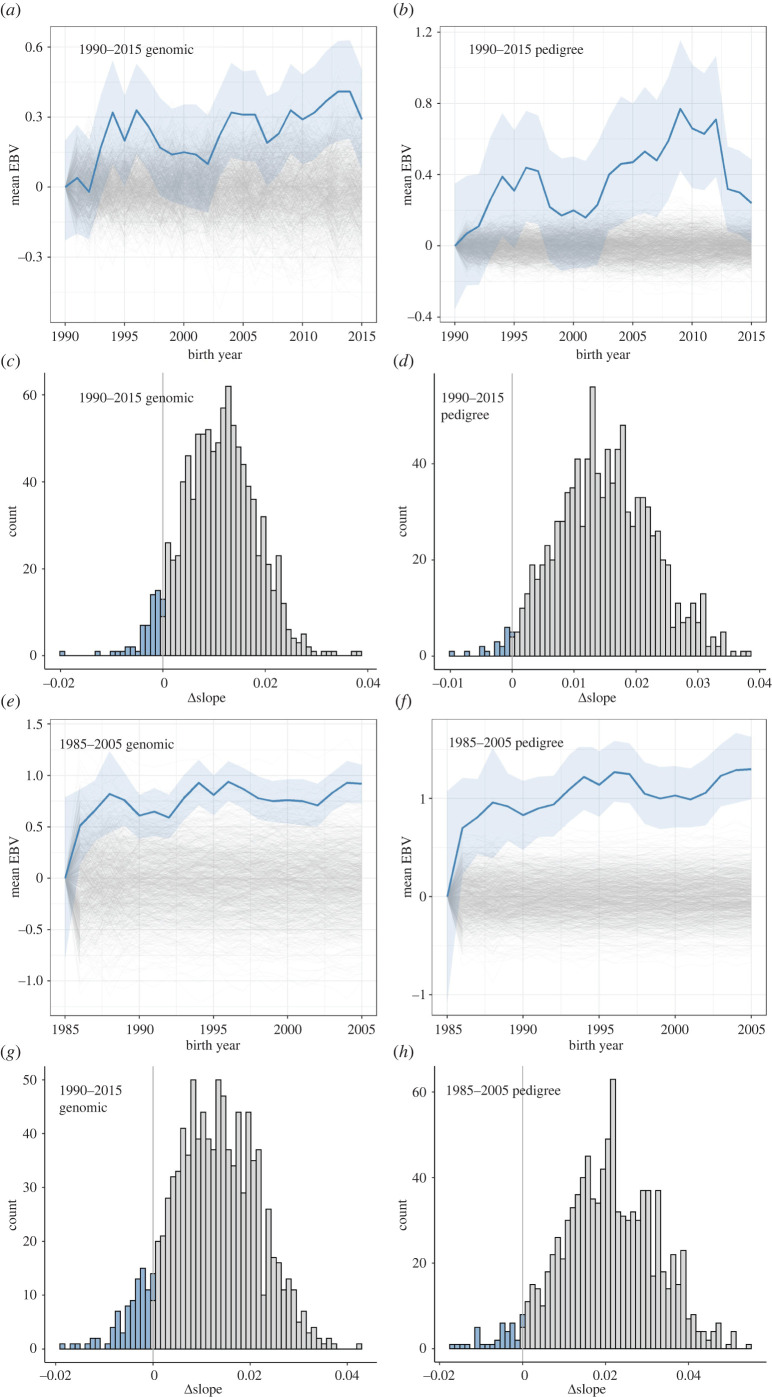
Detecting microevolutionary responses to natural selection by observing temporal changes in individual breeding values is challenging. The collection of suitable datasets can take many years and disentangling the contributions of the environment and genetics to phenotypic change is not trivial. Furthermore, pedigree-based methods of obtaining individual breeding values have known biases. Here, we apply a genomic prediction approach to estimate breeding values of adult weight in a 35-year dataset of Soay sheep (Ovis aries). Comparisons are made with a traditional pedigree-based approach. During the study period, adult body weight decreased, but the underlying genetic component of body weight increased, at a rate that is unlikely to be attributable to genetic drift. Thus cryptic microevolution of greater adult body weight has probably occurred. Genomic and pedigree-based approaches gave largely consistent results. Thus, using genomic prediction to study microevolution in wild populations can remove the requirement for pedigree data, potentially opening up new study systems for similar research.
Keywords: cryptic evolution; genomic estimated breeding value; genomic prediction; microevolution; soay sheep.
Conflict of interest statement
We declare we have no competing interests.
Figures
Similar articles
-
Genomic prediction in the wild: A case study in Soay sheep.Mol Ecol. 2022 Dec;31(24):6541-6555. doi: 10.1111/mec.16262. Epub 2021 Nov 10. Mol Ecol. 2022. PMID: 34719074
-
Comparison of genetic parameters and estimated breeding values for worm resistance in meat sheep obtained using traditional and genomic models.Trop Anim Health Prod. 2021 Apr 23;53(2):283. doi: 10.1007/s11250-021-02705-3. Trop Anim Health Prod. 2021. PMID: 33890183
-
Efficient approximation of reliabilities for single-step genomic best linear unbiased predictor models with the Algorithm for Proven and Young.J Anim Sci. 2022 Jan 1;100(1):skab353. doi: 10.1093/jas/skab353. J Anim Sci. 2022. PMID: 34877603 Free PMC article.
-
Genomic prediction of breeding values in the New Zealand sheep industry using a 50K SNP chip.J Anim Sci. 2014 Oct;92(10):4375-89. doi: 10.2527/jas.2014-7801. Epub 2014 Aug 22. J Anim Sci. 2014. PMID: 25149326
-
Current status of genomic evaluation.J Anim Sci. 2020 Apr 1;98(4):skaa101. doi: 10.1093/jas/skaa101. J Anim Sci. 2020. PMID: 32267923 Free PMC article. Review.
Cited by
-
The utility of genomic prediction models in evolutionary genetics.Proc Biol Sci. 2021 Aug 11;288(1956):20210693. doi: 10.1098/rspb.2021.0693. Epub 2021 Aug 4. Proc Biol Sci. 2021. PMID: 34344180 Free PMC article.
-
Taking quantitative genomics into the wild.Proc Biol Sci. 2022 Dec 21;289(1989):20221930. doi: 10.1098/rspb.2022.1930. Epub 2022 Dec 21. Proc Biol Sci. 2022. PMID: 36541172 Free PMC article.
-
Joining forces to push past paradoxes: Combining quantitative genetics and genomics shows evolution hiding in plain sight.Proc Natl Acad Sci U S A. 2024 Oct 15;121(42):e2417220121. doi: 10.1073/pnas.2417220121. Epub 2024 Oct 7. Proc Natl Acad Sci U S A. 2024. PMID: 39374404 Free PMC article. No abstract available.
-
Evaluating regional heritability mapping methods for identifying QTLs in a wild population of Soay sheep.Heredity (Edinb). 2025 Jun;134(6):374-386. doi: 10.1038/s41437-025-00770-0. Epub 2025 May 23. Heredity (Edinb). 2025. PMID: 40410366 Free PMC article.
-
The challenge of demonstrating contemporary natural selection on polygenic quantitative traits in the wild.Mol Ecol. 2022 Dec;31(24):6383-6386. doi: 10.1111/mec.16761. Epub 2022 Nov 15. Mol Ecol. 2022. PMID: 36325827 Free PMC article.
References
-
- Lush JL. 1943. Animal breeding plans, 2nd edn. Ames, IA: Iowa State College Press.
-
- Falconer D. 1989. Introduction to quantitative genetics, 3rd edn. New York, NY: Longman.
Publication types
MeSH terms
Associated data
LinkOut - more resources
Full Text Sources
